


 nueva página del texto (beta)
 Inglés (pdf)
 Artículo en XML
 Referencias del artículo
 Enviar artículo por email
 Citado por SciELO
  Similares en
SciELO
Similares en
SciELO 
 Permalink
Introduction
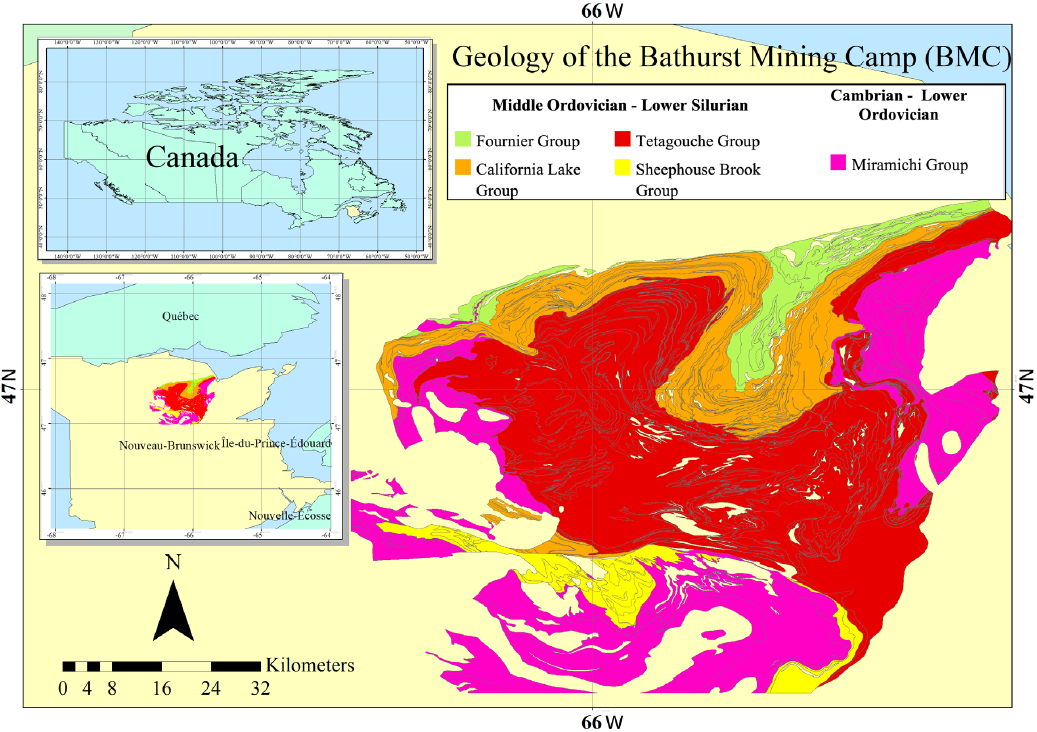
The Bathurst Mining Camp (BMC) is located north of the Miramichi Highlands of New Brunswick (Fig. 1) and is one of the most important base-metal mining districts in Canada, hosting numerous deposits and massive sulfide occurrences related to volcanic activity (Goodfellow 2007). Many of these deposits are close to the surface and have been exploited for many years. However, the next generation of deposits is probably buried deeper than those currently being exploited, and it becomes necessary to have a better knowledge of the subsoil of the main geological units. The general objective of this study is to perform an analysis and modeling of the upper crustal structure of this area using the public gravimetric data acquired in the Bathurst Mining Camp, in order to contribute to the geological understanding of the main characteristics of the upper crust, such as depth and general geometry of the main regional mapped structures.
The Bathurst Mining Camp was a focus area of the Geological Survey of Canada's Targeted Geoscience Initiative Phase 3 project, which aimed to provide new geoscience knowledge to support mining exploration activities. As part of the mentioned project, the Geological Survey of Canada conducted a gravimetric survey in 2006, which led to the acquisition of over 3500 new gravity measurements, with an average spacing of 1-2 km.
The gravity data used in this study was downloaded from the Geoscience Data Repository of Natural Resources Canada (https://geophysical-data.canada.ca/Portal/Search). The current study provides first a qualitative analysis of the regional gravimetric data, followed by 2.5D gravity forward models along five profiles that cross the BMC, which offer a perspective on the geometry of the upper crustal structures and geological bodies of the area. The results of this study contribute to the geological understanding of the main characteristics of the upper crust in the BMC.
Regional Geology
The Bathurst Mining Camp is a mining district located in the zone of Bathurst, northeastern New Brunswick, Canada. It occupies an approximately circular area with a diameter of about 70 km and has 46 major mineral deposits and more than 100 mineral occurrences (Goodfellow 2003). These deposits are hosted by Cambro-Ordovician rocks that were deposited in a retro-arc ensialic basin developed on the Gondwana continental margin of the northern Appalachians (Goodfellow 2003). The Bathurst Mining Camp has been subdivided into four coeval groups of volcanic and sedimentary rocks (Fig. 1): Tetagouche, California Lake, Sheephouse Brook, and Fournier. These groups overlap with older sedimentary rocks of the Miramichi Group, which correspond to an ancient passive continental margin (Goodfellow 2007).
Most of the massive sulfide deposits in the Bathurst Mining Camp are hosted by the Tetagouche and California Lake groups. The California Lake group contains approximately the same proportions of mafic and felsic volcanic rocks and probably represents the marginal basin that overlaps both oceanic crust and continental crust. The Tetagouche group, in contrast, consists of volcanic-felsic rocks and was possibly deposited in a basin of mostly continental crustal extension origin (Van Staal 2003). The massive sulfide deposits in these groups are associated with submarine volcanic calco-felsic rocks that formed from molten continental crust during the early stages of retro-arc creation. The subsequent process of retro-arc formation produced hyaloclastites and alkaline and tholeiitic (sub-alkaline) basalt flows resulting in a bimodal volcanic sequence (Goodfellow 2007).
Structurally, the Bathurst Mining Camp shows a pattern of interference produced by polyphase deformation (Goodfellow et al. 2003a). A first deformation event caused thrust faults and overturned isoclinal folds with axial planar foliation (Late Ordovician - Early Silurian), which formed under high-pressure greenschist and blueschist facies conditions. A second deformation caused tight to isoclinal folds with shallowly to steeply plunging fold axes accompanied by steeply-dipping axial planar cleavages formed under greenschist facies conditions (Late Silurian). Then, a third deformation event caused open to tight recumbent folds (Late Silurian). Finally, a fourth regional scale deformation event caused north-northeast- to the south-southwest-trending folds and cleavages (Early Devonian) (Ugalde et al. 2019).
It is interpreted that due to dextral transpression of the northern Appalachians during the Middle Devonian, the above-mentioned structures were folded again resulting in the formation of new folds. This late deformation led to the formation of dome structures, basins, and relevant structures of the zone such as the Pabineau Syncline, the Pabineau Anticline (Van Staal and Williams 1984), the Nine Mile Syncline and the Tetagouche Anticline (Van Staal 1986). The faults and axes of the current folds are shown in Fig. 2.
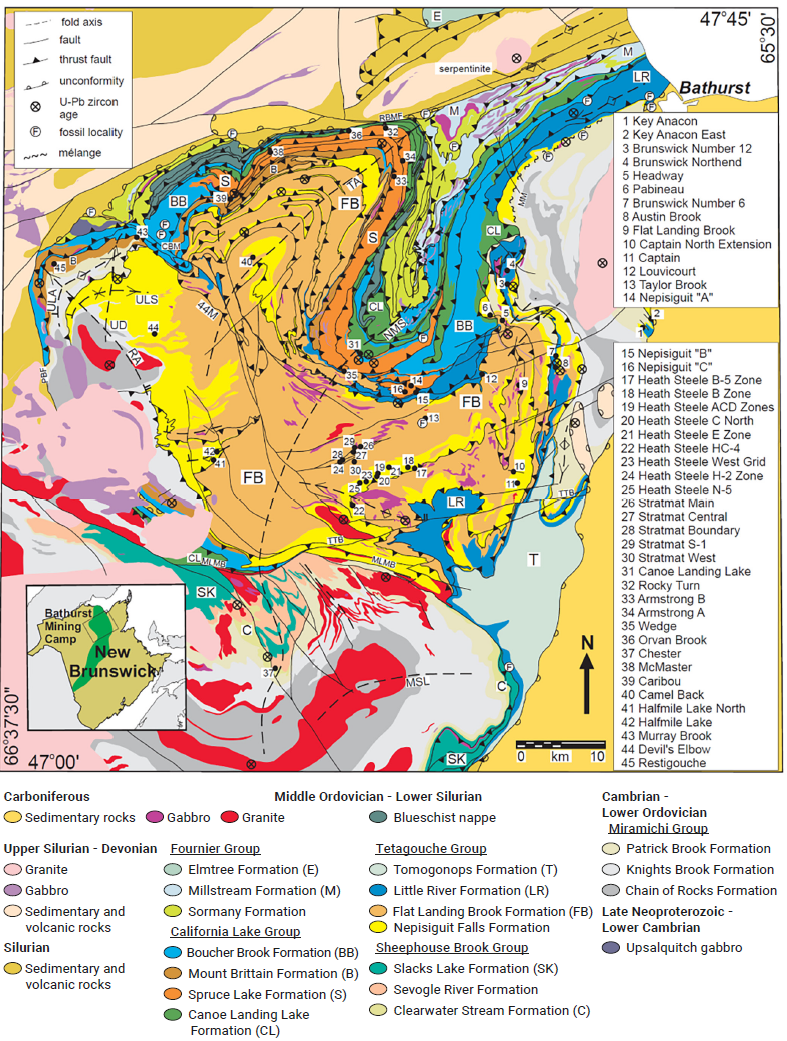
Figure 2 General geology of the BMC and major massive sulfide deposits hosted in volcano-sedimentary rocks. MLMB - Moose Lake-Mountain Brook fault; MSL - Mullin Stream Lake Syncline; TA - Tetagouche anticline; TTB -Tomogonops - Tozer Brook fault; UD - Upsalquitch Dome; ULA - Upsalquitch Lake anticline; ULS - Upsalquitch Lake Syncline; NMS - Nine Mile Syncline. Image taken from Goodfellow (2007).
Methodology
The gravimetric data used in this study were collected as part of the Geological Survey of Canada's Targeted Geoscience Initiative Phase 3 (TGI3) project at Bathurst Mining Camp (BMC) in Canada. These data were downloaded from the Geophysical Data Repository of Natural Resources Canada (https://geophysical-data.canada.ca/) and formed the basis of the study.
In addition, a comprehensive review of the existing literature on the geology and physical properties of the Bathurst Mining camp was completed, in order to properly contextualize and understand its geological setting and characteristics.
The Bouguer anomaly data was recalculated for an average crustal density of 2.77g/cm3, based on the density values of the rocks in the BMC (Thomas 2003).
An initial qualitative analysis of the Bouguer anomaly data was performed to estimate the relationship between the densities of the different geological groups present in the study area. Also, a power spectrum analysis was carried out. This analysis provided estimates of the depth ranges of the geological structures in the study area.
Based on the available geological information and the qualitative analysis of the gravity data, 2.5D forward gravity modeling was performed along several transects that were considered representative for the description of the regional geologic features and structural relationships in the BMC.
For the construction of 2.5D models along the selected transects, the GM-SYS tool of Geosoft Oasis Montaj version 9.7.1 was used. These models incorporated key factors such as the density contrasts between geological groups, the depth of the structures estimated by the power spectrum analysis and known structural characteristics of the area, such as regional folds.
Additionally, the modeling process was guided by the assumptions that the modeled geologic groups are characterized by horizontal continuity and constant thickness across the BMC.
The models were constrained by the mapped position of the main geologic groups at surface and the modeling process was carried out by adjusting the modeled bodies so as to minimize the Root Mean Square Error (RMSE) value with respect to the observed Bouguer anomaly along each transect.
Gravity Data
The Bathurst Mining Camp was a focus area of the Targeted Geoscience Initiative Phase 3 project, which aimed to provide new geoscience expertise to support mining exploration activities. As part of the mentioned project, the Geological Survey of Canada conducted a gravimetric survey in 2006, which led to the acquisition of over 3500 new gravity data with an average spacing of 1-2 km, which significantly improved the resolution of the gravity field in this area (Fig. 3). The new gravity data were collected by the Geodetic Research Division of Natural Resources Canada using four LaCoste and Romberg gravimeters.
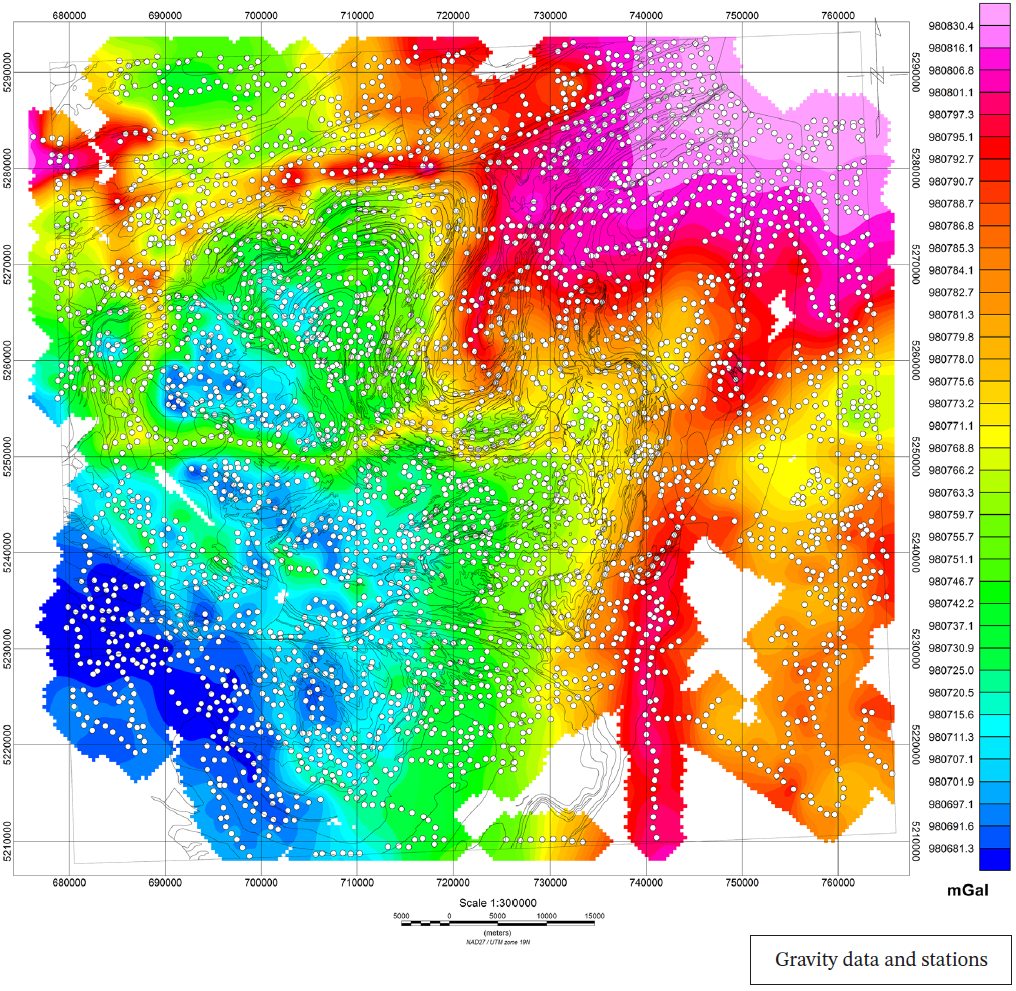
Figure 3 Raw gravimetric data and stations where they were taken represented on the map by white circles. Coordinate system NAD-27/UTM zone 19.
All new gravimetric observations were referenced to the Canadian Gravity Standardization Network. The positioning of the gravity stations was determined using a differential GPS of geodetic quality. The raw gravity data acquired in 2006 by the Targeted Geoscience Initiative Phase 3 project was processed (reduced) by Geomatics Canada. More specifications on the data acquisition can be found in the Geoscience Data Repository (https://geophysical-data.canada.ca/Portal/Search).
Qualitative Analysis
The Bouguer anomaly represents the gravitational effects caused by geology under a point obtained through the difference between the observed gravity and the gravity of a model of the earth at that point. The Bouguer anomaly reflects the effects of mass excesses and deficiencies relative to the model of the earth.
The Bouguer anomaly values considered in this paper were obtained by assuming an average upper crustal density of ρg =2.77g/cm3 due to the extensive presence of igneous rocks of mafic composition in the area (Thomas 2003). This procedure was carried out following the Geomatics Canada protocol. The resulting Bouguer anomaly map is shown in Fig. 4. To facilitate the understanding of the location of the geologic groups in the Bouguer anomaly, the reader may refer to Fig. 1 and 2.
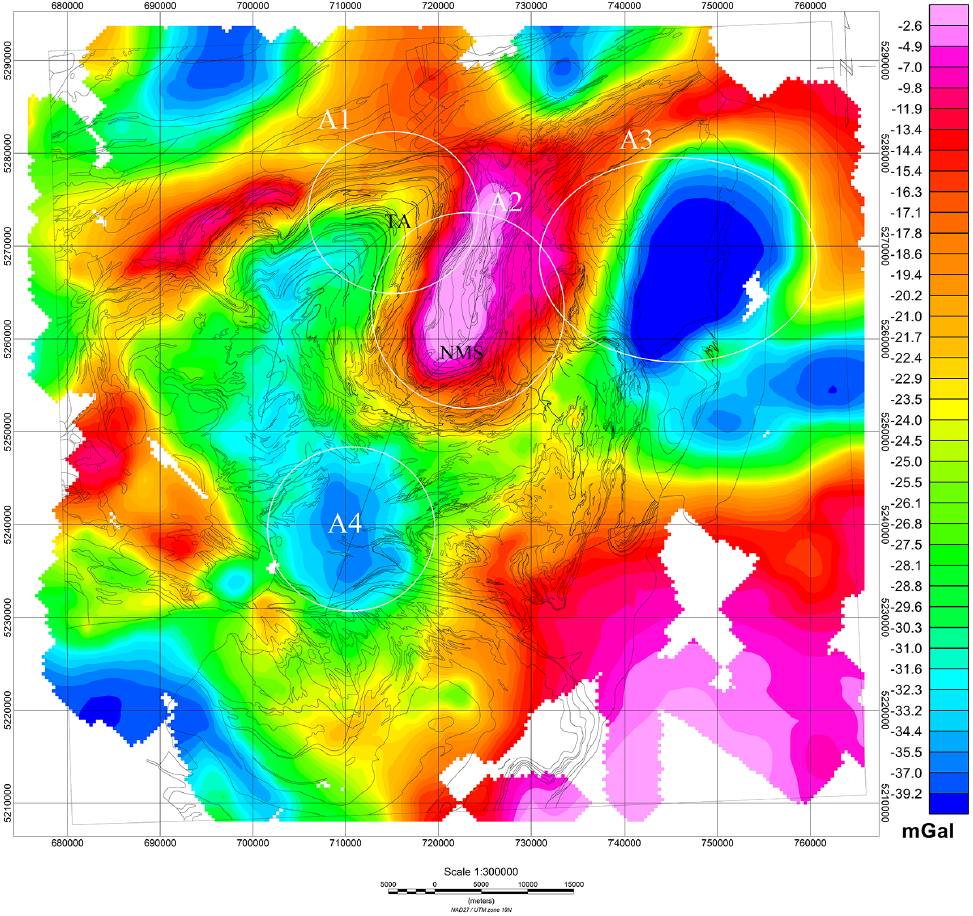
Figure 4 Bouguer anomaly of the BMC calculated for an overall density pg of 2.77g/cm3. Axes of the Tetagouche Anticline (TA) and Nine Mile Syncline (NMS) are shown. The plotted curves correspond to the contours of the lithology of the BMC. Enclosed in white circles: Areas A1, A2, A3 and A4. Coordinate system NAD-27/UTM zone 19.
It can be noticed that in the area A1 (Tetagouche Anticline area) the Bouguer gravity shows a symmetric pattern relative to the Tetagouche Anticline axis, with the value of the Bouguer anomaly increasing away from the axis of the anticline. This pattern suggests that the layers in the core of the fold are less dense than the layers towards the outside area. Therefore, based on this observation, we assume that the density of the Tetagouche group should be lower than that of the California Lake group: ρCalifornia > ρTetagouche.
On the other hand, in the area A2, Bouguer gravity high correlates with the axis of the Nine Mile Syncline. This gravity anomaly also shows some symmetry relative to the fold axis, but here the pattern is that the value of the Bouguer anomaly decreases away in a transversal direction from the Syncline axis. Considering the type of structure, this behavior of the anomaly suggests that the layers in the core of the fold are denser than the layers on the outside of it. In this case, the geological group that crops out along the Nine Mile Syncline axis and corresponds to its core is the Fournier group, while the one that crops out around the core is the California Lake group. Consequently, based on this observation, it is inferred that that the Fournier group must have a higher average density than the California Lake group: ρFournier > ρCalifornia.
In contrast, the lowest values of the Bouguer anomaly in the study area are found in the A3 zone (Fig. 4), suggesting that less dense rocks are hosted in this zone compared to the rest of the study area. When consulting the lithology, it is obtained that in the part that corresponds to the minimum of the anomaly there is a granite body, and next to it, the Miramichi group, which outcrops in the area between the Tetagouche group and the mentioned granite body. Within the western part of this same area (A3) crops out the Tetagouche group and presents values of the Bouguer anomaly higher than those presented by the Miramichi group. From the above, it is assumed that the Tetagouche group must be denser than the Miramichi group and the latter must be denser than the granite body: ρTetagouche > ρMiramichi > ρGraniteBody. When looking at the transition of the Bouguer anomaly between the areas A1 and A2 and the areas A2 and A3 it can be clearly seen that this is consistent with the relationship between densities that was proposed above.
Another aspect to be pointed out is that in the areas A1, A2 and A3 and the area around A4 (green area), by comparing the outcropping lithological groups and the Bouguer anomaly, it becomes evident that the values of the anomaly seem to be homogeneous at the points where the same geological group crops out. This allows us to infer that although the groups are composed of several formations, an average density value could be considered for each group. Based on this consideration, it was assumed for the modeling of the gravity data that the average density of each group is constant throughout the Bathurst Mining Camp and that the relationship between the average density values of the different groups is: ρFournier > ρCalifornia > ρTetagouche > ρMiramichi.
In the area A4 a local minimum is observed (Fig. 4) even though in that zone mainly the Tetagouche Group crops out. Considering the chronostratigraphic order and the relationship between densities mentioned above, it could be inferred that the Miramichi group is closer to the surface in the A4 area, possibly forming a dome structure.
Power spectrum analysis
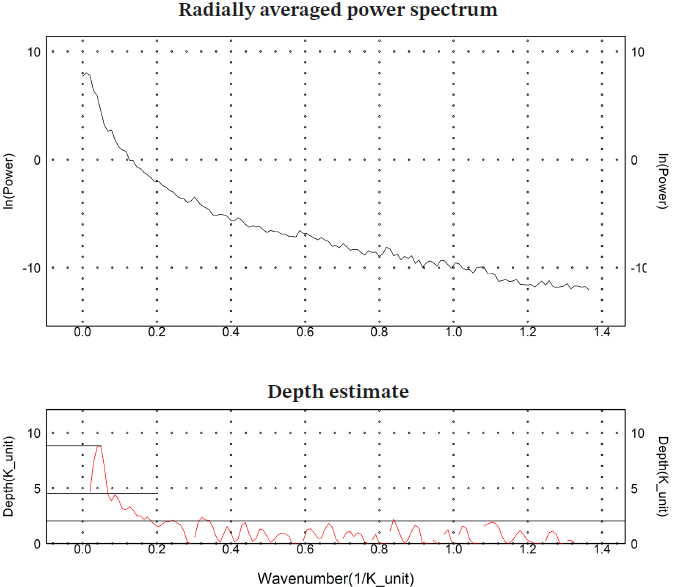
After the initial application of a Butterworth filter to the Bouguer anomaly in order to reduce noise, the power spectrum was calculated from the filtered Bouguer anomaly of the BMC. The power spectrum allows the estimation of the depth ranges of the regional structures and geological bodies that are reflected in the gravity data. This is possible since the deeper mass anomalies are translated in the power spectrum as lower frequencies, whereas the shallower mass anomalies are manifested in the power spectrum as higher frequencies (Maus and Dimri 1996). The estimation of the depth ranges of the mass anomalies in the Bathurst Mining Camp was obtained from the spectral analysis (Fig. 5) and suggests that structures located at great depth are 9-5 km from the surface, those at medium depth at 5-2 km and those at shallow depth at 2-0 km.
2.5D MODELING
For the 2.5D modeling of the selected transects (see Fig. 6) the location of the contacts between the geological groups on the surface, the location of the fold axes and their type (synclinal or anticlinal), the relation of densities that the groups should follow according to previous results and the depth ranges for structures with high, medium, and low depth obtained in the previous analysis of the power spectrum were considered. The assumption that the groups respect the chronostratigraphic order in all points and that they had horizontal continuity, which was lost due to deformation and erosion processes, was also considered. The following models were made using the GM-SYS tool of the Geosoft Oasis Montaj - Educational software edition version 9.7.1, from the profiles of the Bouguer anomaly shown in Fig. 6.
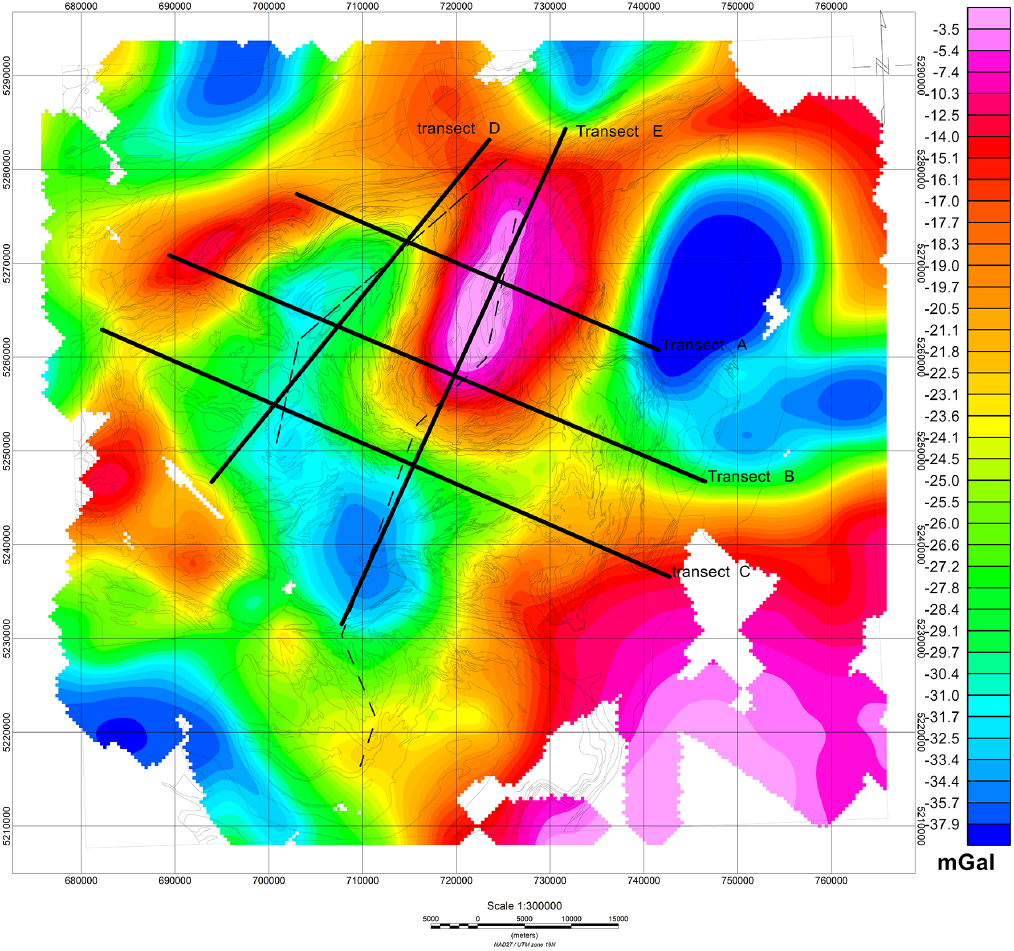
Figure 6 Bouguer anomaly with Butterworth filter. This map shows the Bouguer anomaly without effects caused by local anomalies. On the map are shown the transects selected for gravity modeling. The axes of the Tetagouche Anticline (left) and the Nine Mile Syncline (right) are shown in dashed black lines. NAD-27/UTM zone 19 coordinate system.
As the models are two-and-a-half-dimensional, their capacity to represent the geometry of the structures in the direction perpendicular to the profiles is limited. Nonetheless, selecting transects parallel or transverse to the primary fold axes allows for a more comprehensive visualization of the structural geometry within the BMC. To determine the positions of folds and geological contacts, we utilized mapping and structural shapefiles from the Geoscience Data Repository of Canada. Furthermore, density estimations for the geological groups were based on the density log obtained from drill core BR212-10, extracted from the Canoe Landing Lake area (Table 1).
Table 1 Density log based on measurements made to the BR212-10 drill core which was taken from the Canoe Landing Lake reservoir property. [Mike Thomas, Geological Survey of Canada, personal communication to Bogdan Nitescu]
| Mineral deposits | Host Rock | ||
|---|---|---|---|
| Mineral | density (g/cm3) | Rock | density (g/cm3) |
| Chalcopyrite | 4.2 | Felsic Volcanoclastics | 2.8 |
| Pyrite | 5.02 | Volcanic tuffs , Rhyolites | 2.7 |
| Pyrrhotite | 4.62 | Acid tuffs, Porphyritic rhyolites | 2.73 |
| Sphalerite | 4 | Mafic tuffs, Volcanoclastics | 2.91 |
| Galena | 7.5 | Basalt | 2.89 |
| Magnetite | 5.18 | Argillite | 2.82 |
| Hematite | 5.26 | Siltstone y Greywacke | 2.76 |
Model A
This model was made perpendicular to the general direction of the axes of the Tetagouche Anticline and Nine Mile Syncline in a northwest-southeast direction north of the Bathurst supergroup. It starts from point 703926E, 5276978N (NAD 27/UTM zone 19N) with an azimuth of 113.3° N and covers approximately 40 km.
When analyzing the proposed model in Figure 7 it is observed that the highest peak of the Bouguer anomaly is not over the location of the Nine Mile Syncline axis but more to the northwest. The same phenomenon occurs with the location of the lowest peak with respect to the axis of the Tetagouche Anticline. Based on the above, the model was started with the premise that the axial planes of the Nine Mile Syncline and the Tetagouche Anticline have a dip in a northwesterly direction, since the location of the maximum or minimum of the Bouguer anomaly on this type of structures should be consistent with the point where the geological layers change direction, that is: the axial plane of the folds.
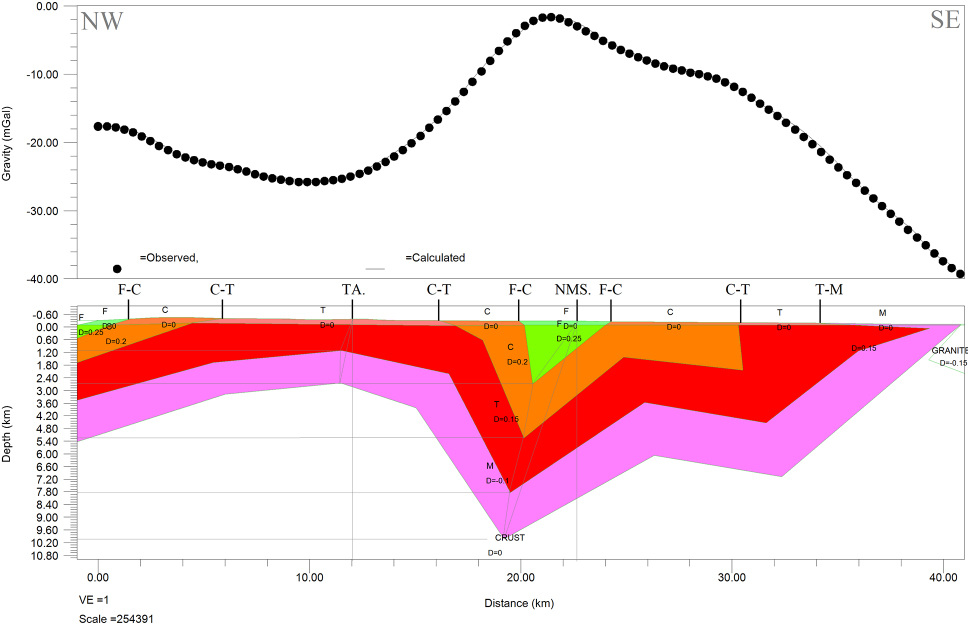
Figure 7 Gravimetric modeling of Transect A: from 703926E, 5276978N to 741417E, 5260832N (NAD 27/UTM zone 19N). In green color, Fournier Group (F), ΔρF = 0.25g/cm3; In orange color, California Lake Group (C), ΔρC = 0.2g/cm3; In red color, Tetagouche Group (T), ΔρT =0.15g/cm3; In pink color, Miramichi Group (M), ΔρM =-0.1g/cm3. Location on geologic contact profile: Fourier- California Lake groups (F-C), California Lake- Tetagouche groups (C-T), Tetagouche-Miramichi groups (T-M). Location on the profile of fold axes: Tetagouche Anticline (TA.), Nine Mile Syncline (NMS.), Tetagouche Anticline (TA.), Nine Mile Syncline (NMS.). Mile Syncline (NMS.). RMS Error=0.222.
Regarding the depth reached by the four groups in the profile, it is observed that the deepest point is under the intersection with the Nine Mile Syncline and is around 10 km. On the other hand, one of the lowest points reached by the modeled stratigraphic package is under the intersection with the Tetagouche Anticline, reaching approximately 2.5 km.
In the right part of the model, around km-40, a Granite fraction was added, which is part of a larger igneous body. The presence of this structure was relevant for the construction of the model, because at that point the anomaly drops drastically. The location of this body can be observed in Fig. 2 and is coherent with its positioning in the transect.
As for the densities, a contrast was assigned to each group with respect to the average density of the crust considering the density values shown by Thomas (2003) for different types of rocks in the BMC. These values are: ΔρF=0.25 g/cm3 for the Fourier group, ΔρC=0.2 g/cm3 for the California Lake group, ΔρT=0.15 g/cm3 for the Tetagouche group, ΔρM=-0.1 g/cm3 for the Miramichi group and Δρ_GRANITE =-0.15 g/cm3 for the external igneous body. The above contrasts satisfy the Bouguer anomaly response.
To the southeast of the profile, between kilometer 30 and 40, the Tetagouche group seems to extend further to the southeast than its surface contact with the Miramichi group. This phenomenon is strange in comparison with the general behavior of the rest of the profile, so it could also be explained by assuming an increase in the density of the Tetagouche group.
Model B
This model was made perpendicular to the general direction of the axes of the Tetagouche Anticline and the Nine Mile Syncline, starts at point 690325E, 5270463N (NAD 27/UTM zone 19N) with an azimuth of 112.9°N and covers approximately 60km.
When analyzing the proposed model in Figure 8, it is observed that it has similarities with Transect A in terms of the location of the maxima and minima of the anomaly with respect to the location of the main fold axes. Following the same reasoning as in the previous model, it is observed that the axial planes of the Nine Mile Syncline and the Tetagouche Anticline must also dip in a northwest direction at the intersection with this transect.
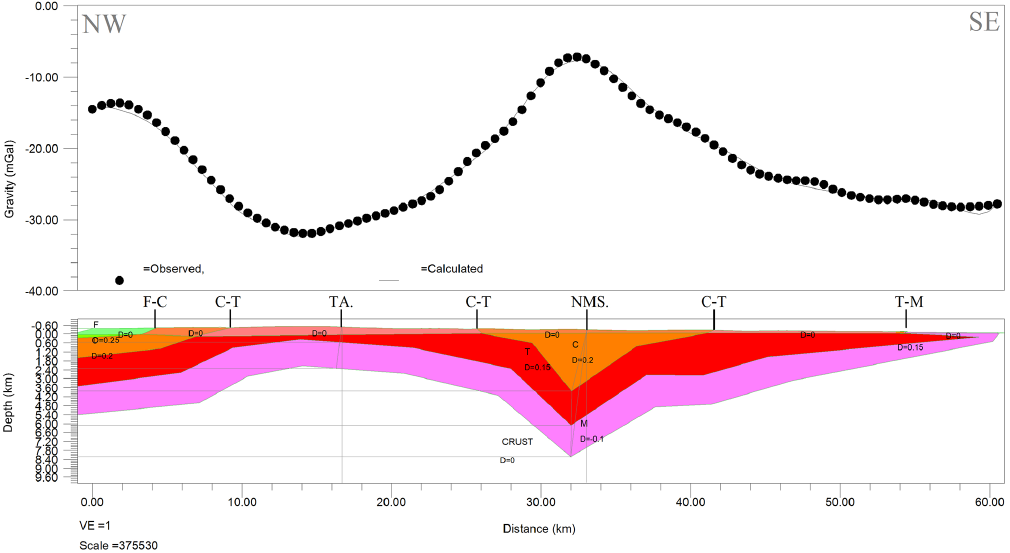
Figure 8 Gravimetric modeling of Transect B: from 690325E, 5270463N to 746085E, 5246910N (NAD 27/UTM zone 19N). In green color, Fournier Group (F), ΔρF = 0.25g/cm3; In orange color, California Lake Group (C), ΔρC =0.2g/cm3; In red color, Tetagouche Group (T), ΔρT =0.15g/cm3; In pink color, Miramichi Group (M), ΔρM =-0.1g/cm3. Location on the Geologic Contacts profile: Fourier- California Lake groups (F-C) , California Lake- Tetagouche groups (C-T), Tetagouche-Miramichi groups (T-M). Location on the profile of fold axes: Tetagouche Anticline (TA.), Nine Mile Syncline (NMS.), Tetagouche Anticline (TA.), Tetagouche Anticline (TA.). Nine Mile Syncline (NMS.). RMS Error=0.469.
Regarding the depth reached by the four groups in this profile, it is observed that the deepest point is again below the intersection with the Nine Mile Syncline and is around 8 km. On the other hand, the structures modeled under the intersection with the Tetagouche Anticline reach a depth of approximately 2 km.
In terms of densities, these results demonstrate that the same set of density contrasts proposed in transect A explains the gravity response effectively while maintaining a simplified subsurface model. Additionally, a recurring pattern is observed to the southeast of the profile, approximately at kilometer 50, where it appears that the Tetagouche group extends further to the southeast once again.
Model C
This model was made perpendicular to the general direction of the axes of the Tetagouche Anticline and the Nine Mile Syncline, starts at point 683127E, 5262521N (NAD 27/UTM zone 19N) with an azimuth of 113.5° N and covers approximately 60km. When analyzing the model proposed in Figure 9 it is observed that, although the effects produced by the Tetagouche Anticline and the Nine Mile Syncline are minimal, there are still observable traces of their effects.
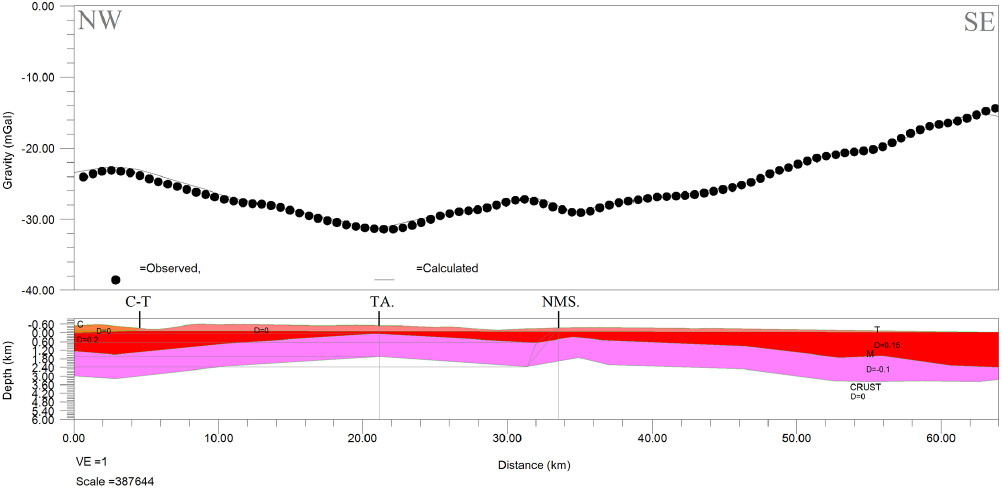
Figure 9 Gravimetric modeling of Transect C: from 683127E, 5262521N to 742184E, 5236818N (NAD 27/UTM zone 19N). In orange color, California Lake Group (C), ΔρC =0.2g/cm3; In red color, Tetagouche Group (T), ΔρT =0.15g/cm3; In pink color, Miramichi Group (M), ΔρM =-0.1g/cm3. Location on the geologic contact profile: California Lake-Tetagouche (C-T) groups. Location on profile of fold axes: Tetagouche Anticline (TA.), Nine Mile Syncline (NMS.). RMS Error=0.387.
Concerning the depth that the groups in this profile reach, it is observed that it does not present great changes and it is around 2.5 km throughout almost all the profile except for the extreme southeast, where it reaches around 3.5 km of depth.
As far as densities are concerned, these results show that the same set of contrasts between densities posed in transect A, explains well the gravimetric response maintaining a simplified model of the subsoil and keeping a relationship with the previous profiles. The Miramichi group was included in the model since, although it does not appear along with the profile, the chrono-stratigraphic sequence and the results of models A and B suggest that this group must be present under the observable structures.
Model D
This model was made following the general direction of the Tetagouche Anticline axis, starts at point 694518E, 5247445N (NAD 27/UTM zone 19N) with an azimuth of 39.07°N and covers approximately 45 km.
When analyzing the model shown in Figure 10 it is observed that the depth of the groups increases gradually from the southwest end to reach an approximate depth of 2 km, which is maintained until kilometer 28. From this point, the depth increases until reaching an average depth of 4 km at the northeast end of the profile.
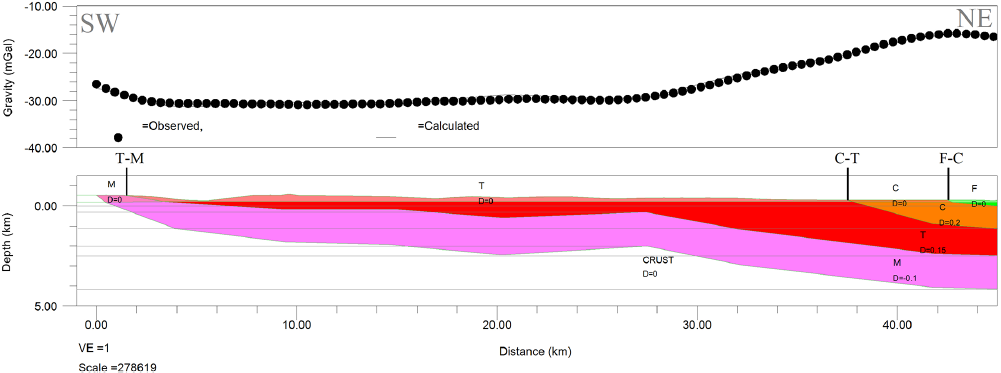
Figure 10 Gravimetric modeling of Transect D: from 694518E, 5247445N to 722956E, 5282476N (NAD 27/UTM zone 19N). In green color, Fournier Group (F), ΔρF = 0.25g/cm3; In orange color, California Lake Group (C), ΔρC =0.2g/cm3; In red color, Tetagouche Group (T), ΔρT =0.15g/cm3; In pink color, Miramichi Group (M), ΔρM =-0.1g/cm3. Location on geologic contact profile: Fourier-California Lake groups (F-C), California Lake-Tetagouche groups (C-T), Tetagouche-Miramichi groups (T-M). Transect parallel to the axis of the Tetagouche Anticline. RMS Error=0.428.
As for the densities, these results show that the same set of contrasts between densities considered in transect A, explains well the gravimetric response maintaining a simplified model of the subsoil.
Model E
This model was made following the general direction of the axis of the Nine Mile Syncline, starts at point 708183 E, 5232417 N (NAD 27/UTM zone 19N) with an azimuth of 24.34° N and covers approximately 60 km.
Analyzing the model shown in Figure 11, it is observed that the average depth of the groups is 2 km from the southwest end to km 18, from which the depth increases considerably to reach about 9 km at km 28 to the center of the profile. Then the depth decreases gradually towards the northeast end until reaching approximately 4km.
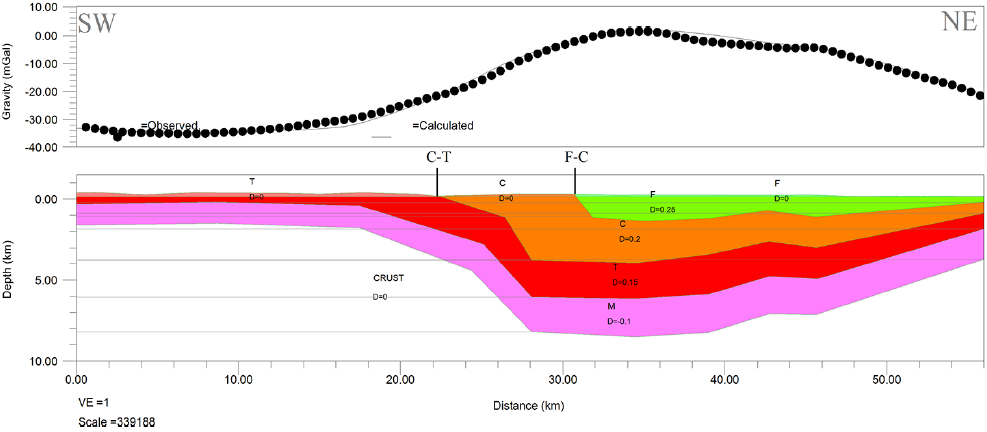
Figure 11 Gravimetric modeling of Transect E: from 708183E, 5232417N to 731390E, 5283743N (NAD 27/UTM zone 19N). In green color, Fournier Group (F), ΔρF = 0.25g/cm3; In orange color, California Lake Group (C), ΔρC = 0.2g/cm3; In red color, Tetagouche Group (T), ΔρT =0.15g/cm3; In pink color, Miramichi Group (M), ΔρM =-0.1g/cm3. Location on the profile of geologic contacts: Fourier-California Lake groups (F-C), California Lake-Tetagouche groups (C-T). Transect parallel to the axis of the Nine Mile Syncline. RMS Error=1.198.
As for the densities, these results show that the same set of contrasts between densities considered in transect A, explains well the gravimetric response maintaining a simplified model of the subsoil. Like the C profile, this profile does not show the Miramichi group, but it was considered in this model for the same reasons as in the model C.
Discussion
The forward gravity models of the upper crustal features of the BMC were obtained by considering a simplified geometry of the subsurface, with constraints provided by the surface location of the contacts between the geological groups of the Bathurst supergroup, the location of the axes of the Nine Mile and Tetagouche main folds, and the depth ranges indicated by the power spectrum analysis.
The density contrast values used in the models presented in this study suggest that the contrasts between the average density of the upper crust and the respective geological groups are of ΔρF≈0.25g/cm3 for the Fourier group, of ΔρC≈0.2g/cm3 for the California Lake group, of ΔρT≈0.15g/cm3 for the Tetagouche group, and of ΔρM≈-0.1g/cm3 for the Miramichi group.
These results agree with Goodfellow's (2007) statement that the Fournier, California Lake, and Tetagouche groups are composed mainly of volcanic rocks while the Miramichi group is composed of sedimentary rocks, from which it can be expected that the Miramichi group is the least dense. In addition, Van Staal (2003) and McCutcheon et al. (2005) indicate that the Fournier group has 460 My-old oceanic crust that is mainly formed by primitive MORB-type basalts and other mafic-composition rocks. This is consistent with the Fournier group being the densest group in the BMC.
With regards to the California Lake and Tetagouche groups, Van Staal (2003) states that the California Lake group is composed of volcanic rock formations with similar proportions between felsic and mafic rocks, while in the Tetagouche group, those of felsic composition predominate. Table 1 shows the density of various rock types; these densities were obtained from a study by the Dalhousie University High-Pressure Laboratory of drill core from the Canoe Landing Lake area within the Bathurst Mining Camp. It can be seen in Table 1 that in general volcanic rocks of mafic composition tend to be denser than those of felsic composition, therefore it is expected that the California Lake group presents a higher average density than the Tetagouche group, which is also consistent with the results of this study.
The coherence of the proposed contrasts between the densities of the different groups can also be checked by determining the value of the density that the model predicts for each group. By assuming that the average crust density is ρmean = 2.77g/cm3 the density of each group can be calculated as: ρgroup = ρmean + Δρgroup. Thus, the density of the groups would be: ρFournier = 3.02g/cm3, ρCaliforniaLake = 2.97g/cm3, ρTetagouche = 2.92g/cm3 and ρMiramichi = 2.67g/cm3. We find that these values of densities are part of an acceptable range for the composition of each group. It should be clarified that the above calculation of densities at no time aims to determine the actual density of structures but to check the consistency between the densities taking as reference an average value of the upper crust.
The above considerations support the validity of the models obtained in this study. Together, these models provide a three-dimensional perspective of the subsurface structure and can be seen in Fig. 12. This figure shows the general geometry of the Tetagouche Anticline and the Nine Mile Syncline, which represent the main geologic structures of the BMC.
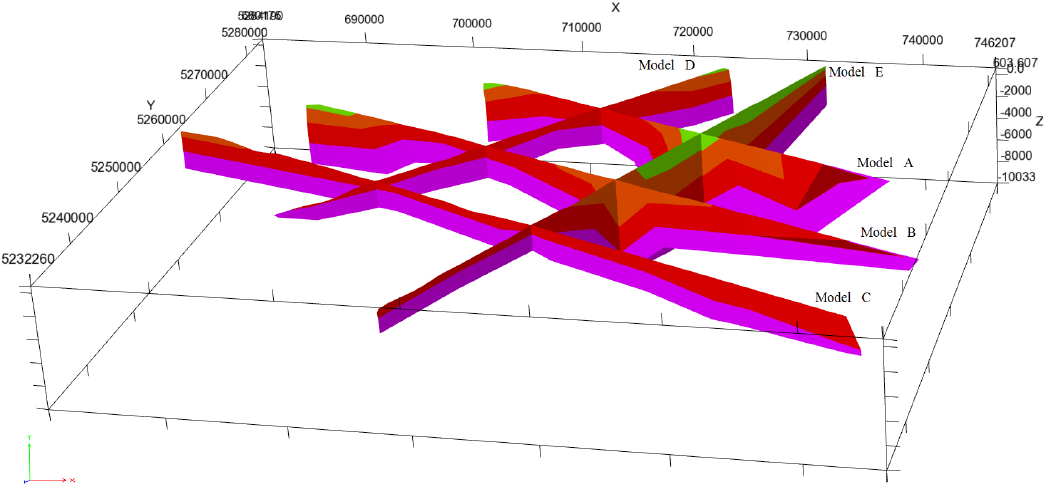
Conclusions
The general objective of this project was the modeling of the upper crust structure of the Bathurst Mining Camp (BMC) to contribute to the geological understanding of this area. This study led to a 3D perspective of the upper-crustal structure of the BMC, obtained from a compilation of 2.5D forward gravity models along five regional profiles.
Based on the geometry of the upper-crustal gravity models of the BMC obtained in this study, it was concluded that the Nine Mile Syncline is an open fold, while the Tetagouche Anticline corresponds to a gentle fold. Both folds are non-cylindrical and inclined, and their axial planes dip in the direction of ≈295° N; the angle of vergence of the folds tends to increase towards the northeast of their axes, as well as the effects of the deformation associated with these structures. The structures modeled under the Tetagouche Anticline axis gradually get deeper towards the Northeast reaching a maximum depth of 4 km. The depth of the structures modeled under the axis of the Nine Mile Syncline varies between 2 and 9 km with the deepest part being located towards the center of the Bathurst Mining Camp; towards the northeast of its axis, the modeled structures reach an intermediate depth of 4 km while towards the southeast they are 2 km deep on average. The deepest part of the whole modeled structure is under the Nine Mile Syncline towards the center of Bathurst Mining Camp.

