


 (pdf)
(pdf)


 SciELO
  SciELO
 Permalink
Introduction
In recent years has been paid to climate change due to pollution produced by human activity what has led to drastic measures on environmental regulations, especially concerning to drinking water which is a resource that is becoming scarcer (Bulgariu et al., 2019; Holkar, Jadhav, Pinjari, Mahamuni, & Pandit, 2019; Kyzas, Bikiaris, & Mitropoulos, 2017; Li, Wang, Guo, Li, & Shuai, 2017). Governments seek a responsible use of water by the industries such as ceramics, clothing, photography, paintings, and others such as food, pharmaceutical, textile, etc. (Pargoletti et al., 2019; Holkar et al., 2019; Pavithra, Kumar, Jaikumar, & Rajan, 2019; Kwak, Hong, Lee, & Jin, 2018). These industries use both synthetic and vegetable dyes for skin processing and prints, etc., however, after the dying process, around 80 % of these dyes lose remain in the dye bath making coloured effluent (Panneerselvam, Arul, Warrier, Asokan, & Dong, 2019), which is discharged into the drain along with wastewater where most cases have no treatment which causes great pollution in lakes and rivers that are the main source of drinking water for the population.
Dyes are toxic compounds and can harm aquatic animals (Bhatia, Sharma, Singh, & Kanwar, 2017; Guo, Li, Liu, & Lv, 2014; Zhang, Wua, & Cha, 2019). Moreover, they can prevent light from being in contact with plants causing photosynthesis and other biochemical processes to be directly affected can lead to the decreased oxygen concentration in water (Bulgariu et al., 2019; Kwak et al., 2018; Guo et al., 2014; Zhou, Lu, Zhou, & Liu, 2019; Wang, Zhou, Jiang, & Sun, 2008). In the case of methylene blue (MB) particles have an aromatic heterocyclic structure and is a cationic dye, it can have serious consequences for human living beings whether contact or intake can cause headache, gastritis, diarrhea among other diseases related to the digestive system (Nayak & Pal, 2017; Altintig, Altundag, Tuzen, & Sari, 2017).
In addition, to having a significant impact on the flora and fauna (Guo et al., 2014). While Methyl Orange (MO) has also an aromatic structure but is an anionic dye, it is usually used in the dyeing of the textile industry but possesses mutagenic properties which can cause serious damage by causing chronic degenerative diseases (Uddin & Baig, 2019; Srilakshmi & Saraf, 2016). Several methods have been proposed for the treatment of textile industry wastewater contaminated with different dyes, among them coagulation, ozonation, use of membranes, electrocoagulation, biological treatments, adsorption with activated carbon and nanomaterials, etc. (Holkar et al., 2019; Pavithra et al., 2019; Cai et al., 2017; Zhou et al., 2019; Meksi & Moussa, 2017; Ma, Zheng, Mo, Dong, & Qiu, 2018; Sivakumar, Murugesan, Loganathan, & Sivakumar, 2014; Cao, Pan, Shi, & Yu, 2018). They are usually very efficient processes but are very expensive and present great difficulty for their implementation in scale industry. To try to reduce the operating costs for the treatment of waste produced by these industries, such as meat and juice processing, the waste generated by these same industries to obtain bioadsorbents has been considered. Encouraging results have been obtained to try to eliminate the greatest amount of dye present in these waste waters (Zhou et al., 2019; Hernández-Maldonado, Torres-García, Salazar-Hernández, & Hernández-Soto, 2017) because it has been shown to have a very low cost and due to its versatility it is a viable option for use in this type of problem.
In the particular case of the use of apatits, which have been shown to have properties for adsorption of metals such as Cu, Cd and Co among others (Panneerselvam et al., 2019; Hernández-Maldonado et al., 2017). Additionally, it has also been used for the removal of dyes such as congo red, blue acid and yellow 4 (Adeogun et al., 2018; Varaprasad et al., 2018; Liu et al., 2019; Abdullah et al., 2019). Good results have been obtained in the adsorption of these dyes and other contaminants with hydroxyapatite (Hernández-Maldonado et al., 2017). Brushite (DCPD) is another apatite that also has a great interest in tissue engineering because it is used for the manufacture of “bone cement” mainly due to its great biocompatibility with bones (Schamel, Barrelet, Groll, & Gbureck, 2017). In addition, DCPD has been used in the hidrocalomite removal presented good efficiency for the adsorption of this mineral. This apatite has also been used to remove Cu(II), F and Pb(II) ions where it has obtained a high adsorption capacity and high removal (˃ 90 %) due to the phosphate groups present on the surface of nDCPD that participate in the process of removing these contaminants (Doan, Dung-Tran, Nzihou, & Sharrock, 2014; Yang et al., 2019; Hernández-Maldonado et al., 2017; El-Hamidi, Mulongo-Masamba, Khachani, Halim, & Arsalane, 2015).
In this work, the removal of MB and MO present in an ideal solution was carried out using Brushite (nDCPD) obtained from beef bone. Several bioadsorption aspects were studied such as kinetic and thermodynamic process under different adsorption conditions (adsorption temperature and amount of bioadsorbent). This, in order to have a better understanding the MB and MO dyes adsorption on this type of materials.
Materials and methods
Chemicals
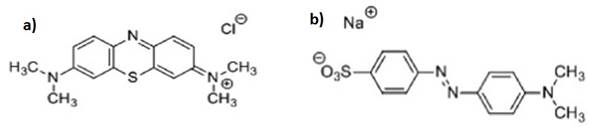
All chemicals used were analytical grade and for the solutions preparation the deionized water was used. The methylene blue (Sigma Aldrich, CAS: 122965-43-9), Figure 1a (MB, λmax = 662 nm) and methyl orange (Sigma Aldrich, CAS: 547-58-0), figure 1b (MO, λmax = 463 nm) dyes were used without any additional purification (Tamimi, Sheikh, & Barralet, 2012; Farroq, Kozinski, Khan, & Athar, 2010; Hernández-Soto, Hernández, Ardila-Arias, Salazar-Hernández, & Salazar-Hernandez, 2019).
Bioadsorbent preparation
Natural Brushite (nCDCP) was obtained from the bovine bone which was washed with hot water and subsequently dried at 80 °C by 24 h. Subsequently, the bones were crushed and sifted to obtain a particle size of 150 mesh (104 μm). The powder was treated with a solution of HCl (Baker, 35 %) and NaOH (Baker, 98 %), both at 10-2 M. It was eventually stored until use (Tamimi et al., 2012; Hernández-Soto et al., 2019).
Natural brushite characterization
Fourier's Transform infrared (FTIR) studies of samples were performed in an IR spectrophotometer (Nicolet iS10 Thermo Scientific), in a range of 4 000 to 400 cm-1 (Hernández-Soto et al., 2019). The Scanning Electron Microscopy (SEM) images were obtained in a JOEL (6510 plus). The textural properties of nDCPD were determined by a BET parser (Micromeritics ASAP, 2020 plus).
Adsorption isotherm studies
Different isotherm models were used to describe the adsorption of MB and MO proceeded as follows: 0.05 g of bioadsorbent was contacted with 50 mL of MO solution varying the concentration between 0 to 50 ppm and for MB the concentration variation was 0 to 40 mg/l, in a shaker (ZHWY-200D) with a stirring of 200 rpm at different temperatures (25, 35 and 45 °C) by 24 h of contact time. The different models and equations of isotherms are present in Table 1.
Table 1 Non-linear adsorption isotherm models (Hernández-Maldonado et al., 2017; Hernández-Soto et al., 2019).
| Isotherm model | Equation |
|---|---|
| Langmuir |
|
| Temkin |
|
| Freundlich |
|
| Dubinin-Radushkevich (DR) |
|
| SIPS |
|
| Redlich-Peterson (RP) |
|
where qe is the adsorption capacity (mg/g); Ce is the dye concentration used (mg/l); qm is the maximum adsorbed capacity (mg/g); KS is the slaving sips model constant related to adsorption energy; β is the dimensional parameter of the SIPS; nRP (0 < n < 1); KR (mg/g (l/mg)), and aR are the constants of the R-P model; KL is the constant of the Langmuir model that is related to the separation factor (RL ); A and B are constant from the Temkin model; KF is the Freundlich constant related to adsorption capacity and 1/n indicates adsorption energy; Temkin: A (l/mg), B (kJ/mol); KDR (mol/J)2 is the speed constant, and Ɛ (J/mol) is the parameter of the DR model (
where KL (l/mg) is the constant of the Langmuir model and C0 is the initial concentration of MB or MO. To understand the thermodynamics of the adsorption process, thermodynamic parameters such as apparent Gibbs free energy were determined using the Equation (2):
Where:
where R the ideal gas constant and T is the absolute temperature (K).
The values of ΔH and ΔS can be determined with the slope and sorted to the origin of the ln (k) graphic as a function of T-1.
Batch removal kinetics
Kinetics removal experiments of the dyes in nDCPD were carried out in a reactor batch to know the development of MO and MB adsorption in the biomaterial. It was carried out by varying the concentration of nDCPD (Cads) from 0 to 20 g/l for 8 h at a speed of 200 rpm at different temperatures. At specific times, aliquots were taken and then were centrifuged (Hermie Labortechnik GmbH) at 6 000 rpm by 10 min at 25 °C. They were analyzed to know the concentration of the different dyes present in the solution by spectrophotometry (JENWAY 6705). The amount of dye removed by nDCPD, q, was obtained using the Equation (5) (Hernández-Maldonado et al., 2017; Pakshiranja, Worku, Acheampong, Lubberding, & Lens, 2013):
where C0 and C is the initial concentration and at time t or in equilibrium (mg/l); V is the volume of solution (l), and m is the mass of nDCPD (g). The removal percentage, %R, was calculated using the Equation (6) (Singh, Hasan, Talat, Singh, & Gangwar, 2009):
Experimental data were adjusted with the adsorption kinetics models described in Table 2.
Table 2 Kinetic models used for the analysis of experimental data for the adsorption of contaminants (Hernández-Soto et al., 2019).
| Kinetic models | Equation |
|---|---|
| Pseudofirst order (PFO) |
|
| Pseudosecond order (PSO) |
|
| Elovich |
|
| Intraparticle diffusion (ID) |
|
| External diffusion (ED) |
|
where qt is the adsorption capacity (mg/g). C0 is the initial concentration of the dye in the liquid (mg/l). qmax, is the maximum adsorbed capacity (mg/g). k1 (h-1) is the speed constant of the PFO model. k2 (g/h mg) is the speed constant of the PSO model. kInt (mg/g h) is the speed constant of the ID model. kExt (h-1) is the speed constant of the model ED. V (L) is the volume of the dye solution and m (g), is the mass of the bioadsorbent.
In addition to using the coefficient of determination to compare the efficiency of the different kinetic and equilibrium models, the standard deviation, Δq, was calculated using the Equation (7) (Wang, Chen, Wang, Feng, & Yan, 2019):
where N is the number of data, qexp and qcal (mg/g) are the experimental and calculated values of the removed dyes, respectively.
Results and discussion
Study in balance
Figure 2 and Figure 3 show the adjustment of the experimental data with the different isotherm models for MO and MB, respectively, at different temperatures.
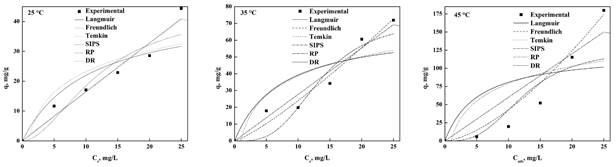
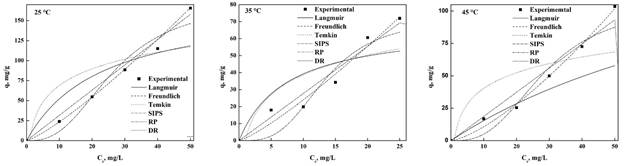
Table 3 shows the MB and MO parameters obtained from the settings of each isotherm type where it can observe that the models of SIPS, Langmuir and Freundlich revealed the better fit but based on the coefficient of determination (R2) and the standard deviation (Δq), the Freundlich model is the most suitable for both dyes. This main that the balance is carried out without limitations of the formation of the monolayer and surface of nDCPD is highly heterogeneous allowing to have different adsorption heats scattered throughout the surface making it more efficient to remove the dyes. This result is consistent with the reported in the literature for different bioadsorbents (Kyzas et al., 2017; Kwak et al., 2018; Guo et al., 2014; Zhang et al., 2019; Uddin & Baig, 2019; Cao et al., 2018; Rahman, Akter, & Abedin, 2013; Do-Nascimiento et al., 2014; Tabrizi & Yavari, 2015; Uyar, Kaygusuz, & Erim, 2016; Li et al., 2016; Zong, Li, Tian, Lin, & Lu, 2018; Mudyawabikwa, Mungondori, Tichagwa, & Katwire, 2017; Cheng et al., 2015; Raval, Shah, & Shah, 2016; Shakoor & Nasar, 2017; Mashkoor & Nasar, 2020b; Bulgariu et al., 2019; Kadhom, Albayati, Alalwan, & Al-Furaiji, 2020), but there are other reports where it is mentioned that the best model are Langmuir and SIPS (Qian, Luo, Wang, Guo, & Li, 2018; Mounia et al., 2018; He et al., 2019; Shakoor & Nasar, 2016; Sun et al., 2019; Ma et al., 2018; Islam, Ahmed, Khanday, Asif, & Hameed, 2017; Yang & Guan, 2018; Lv et al., 2019; Marques-Fraga, Marques-Fraga, Da-Silva, Nascimento-Carvalho, & Da-Motta-Sobrinho, 2018a; Jaseela, Garvasis, & Joseph, 2019; Pai, Srinivas, & Selvaraj, 2021; Kadhom et al., 2020; Uddin & Nasar, 2020; Mashkoor & Nasar, 2020a; Marques-Fraga, Nascimento-Carvalho, Marques-Fraga, Da-Silva, Ferreira, & Da-Motta-Sobrinho, 2018b; Mashkoor & Nasar, 2020a; Nogueira-De-Paiva, Marques, Sales, Carvalho, & Da-Motta-Sobrinho, 2018) and for the case of the use of hydroxyapatite as bioadsorbent for other dyes, the best models that adjust are Langmuir and Freundlich, this was mentioned by Adeogun et al. (2018), Gross et al. (2017) and Pai et al. (2021).
Table 3 Equilibrium parameters for the MB and MO adsorption in nDCPD.
| Models | Parameters | |||||
|---|---|---|---|---|---|---|
| MB | MO | |||||
| 25 °C | 35 °C | 45 °C | 25 °C | 35 °C | 45 °C | |
| Langmuir | ||||||
| KL | 0.0953 | 0.1359 | 0.1902 | 0.0429 | 0.0221 | 0.0091 |
| qm | 45.024 | 68.163 | 116.59 | 168.60 | 150.42 | 185.25 |
| RL | 0.30-0.69 | 0.17-0.60 | 0.17-0.51 | 0.32-0.70 | 0.48-0.82 | 0.69-0.92 |
| R2 | 0.8205 | 0.7110 | 0.4348 | 0.7897 | 0.9962 | 0.6306 |
| Δq, % | 0.6124 | 2.3250 | 15.729 | 0.8088 | 5.5108 | 35.2730 |
| Freundlich | ||||||
| KF | 1.721 | 1.474 | 1.120 | 1.410 | 1.624 | 0.4396 |
| n | 0.9987 | 0.8253 | 0.6533 | 0.8216 | 0.8865 | 0.7158 |
| R2 | 0.9811 | 0.9866 | 0.9987 | 0.9976 | 0.9997 | 0.9964 |
| Δq, % | 0.3867 | 0.5745 | 3.5920 | 0.2180 | 0.0157 | 0.1398 |
| Temkin | ||||||
| A | 5.1*10-19 | 6.3*10-18 | 5.6*10-18 | 1.4*10-16 | 1.2*10-16 | 3.2*10-17 |
| B | 10.094 | 16.795 | 32.428 | 29.079 | 24.782 | 17.506 |
| R2 | 0.8065 | 0.7378 | 0.5137 | 0.6913 | 0.7196 | 0.6411 |
| Δq, % | 12.011 | 10.9948 | 13.560 | 23.508 | 12.346 | 3.618 |
| SIPS | ||||||
| KS | 0.0823 | 0.0746 | 0.0797 | 0.0375 | 0.0403 | 0.0351 |
| qm | 45.060 | 72.060 | 120.55 | 168.36 | 135.01 | 105.03 |
| β | 1.8553 | 3.2761 | 2.9857 | 2.677 | 2.767 | 2.858 |
| R2 | 0.8902 | 0.8984 | 0.7404 | 0.9508 | 0.9664 | 0.9380 |
| Δq, % | 0.6487 | 0.09705 | 14.7444 | 0.7436 | 0.3615 | 0.6305 |
| RP | ||||||
| KR | 10.005 | 29.441 | 0.1241 | 21.399 | 72.071 | 56.553 |
| aR | 18.760 | 9.618 | 6.280 | 5.977 | 26.725 | 29.305 |
| nRP | 0.014 | 5.1*10-17 | 2.6*1017 | 5.7*10-18 | 1.6*10-17 | 3.9*10-17 |
| R2 | 0.9611 | 0.9560 | 0.9100 | 0.9834 | 0.9974 | 0.9611 |
| Δq, % | 207.0 | 413.08 | 43.95 | 244.22 | 1158.7 | 1176.3 |
| DR | ||||||
| qm | 41.971 | 85.242 | 226.13 | 171.13 | 145.71 | 92.41 |
| kDR | 1.7*10-5 | 2.6*10-5 | 4.1*10-5 | 8.2*10-5 | 7.5*10-5 | 6.5*10-5 |
| Ea | 169.74 | 139.93 | 111.80 | 78.326 | 81.675 | 87.666 |
| R2 | 0.8012 | 0.9406 | 0.9500 | 0.9188 | 0.9571 | 0.9061 |
| Δq, % | 2.4618 | 8.2938 | 11.5204 | 1.4912 | 3.9385 | 4.8197 |
In general, both models have been reported as the most suitable for adsorption of dyes and already depends on the criteria used to choose the best. The value of n<1 for all temperatures implies that the adsorption on the surface of the bioadsorbent is a physical and favorable process, this was corroborated by Shakoor and Nasar (2017). The value of RL (Table 3) where at any temperature is less than 1 for MO and MB (Hernández-Maldonado et al., 2017; Shakoor & Nasar, 2017; Nogueira et al., 2018). The adsorption capacity obtained for MB were 44.42, 71.71 and 179.81 mg/g at 25, 35 and 45 °C, respectively, where it can be noted that the higher temperature improves the adsorption of nDCPD, this coincides with the energy by absorbate molecular (E) decreases with the temperature increase, which makes it easier to capture the dye and therefore a removal percentage of 97.1 % at 45 °C was achieved.
Comparing to the results of the literature, the adsorption capacity of nDCPD of this dye is within the range between 1 343-0.89 mg/g, which gives us the guideline that it is a candidate for the removal of MB (Uyar et al., 2016; Li et al., 2016; Zong et al., 2018; Mudyawabikwa et al., 2017; Rahman, Kishimoto, Urabe, & Ikeda, 2017; Islam et al., 2017; Yang & Guan, 2018; Lv et al., 2019; Jaseela et al., 2019; Tara et al., 2020; Zhou et al., 2019). In the case of hydroxyapatite, it has an adsorption capacity between 417 to 34.1 mg/g between 25 and 40 °C (Pai et al., 2021), although it has a higher adsorption than nDCPD, it can be mentioned that the results obtained with nCDPD is within the values reported for hydroapatite, so we can mention that nDCPD is a candidate to remove MB from residues.
MO the adsorption capacity at 25, 35 and 45 °C obtained were 165.6, 133.92 and 62.44 mg/g, respectively, where it can be inferred that the temperature has an adverse effect on the adsorption capacity of nDCPD, also, it is consistent with the result of the energy needed to remove an absorbent (Table 3) which increases with the increase in temperature and achieving a 99.4 % removal capacity at 25 °C. The values adsorption capacity that have been reported range from 392 mg/g to 46.08 mg/g (Raval et al., 2016; Sun et al., 2019; Ma et al., 2018; Rahman et al., 2017; Islam et al., 2017; Yang & Guan, 2018; Zhou et al., 2019). A special case is the activated carbon obtained by calcination of grapefruit peel, it has an adsorption capacity of 680 mg/g (Kadhom et al., 2020). In the case of adsorption of dyes using Hydroxyapatite range from 135.1 to 21.1 mg/g (Pai et al., 2021). This shows that nDCPD can also be considered for the elimination of MO in the waters of industrial processes that use these dyes because it has a higher adsorption capacity than hydroxyapatite and compared to other adsorbents it has a very similar removal percentage (˃ 90) (Zhou et al., 2019; Kadhom et al., 2020).
Thermodynamic study
Thermodynamic analysis of the bioadsorption process is carried out from the obtaining of the adsorption isotherms (Table 4). For the case of MB there is a spontaneous process (ΔG < 0) and endothermic process since the adsorption capacity increases directly with the increase in temperature, this was also obtained in several works using different bioadsorbents even with hydroxyapatite (Zhang et al., 2019; Adeogun et al., 2018; Shakoor & Nasar, 2018; Mashkoor & Nasar, 2020b; Shakoor & Nasar, 2016; Raval et al., 2016; He et al., 2019). In addition, it has been mentioned that if the value of ΔH < 40 kJ/mol the adsorption is considered to be a physical process (Bulgariu et al., 2019).
Table 4 Thermodynamic parameters for MB and MO adsorption in nDCPD.
| T, °C | -ΔG, kJ/mol | ΔH, kJ/mol | ΔS, kJ/mol K | R2 |
|---|---|---|---|---|
| MB | ||||
| 25 | 19.71 | 27.25 | 0.158 | 0.9989 |
| 35 | 21.28 | |||
| 45 | 22.86 | |||
| MO | ||||
| 25 | 17.89 | -61.03 | 0.144 | 0.9896 |
| 35 | 16.79 | |||
| 45 | 14.98 | |||
Although in some others it is mentioned that the process is exothermic (Guo et al., 2014; Cao et al., 2018), this could indicate that the nature of the process may depend on the surface where the removal of the dyes. In the case of MO the process is also spontaneous, however the process is exothermic (ΔH < 0) implying that the adsorption capacity decreases with the increase in temperature, this was found in other studies (Uddin & Baig, 2019; Raval et al., 2016; Qian et al., 2018; Bulgariu et al., 2019) that used activated carbon, furthermore the negative nature of the process allows forces with less intensity (compared to the latent heat of water vaporization) to be involved in the adsorption of dyes (Pessôa et al., 2019), although in some others the process that was found was endothermic (Islam et al., 2017; Yang & Guan, 2018).
Considering this it can be said that the particle size can infer in the environment of the removal process. For both dyes, there is an irreversible process (ΔS > 0), although it is worth mentioning that the value of this thermodynamic property is very small that it can be inferred that the dyes can have a desorption percentage, in addition to indicating that the affinity between MB, MO and nDCPD increases with the degree of freedom between the solid/liquid interface (Qian et al., 2018; Islam et al., 2017; Mashkoor & Nasar, 2020a; Shakoor & Nasar, 2018; Mashkoor & Nasar, 2020b). Therefore, it confirms what was found in the study in balance, in addition to mentioning that the process is feasible.
MB and MO bioadsorption kinetics
Table 5 and Table 6 show the evolution of MB and MO adsorption in nDCPD concerning temperature along with the settings of the different kinetic models. It can be observed that PFO, PSO, and Elovich were the best models suit to the experimental data.
Table 5 Kinetic parameters of MB removal process in nDCPD.
| Model | 4 g/l | 8 g/l | 12 g/l | 16 g/l | 20 g/l | ||||||||||
|---|---|---|---|---|---|---|---|---|---|---|---|---|---|---|---|
| 25 °C | 35 °C | 45 °C | 25 °C | 35 °C | 45 °C | 25 °C | 35 °C | 45 °C | 25 °C | 35 °C | 45 °C | 25 °C | 35 °C | 45 °C | |
| PFO | |||||||||||||||
| qmax | 119.97 | 167.15 | 209.02 | 89.184 | 136.08 | 166.82 | 68.821 | 89.853 | 115.34 | 65.94 | 79.73 | 101.90 | 56.97 | 76.39 | 92.72 |
| k1 | 0.5578 | 0.4198 | 0.2858 | 0.7758 | 0.3558 | 0.3150 | 0.5907 | 0.4922 | 0.5015 | 0.4960 | 0.3569 | 0.5187 | 0.5971 | 0.5042 | 0.7916 |
| R2 | 0.9851 | 0.9642 | 0.9178 | 0.9669 | 0.9801 | 0.9404 | 0.9629 | 0.9045 | 0.9575 | 0.9843 | 0.9295 | 0.9586 | 0.9466 | 0.9632 | 0.9875 |
| Δq, % | 1.7320 | 2.9393 | 3.3134 | 0.0362 | 1.8376 | 4.1870 | 4.4644 | 6.6468 | 4.2807 | 1.3204 | 3.3345 | 4.0245 | 4.6904 | 4.1959 | 5.6878 |
| PSO | |||||||||||||||
| qmax | 124.36 | 185.02 | 198.44 | 89.31 | 145.27 | 150.70 | 77.758 | 103.35 | 130.83 | 67.71 | 89.90 | 115.29 | 64.20 | 86.74 | 103.95 |
| k2 | 0.0061 | 0.0034 | 0.00294 | 0.0130 | 0.0031 | 0.0022 | 0.0108 | 0.0063 | 0.0054 | 0.0092 | 0.0056 | 0.0064 | 0.0134 | 0.0081 | 0.0109 |
| R2 | 0.9863 | 0.9904 | 0.9626 | 0.9948 | 0.9938 | 0.9661 | 0.9914 | 0.9917 | 0.9993 | 0.9925 | 0.9820 | 0.9900 | 0.9935 | 0.9950 | 0.9957 |
| Δq, % | 0.3015 | 1.1115 | 1.0784 | 0.0248 | 0.7945 | 0.1626 | 0.7567 | 0.9261 | 1.1490 | 0.1569 | 1.9442 | .3218 | 0.3912 | 1.2938 | 0.9593 |
| Elovich | |||||||||||||||
| α | 941.35 | 482.60 | 164.77 | 908.4 | 245.71 | 186.99 | 510.98 | 326.79 | 520.44 | 277.10 | 75.68 | 523.76 | 462.73 | 341.80 | 1762.5 |
| β | 0.0531 | 0.0319 | 0.0187 | 0.0920 | 0.0360 | 0.0284 | 0.0899 | 0.0601 | 0.0496 | 0.0861 | 0.0649 | 0.0574 | 0.1103 | 0.0746 | 0.0763 |
| R2 | 0.9647 | 0.9902 | 0.8741 | 0.9910 | 0.9847 | 0.9037 | 0.9895 | 0.9622 | 0.9886 | 0.9519 | 0.9676 | 0.9812 | 0.9833 | 0.9924 | 0.9476 |
| Δq, % | 3.2913 | 7.9766 | 6.2775 | 5.13354 | 8.0788 | 7.6590 | 6.7025 | 7.9793 | 7.6964 | 4.5013 | 9.6970 | 7.3993 | 6.5364 | 7.6801 | 5.2249 |
| DI | |||||||||||||||
| kid | 36.397 | 48.752 | 54.373 | 25.544 | 38.186 | 42.213 | 21.277 | 27.349 | 34.823 | 19.61 | 25.53 | 30.91 | 17.68 | 23.07 | 29.73 |
| R2 | 0.4213 | 0.6176 | 0.6457 | 0.3753 | 0.6750 | 0.6314 | 0.4907 | 0.6461 | 0.5622 | 0.4753 | 0.6841 | 0.5411 | 0.4954 | 0.5604 | 0.4156 |
| Δq, % | 7.3114 | 11.366 | 10.192 | 8.8524 | 11.436 | 11.274 | 10.239 | 11.220 | 11.066 | 8.4446 | 9.0747 | 10.850 | 10.035 | 11.088 | 8.8487 |
| DE | |||||||||||||||
| kext | 22.16 | 26.57 | 20.01 | 37.39 | 31.4015 | 20.10 | 40.52 | 48.88 | 63.0261 | 38.92 | 49.39 | 76.09 | 60.07 | 68.53 | 108.01 |
| R2 | 0.0 | 0.0 | 0.0 | 0.0 | 0.0 | 0.0 | 0.0 | 0.0 | 0.0 | 0.0 | 0.0 | 0.0 | 0.0 | 0.0 | 0.0006 |
| Δq, % | 66.181 | 122.23 | 134.05 | 116.59 | 215.22 | 240.65 | 164.73 | 232.15 | 305.06 | 197.86 | 278.08 | 365.58 | 242.063 | 341.38 | 417.21 |
Table 6 Kinetic parameters of MO adsorption in nDCPD.
| Model | 4 g/l | 8 g/l | 12 g/l | 16 g/l | 20 g/l | ||||||||||
|---|---|---|---|---|---|---|---|---|---|---|---|---|---|---|---|
| 25 °C | 35 °C | 45 °C | 25 °C | 35 °C | 45 °C | 25 °C | 35 °C | 45 °C | 25 °C | 35 °C | 45 °C | 25 °C | 35 °C | 45 °C | |
| PFO | |||||||||||||||
| qmax | 148.02 | 106.11 | 49.125 | 66.014 | 95.663 | 26.633 | 39.437 | 65.021 | 32.189 | 34.057 | 68.224 | 26.526 | 60.125 | 56.192 | 33.281 |
| k1 | 0.0782 | 1.2719 | 0.4265 | 0.2493 | 0.4534 | 0.48687 | 0.2498 | 1.0822 | 2.4494 | 0.6131 | 0.7408 | 0.6650 | 0.1460 | 0.7956 | 0.9706 |
| R2 | 0.9861 | 0.99470 | 0.8551 | 0.9614 | 0.9755 | 0.7837 | 0.9825 | 0.9930 | 0.9511 | 0.9535 | 0.9347 | 0.8611 | 0.9442 | 0.9595 | 0.9485 |
| Δq, % | 6.0967 | 0.3290 | 2.3190 | 1.4656 | 0.1789 | 2.7065 | 1.8206 | 1.0943 | 2.3451 | 0.2208 | 2.1354 | 0.7116 | 0.2680 | 1.5822 | 5.4550 |
| PSO | |||||||||||||||
| qmax | 219.63 | 102.47 | 55.497 | 79.391 | 86.046 | 29.717 | 44.401 | 61.502 | 31.014 | 34.935 | 66.506 | 24.834 | 76.247 | 50.385 | 30.782 |
| k2 | 0.0003 | 0.0279 | 0.0101 | 0.0034 | 0.0068 | 0.0225 | 0.0074 | 0.0269 | 0.2029 | 0.0292 | 0.0123 | 0.0375 | 0.0019 | 0.0202 | 0.0337 |
| R2 | 0.9856 | 0.9825 | 0.7928 | 0.9292 | 0.9489 | 0.7180 | 0.9601 | 0.9430 | 0.9457 | 0.9309 | 0.7998 | 0.8364 | 0.9328 | 0.9327 | 0.8374 |
| Δq, % | 25.172 | 1.4607 | 6.9427 | 8.5155 | 3.5152 | 6.8754 | 2.1513 | 2.8416 | 3.4702 | 0.2680 | 1.5822 | 1.4478 | 9.2789 | 2.0289 | 2.2360 |
| Elovich | |||||||||||||||
| α | 0.025 | 0.0459 | 0.1014 | 0.0556 | 0.0665 | 0.2118 | 0.1183 | 0.0777 | 0.1849 | 0.2273 | 0.1006 | 0.311 | 0.0650 | 0.1481 | 0.2282 |
| β | 32.735 | 250.67 | 100.19 | 41.377 | 335.66 | 94.483 | 42.161 | 158.02 | 205.60 | 530.69 | 347.69 | 434.94 | 27.86 | 622.65 | 475.18 |
| R2 | 0.9453 | 0.8189 | 0.7203 | 0.9013 | 0.9369 | 0.6430 | 0.9125 | 0.9055 | 0.8579 | 0.9298 | 0.8776 | 0.8046 | 0.9347 | 0.9134 | 0.9008 |
| Δq, % | 40.806 | 40.821 | 40.816 | 40.793 | 40.811 | 40.798 | 40.813 | 40.816 | 40.817 | 40.345 | 40.573 | 43.097 | 49.052 | 55.123 | 49.901 |
| ID | |||||||||||||||
| kid | 24.84 | 29.81 | 13.18 | 16.46 | 23.93 | 7.23 | 9.73 | 17.95 | 9.26 | 9.145 | 17.173 | 6.945 | 13.191 | 13.541 | 9.015 |
| R2 | 0.9624 | 0.0073 | 0.3770 | 0.7538 | 0.6631 | 0.2634 | 0.8592 | 0.2638 | 0.0121 | 0.4315 | 0.6285 | 0.2826 | 0.9329 | 0.5016 | 0.5034 |
| Δq, % | 17.948 | 22.811 | 33.399 | 20.219 | 22.408 | 35.763 | 21.388 | 32.912 | 25.724 | 25.7245 | 19.474 | 34.090 | 17.856 | 23.372 | 31.134 |
| ED | |||||||||||||||
| kext | 111.77 | 30.117 | 3.86 | 205.58 | 30.863 | 3.182 | 251.375 | 48.944 | 31.249 | 29.766 | 46.958 | 107.26 | 197.38 | 51.259 | 36.386 |
| R2 | 0.0 | 0.0 | 0.0 | 0.0 | 0.0 | 0.0 | 0.0443 | 0.0 | 0.0 | 0.0 | 0.0 | 0.0 | 0.0 | 0.0 | 0.0 |
| Δq, % | 66.161 | 142.28 | 134.03 | 116.59 | 116.59 | 215.22 | 240.65 | 164.73 | 232.15 | 191.85 | 276.08 | 365.58 | 242.063 | 341.38 | 417.22 |
To choose the best fit, the R2 and Δq criteria (Table 5) were used, obtaining for the MB case the best model that fits is PSO, indicating that the adsorption of the dye on the surface of nDCPD needs two active sites, according to the published in various jobs this is the best model for the adsorption of MB with different adsorbents (Kwak et al., 2018; Zhang et al., 2019; Uddin & Baig, 2019; Varaprasad et al., 2018; Liu et al., 2019; Zong et al., 2018; Mudyawabikwa et al., 2017; Jaseela et al., 2019; Uddin & Nasar, 2020; Mashkoor & Nasar, 2020a; Pessôa et al., 2019; Bulgariu et al., 2019), while for MO (Table 6) the most appropriate fit is the PFO model involves that only need an one active site to capture the dye, in this case, has been mentioned that the best model for this dye is PFO model (Mounia et al., 2018; Yang & Guan, 2018; Lima et al., 2015), it means that the structure of the material which contains a Ca/P ratio greater than 1 significantly influences the adsorption.
Although there are investigations where mention that the adsorption kinetics of MO is PSO is equal as MB (Mashkoor & Nasar, 2020b; Bulgariu et al., 2019; Kadhom et al., 2020), which indicates that nCDPD only needs one site to carry out the adsorption of the dye compared to other adsorbents that need two sites to carry out this process. It can also be mentioned that adsorption has no limitations by mass transfer since both intraparticle and external diffusion models are the least suitable for simulating experimental data. In the case of MB, it has an adsorption capacity of 193.33 mg/g to 45 °C, with this value can be inferred that nDCPD has a suitable adsorption capacity, since the reported values are between 434.7 to 23.3 mg/g (Guo et al., 2014; Do-Nascimiento et al., 2014; Tabrizi & Yavari, 2015; Uyar et al., 2016; Li et al., 2016; Zong et al., 2018; Mudyawabikwa et al., 2017; Mounia et al., 2018; He et al., 2019; Shakoor & Nasar, 2016; Sun et al., 2019; Jaseela et al., 2019) while for MO have 125.14 mg/g of adsorption capacity at 25 °C, which also means that can be an appropriate candidate to remove this dye because in the literature the values mentioned are 321-8.474 mg/g (Uddin & Baig, 2019; Mounia et al., 2018; Ma et al., 2018; Islam et al., 2017; Shakoor & Nasar, 2018; Mashkoor & Nasar, 2020b; Kadhom et al., 2020).
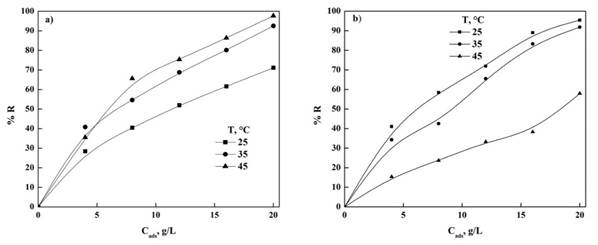
In the case of the use of Hydroxyapatite have been reported to remove other dyes showing an adsorption capacity from 362.3 to 11.88 mg/g being that nDCPD is within this range, it has been thought to continue studying its capabilities to remove other dyes in addition to MO and MB (Panneerselvam et al., 2019; Cao et al., 2018; Guan, Cao, Wang, Marchetti, & Tu, 2018; Lemlikchi et al., 2015; Pai et al., 2021). Figure 4 shows the effect on adsorption capacity for both dyes, being that by increasing the concentration of the bioadsorbent increases the removal percentage this might be because there are more active sites which can capture more molecules of the dyes on the surface, this is consistent with what was reported in the literature for certain intervals of Cads (Pargoletti et al., 2019; Zhang et al., 2019; Liu et al., 2019; Tabrizi & Yavari, 2015; Uyar et al., 2016; Lv et al., 2019).
MB and MO are cationic and anionic dyes, respectively, it has been reported that the zero load potential (PZC) of nDCPD is 6.3 (Hernández-Maldonado et al., 2017), implying that at pH less than this value, the surface is positively charged, which makes MO adsorption (pH of 5.91) easier at lower temperature and for MB (pH of 4.52) energy has to be added for the adsorption to be carried out given its nature in solution and also as indicated by other authors (Srilakshmi & Saraf, 2016; Hernández-Maldonado et al., 2017) instead of using electrostatic attraction in surface and dye is done by an ion exchange. Based on these results nDCPD extracted from bovine bone represents an option to assist industries and the environment in water care used in the manufacturing processes of various products.
Characterization of nDCPD
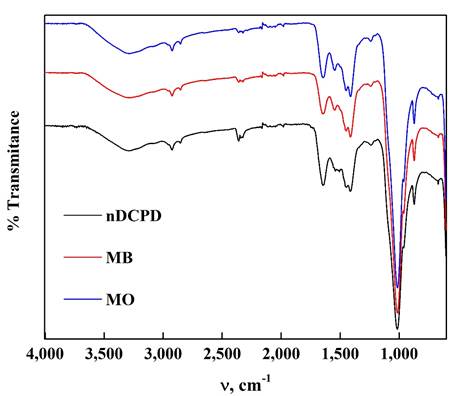
Figure 5 shows the nDCPD FTIR spectra and the samples used to adsorb Mb and MO. In the samples there is the band at 3 292 cm-1 that can be assigned to the O-H stretch of the water molecule found in the nDCPD structure (Cao et al., 2018; Hernández-Soto et al., 2019). The peaks at 2 923 and 1 210 cm-1 represent the PO-H stretch of the HPO4 2- group and the bending in the O-H plane (Hernández-Maldonado et al., 2017; Pakshiranja et al., 2013; Arifuzzaman & Rohani, 2004; Sopcak et al., 2016). The peaks at 1 100, 1 078 (shoulder), 960 (shoulder) and 871 cm-1 are assigned to the presence of the P-O and P-O (H) stretch present in the HPO4 2- group together with double to 575 and 530 cm-1 which can be assigned to the bending vibrations of O-P-O of the nDCPD phosphate group (Hernández-Soto et al., 2019; Sopcak et al., 2016). The vibrations of the physically linked water were found at 1 647 and 668 cm-1, in addition to finding at 1 418 and 880 cm-1 bands related to the carbonate groups of the apatite present in the sample. The vibrational stretch of the PO4 3- group was observed at 598 cm-1 (Hernández-Soto et al., 2019; Islam et al., 2017; Sopcak et al., 2016). All groups participate in the adsorption of dyes on the surface because their intensities are significantly affected by the presence of MB and MO. It should be noted that the intensity of the nDCPD MO spectrum decreases compared to the nDCPD spectrum, which may indicate that there is greater participation of each of the groups in catching MO on its surface which confirms that there is a greater affinity for adsorbing the anionic dye on the cationic.
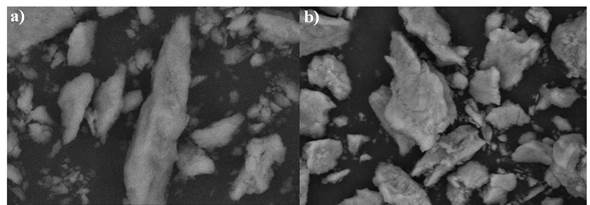
SEM micrographs of nDCPD are seen in Figure 6a, well-defined monoclinic plate morphology, characteristic of Brushite (Yang et al., 2019). Figure 6b reveals small weights of this apatite, possibly due to the fact that the small grains that form around the nDCPD plate have broken due to the adsorption of the dyes (Mirković et al., 2016).
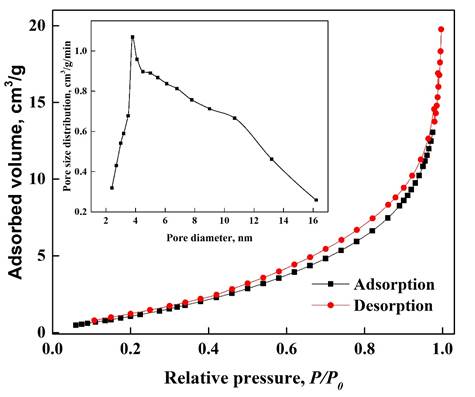
The nDCPD adsorption-desorption isotherm shown in Figure 7 evidences that the sample has a type IV isotherm, which is related to a structured porous structure (Mashkoor & Nasar, 2020a; Sing, 1985; Zhou et al., 2014; Türk et al., 2018), with a surface area of 1.16 m2/g. In the box in Figure 7, look at the pore size distribution ranging from 2 to 16 nm (average diameter equal to 6.05 nm) allowing it to be a mesoporous structure (pore size 2-50 nm). In the works reported by Pessôa et al. (2019), and Mashkoor and Nasar (2020a), where also adsorb dyes, the materials used has pore diameter between 1.98 to 2.6 nm and have low areas compared to other adsorbents such as activated carbon among others (Marques-Fraga et al., 2018b) in such a way that these characteristics are similar to those obtained in our material, we can infer that not only the dyes are adsorbed on the surface of the material, it can also enter the nCDPD pore so that they are adsorbed inside.
Conclusions
The results obtained in this work show that nDCPD from the bovine bone has a great capacity to absorb MB and MO dyes, since a removal percentage of 97.1 and 99.4 % was obtained, respectively. Adsorption kinetics revealed that external and intraparticle mass transfer does not limit the adsorption phenomenon and that depending on the dye one or two active sites must be used to carry out this process. It was also found that the process is spontaneous, irreversible, but for MB it is endothermic and for MO is exothermic, indicating that the adsorption process depends heavily on temperature and this causes the energy needed to remove the dye to increase or decrease depending on the nature of the dye. In this case, nDCPD absorbs more quantity and more easily (less energy) to anionic dyes, since at room temperature the maximum adsorption capacity of MO is obtained, otherwise for MB that is a cationic dye more energy is needed to remove it from the solution, in addition to considering the nature of the surface of the bioadsorbent that uses electrostatic interaction to eliminate MO, while for MB the ion exchange is used preferably to remove it from the medium.
The model that best suits the data obtained regardless of the dye in the balance was Freundlich's, allowing to mention the bioadsorption is carried out on a heterogeneous surface allowing each site to have its adsorption energy. The textural properties of nDCPD indicate that they are suitable for the adsorption of both dyes to be carried out, since they can detect this process on the surface and inside the adsorbent. In nDCPD micrographs was observed the classical monoclinic plaque structure in the material. FTIR results allow us to determine that several groups are involved in the removal of dyes. Based on these results we can say that nDCPD is a good candidate to clean process waters from industries that use dyes because their costs are very accessible, easy to obtain and that they have a high efficiency where have to take the significant effects of temperature and concentration of bioadsorbent.

