


 nova página do texto(beta)
 Inglês (pdf)
 Artigo em XML
 Referências do artigo
 Enviar este artigo por email
 Citado por SciELO
  Similares em
SciELO
Similares em
SciELO 
 Permalink
Background
Early childhood development (ECD) is a crucial stage in the first 6 years of human life and represents a critical period marked by the fastest rate of growth for all brain structures. This stage lays the foundation for optimal health, basic learning, and school success, as well as social and economic participation throughout life1. The period between 2 and 5 years of age presents an opportunity to implement educational interventions, promote positive parenting styles, and enrich childcare environments to foster ECD. However, it is estimated that only 38.8% of children aged 3-4 years in low- and middle-income countries have access to early childhood education services2.
A fundamental and effective strategy to promote proper development during early stages is to increase the participation of all children in early childhood education programs. The benefits of these programs have been widely documented, supporting policy recommendations for the implementation of early childhood education and childcare assistance initiatives3,4. Studies conducted with preschool children have established a positive influence of high-quality preschool childcare on skill development across most developmental domains. Furthermore, longitudinal effects have been demonstrated, showing improvements in receptive language and math skills, cognitive abilities, attention levels, behavioral problems, and sociability. All of the above suggests that children with higher-quality preschool experiences can achieve greater developmental progress over a 5-year period5,6.
In addition, it has been reported that early inclusion in early childhood education programs can promote, protect, and support children's development, particularly during the first 2-3 years of life. These results indicate that the long-term effects of the early childhood experience depend, in part, on classroom experiences during at least the first few years of school7.
According to the United Nations Children's Fund, the economic case for establishing childcare centers is based on the premise that social policy has an economic impact. Good nutrition and education provided at an early age through comprehensive programs foster the development of optimal physical and intellectual capacities, which form the productive reserve of future society8. Likewise, there is strong evidence that the consistently positive economic returns of high-quality preschool programs surpass those of most other educational interventions, particularly those starting during school-age years, such as smaller class sizes in primary grades, grade retention, and youth job training5.
In Mexico, in the absence of services for the care of infants and the inability of the potential population to pay for them, in 2006, the Childcare Program was established, as well as an Early Education Program (PEI, in its Spanish acronym) created by the National Secretary of Social Development (SEDESOL) together with the National System for Family Integral Development (DIF) that serves children between 1 and 3 years and 11 months old, or until the age of 6 years for children with disabilities9. This program supports parents and guardians in poverty who are working, studying, or seeking employment and who state that they do not have access to childcare services from public security institutions or private resources10. As of December 31, 2016, the program provided care to 321,330 children, only 37.84% of the target population11. In contrast, although preschool education has been compulsory in Mexico since 200212, according to data from the Organization for Economic Co-operation and Development, the preschool enrollment rate for 2017 in Mexico was only 46%13.
Therefore, between 2014 and 2015, a pilot study was conducted in two states of the country to evaluate the association between the length of time spent in PEI and the developmental level of children under 5 years of age. The study showed an increased probability of achieving normal development in children who stayed in PEI for more than 6 months, compared to those who had been in the program for only 1 month, regardless of age14. As a follow-up to these initial observations and with the purpose of generating additional evidence on the effect of this educational strategy, the objective of this study was to evaluate, on a national scale, the level of development of children enrolled in a Federal Early Education Program (PEI) from Mexico, according to the length of stay in the childcare centers and by geographic area.
Methods
A cross-sectional, population-based, comparative study was conducted in the 9,200 DIF/SEDESOL child care centers located across the 32 states of the Mexican Republic. Children aged 1 to 3 years who were enrolled in the children's facilities within the November 2017 to January 2018 period were included. For each participant, the variables sex, age, length of time at child care centers, and state were recorded. The development areas were assessed using the Child Development (CDE) test or "Prueba Evaluación del Desarrollo Infantil" or "Prueba EDI" in Spanish15, a screening tool developed and validated in Mexico, for the timely detection of child development problems in children from 1 month of life to 1 day before their sixth birthday with the result expressed using the traffic light (green, yellow, or red) system16.
The CDE test was administered by the personnel responsible for each daycare center included in the study. They followed a standardized protocol after completing adequate training. The application of the tests was supervised to ensure the quality and standardization of the information. The supervisors collected the completed test results forms and downloaded the data electronically, and then it was centralized and structured in the final database.
Description of the instrument
The CDE test is made up of 26-35 items, divided into five areas: (a) biological risk factors, (b) warning signs, (c) alarm signals, (d) neurological examination, and e) developmental areas (fine motor, gross motor, language, social, and cognitive). The possible outcomes are normal development (green), developmental delay (yellow), and risk of developmental delay (red). The CDE test has adequate sensitivity and specificity to identify the level of development, both globally and by domain17,18. The sensibility and specificity for only the developmental areas axis of the CDE test compared with a diagnostic evaluation are high19 and have been used before as a measurement for development14. In this study, the developmental assessment was using the developmental axis globally and by area.
Statistical analysis
The sample was characterized per month interval for each state, by age, sex, and length of stay in absolute frequencies and percentages. The dependent variable, the CDE test score, was recorded on an ordinal scale (green, normal; yellow, developmental delay; and red, risk of delay); however, for the purposes of this study, children were categorized under normal development (green) and abnormal development (yellow and red), both in the global assessment and for each developmental area. The c2 test was used to determine the differences between the states in terms of the overall CDE score and according to each area of development; a comparison was made, taking into account the length of stay in the program, divided into five categories: < 6 months, 6-11 months, 12-17 months, 18-23 months, and ≥ 24 months. Statistical significance was determined using a two-tailed test and set at p < 0.05.
In addition, the odds ratio (OR) was calculated as the probability of obtaining a normal (green) result depending on the length of stay in the PEI, together with their 95% confidence intervals (95% CIs). A multivariate analysis was performed to identify the overall effect of the length of stay in the PEI (reference category: < 6 months in the program) and the normal result in global development, using a logistic regression model, with the CDE test result as the dependent variable, while sex, age group, state, and time spent in the program were considered independent variables. All analyses were performed using the IBM SPSS version 27.0 package.
ETHICAL ASPECTS
Since 2013, the CDE test since 2013 has been established as the official screening tool in Mexico for child development evaluation and is used across the country in the health sector20,21. Before taking the different measurements, parents were asked for their verbal consent. The notification was provided 1 week before the measurements were taken through posters and banners that communicated that the children's development would be evaluated in every daycare center. Each family member was informed of the results obtained in the developmental assessment and was also guided to establish an action plan where areas of opportunity were identified to improve the children's development. For that purpose, a material was provided that resumed the results of the CDE test narratively and actions that could be realized by the teacher, also with the perception of the family and guidelines for activities at home were delivered to each participant's family. If the child got a red result (high risk of developmental delay) was referred for further evaluation at a primary health-care facility following the national guidelines for CDE21. The nominal information was only used by the daycare centers routinely, and no personal data were collected in the database; all the information was anonymized when captured. The study was approved for the ethics committee with the register HIM/2013/063.
Results
A total of 231,058 children aged 13-48 months were included and enrolled in 9,200 childcare centers. As shown in table 1, all 32 Mexican states participated but with different proportions, the lowest being Baja California Sur (0.5%) and the highest being the State of Mexico (12.3%); this is in correspondence with the population inhabiting each state. As can also be observed, of the total number of children evaluated, 53% (n = 122,461) were male, while in terms of age distribution, the 13-24 month group had the lowest proportion (15%; n = 34,659), followed by the 25-36 month group (40%; n = 92,423) and the 37-48 month group (45%; n = 103,976).
Table 1 Characteristics of the population that participated in the early childcare program (PEI by its acronym in Spanish), by state (in alphabetical order)
| State | % | n | Sex | Age (years) | Length of stay in PEI (months) | |||||||
|---|---|---|---|---|---|---|---|---|---|---|---|---|
| Male | 1 | 2 | 3 | < 1 | 1-5 | 6-11 | 12-17 | 18-23 | ≥ 24 | |||
| Aguascalientes | 2.1 | 4883 | 53.0 | 17.8 | 40.1 | 42.1 | 21.9 | 10.2 | 21.9 | 25.3 | 8.4 | 12.4 |
| Baja California | 0.5 | 1207 | 52.8 | 17.1 | 37.9 | 45.1 | 14.8 | 13.6 | 24.6 | 25.0 | 8.7 | 13.3 |
| Baja California Sur | 0.5 | 1060 | 54.6 | 14.9 | 43.4 | 41.7 | 20.0 | 9.3 | 29.0 | 24.7 | 10.0 | 7.0 |
| Campeche | 1.3 | 3035 | 51.7 | 17.1 | 44.6 | 38.3 | 24.2 | 20.3 | 19.8 | 24.1 | 4.2 | 7.3 |
| Chiapas | 5 | 11572 | 54.3 | 20.1 | 44.1 | 35.7 | 19.3 | 14.0 | 23.6 | 27.9 | 6.9 | 8.3 |
| Chihuahua | 2.5 | 5676 | 51.3 | 18.6 | 39.7 | 41.7 | 20.6 | 10.7 | 25.0 | 23.4 | 9.6 | 10.8 |
| Mexico City | 4.7 | 10861 | 52.2 | 14.9 | 39.2 | 45.9 | 20.9 | 8.7 | 21.7 | 28.9 | 6.1 | 13.7 |
| Coahuila | 2.8 | 6380 | 53.4 | 22.6 | 40.8 | 36.6 | 25.1 | 13.8 | 22.6 | 23.2 | 5.7 | 9.7 |
| Colima | 1.4 | 3321 | 52.2 | 16.1 | 41.9 | 42.0 | 26.9 | 14.6 | 20.9 | 22.5 | 7.5 | 7.6 |
| Durango | 2.4 | 5616 | 54.2 | 19.4 | 40.4 | 40.3 | 26.7 | 9.2 | 19.6 | 23.4 | 10.5 | 10.7 |
| Guanajuato | 4.8 | 11028 | 53.3 | 13.4 | 41.3 | 45.3 | 16.5 | 7.1 | 25.5 | 30.6 | 7.7 | 12.7 |
| Guerrero | 3.4 | 7873 | 52.4 | 15.4 | 43.8 | 40.8 | 17.0 | 7.7 | 20.0 | 32.4 | 10.7 | 12.2 |
| Hidalgo | 2.4 | 5593 | 53.9 | 15.9 | 40.2 | 43.9 | 21.9 | 12.6 | 22.6 | 25.2 | 9.0 | 8.7 |
| Jalisco | 5.7 | 13113 | 53.2 | 14.7 | 39.2 | 46.1 | 23.0 | 8.1 | 25.1 | 25.3 | 7.8 | 10.7 |
| State of Mexico | 12.3 | 28483 | 53.6 | 9.9 | 37.4 | 52.6 | 16.8 | 6.2 | 24.4 | 35.0 | 4.0 | 13.6 |
| Michoacan | 3.7 | 8619 | 52.5 | 15.6 | 41.8 | 42.6 | 18.8 | 10.8 | 20.5 | 28.5 | 9.5 | 11.9 |
| Morelos | 3.4 | 7871 | 53.0 | 13.1 | 37.4 | 49.5 | 24.2 | 7.0 | 22.6 | 25.9 | 10.0 | 10.2 |
| Nayarit | 2.1 | 4909 | 52.0 | 18.0 | 41.0 | 41.0 | 17.9 | 10.5 | 24.2 | 31.7 | 4.8 | 10.9 |
| Nuevo Leon | 1.5 | 3352 | 52.2 | 14.9 | 40.0 | 45.1 | 19.2 | 10.4 | 18.9 | 29.0 | 9.8 | 12.6 |
| Oaxaca | 2.2 | 5158 | 51.7 | 15.6 | 42.3 | 42.1 | 19.3 | 10.6 | 24.3 | 24.4 | 11.2 | 10.1 |
| Puebla | 5.3 | 12,274 | 54.1 | 17.3 | 42.0 | 40.7 | 27.0 | 11.4 | 20.4 | 25.6 | 6.9 | 8.8 |
| Queretaro | 1.5 | 3475 | 54.4 | 15.3 | 40.2 | 44.5 | 25.8 | 7.2 | 24.6 | 27.3 | 7.1 | 8.1 |
| Quintana Roo | 0.9 | 1992 | 51.4 | 13.6 | 40.9 | 45.6 | 21.7 | 10.1 | 24.6 | 25.4 | 8.0 | 10.1 |
| San Luis Potosi | 2.1 | 4895 | 53.9 | 20.1 | 44.2 | 35.7 | 17.1 | 12.8 | 23.1 | 25.8 | 10.9 | 10.2 |
| Sinaloa | 4.8 | 11,147 | 52.9 | 18.6 | 38.5 | 42.9 | 27.7 | 8.7 | 16.5 | 29.6 | 3.4 | 14.1 |
| Sonora | 2 | 4588 | 53.2 | 15.6 | 38.6 | 45.8 | 24.1 | 6.6 | 18.8 | 27.7 | 10.9 | 11.9 |
| Tabasco | 2.3 | 5409 | 53.3 | 14.5 | 42.4 | 43.1 | 19.7 | 8.0 | 21.5 | 30.6 | 8.7 | 11.5 |
| Tamaulipas | 2.8 | 6563 | 53.1 | 15.3 | 41.3 | 43.4 | 20.0 | 8.9 | 25.3 | 28.4 | 6.6 | 10.8 |
| Tlaxcala | 2.2 | 5037 | 52.6 | 12.5 | 39.4 | 48.1 | 13.8 | 10.6 | 25.2 | 26.6 | 12.3 | 11.6 |
| Veracruz | 6.8 | 15,758 | 53.2 | 12.1 | 38.3 | 49.6 | 20.8 | 8.7 | 22.5 | 27.2 | 9.5 | 11.3 |
| Yucatan | 2.1 | 4843 | 53.5 | 17.0 | 42.6 | 40.5 | 21.3 | 13.8 | 19.3 | 29.0 | 6.7 | 9.9 |
| Zacatecas | 2.4 | 5467 | 51.3 | 19.8 | 41.0 | 39.2 | 18.4 | 12.7 | 22.8 | 25.8 | 8.1 | 12.1 |
| National | 100 | 231,058 | 53.0 | 15.3 | 40.3 | 44.4 | 21.1 | 9.7 | 22.4 | 28.0 | 7.6 | 11.2 |
PEI: early education program.
There were also differences in terms of the length of stay in the daycare centers; at the national level, the group that stayed 12-17 months was the largest (29%), with the smallest being the 7.6% who remained in the facility for 18-23 months. As can also be shown in table 1, the proportions of the length of stay were similar in each state.
Relationship between the length of stay in PEI and the developmental assessment
Fig. 1 shows the results of the CDE evaluation according to the length of stay in the PEI. The proportion of children with a normal result (green) increased progressively with the length of stay. Thus, 72.3% of the children with < 6 months of attendance obtained a green result, and this was obtained by 79.8% of the 6-12month group (79.8%), and the highest percentage (88.7%) was obtained by the group of children who attended the program for more than 24 months.
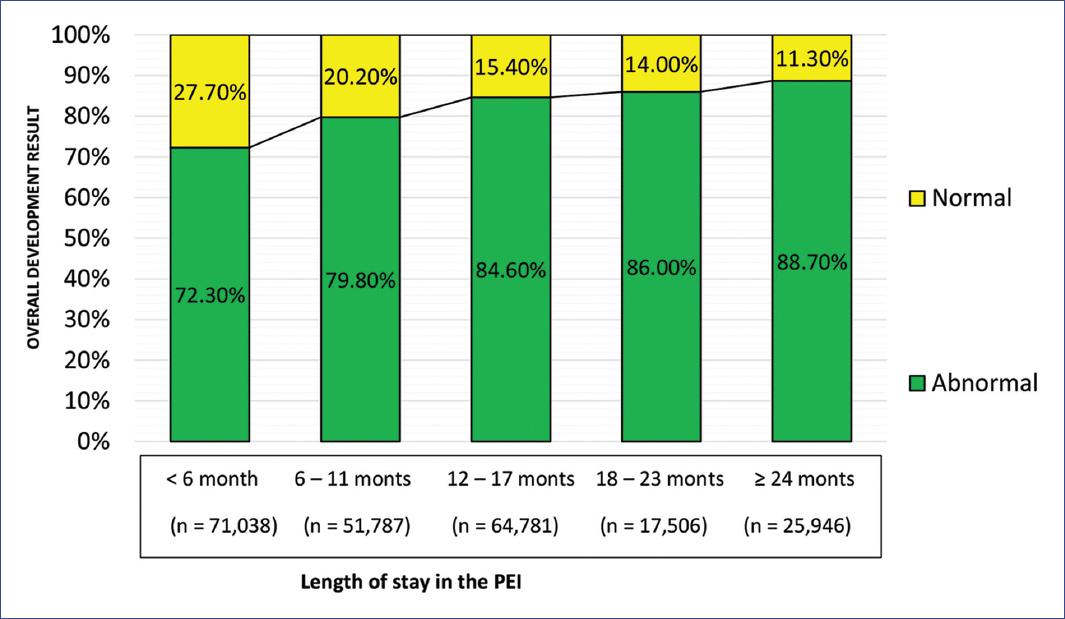
Figure 1 Overall results in all developmental areas were evaluated by length of stay in the PEI (early education program, for its acronym in Spanish).
The result of the CDE test by area of development in the 25,946 children who stayed for more than 24 months in the centers is presented in table 2, both at the national level and for each of the 32 states. This shows that the social area obtained the highest rate (92.92%), followed by language (92.02%), gross motor (90.46%), knowledge (87.78%), and, finally, fine motor (81.84%) areas. It should be noted that Baja California Sur, Coahuila, Guerrero, Oaxaca, and Sonora had the highest percentages of children who obtained green results.
Table 2 Percentage of children who received a normal result in the child development evaluation test (global and by area) who remained in the PEI (early education program, by its Spanish acronym) for more than 24 months (n = 25,946), by state (alphabetic order)
| State | n (%) | Global result (%) | Gross motor (%) | Fine motor (%) | Language (%) | Social (%) | Knowledge (%) |
|---|---|---|---|---|---|---|---|
| Aguascalientes | 605 | 89.10 | 90.60 | 84.00 | 93.40 | 93.90 | 87.10 |
| Baja California | 160 | 89.40 | 94.40 | 90.60 | 93.80 | 94.40 | 86.90 |
| Baja California Sur | 74 | 94.60 | 93.20 | 89.20 | 95.90 | 95.90 | 91.90 |
| Campeche | 221 | 85.50 | 92.80 | 81.40 | 89.10 | 96.40 | 84.60 |
| Coahuila | 529 | 92.70 | 93.60 | 86.00 | 94.10 | 95.30 | 90.70 |
| Colima | 358 | 89.80 | 94.50 | 82.20 | 92.00 | 91.80 | 91.10 |
| Chiapas | 1,581 | 88.80 | 90.50 | 82.60 | 90.90 | 90.40 | 88.30 |
| Chihuahua | 550 | 90.50 | 91.90 | 79.90 | 93.60 | 94.70 | 86.00 |
| Mexico City | 822 | 86.90 | 84.80 | 79.00 | 89.70 | 92.00 | 88.00 |
| Durango | 600 | 88.50 | 89.50 | 83.80 | 92.30 | 93.50 | 88.00 |
| Guanajuato | 1,397 | 87.50 | 91.30 | 84.40 | 92.30 | 93.00 | 87.70 |
| Guerrero | 961 | 93.20 | 95.50 | 89.30 | 95.20 | 93.40 | 92.30 |
| Hidalgo | 487 | 87.50 | 87.10 | 78.90 | 91.40 | 93.00 | 84.80 |
| Jalisco | 1,400 | 88.60 | 89.90 | 79.80 | 93.30 | 93.30 | 88.90 |
| Mexico | 3,880 | 89.70 | 90.50 | 85.20 | 92.50 | 93.70 | 89.60 |
| Michoacan | 1,027 | 89.00 | 91.70 | 83.60 | 94.00 | 94.70 | 90.20 |
| Morelos | 805 | 87.70 | 90.60 | 79.30 | 89.70 | 94.90 | 85.70 |
| Nayarit | 536 | 88.80 | 91.00 | 76.90 | 92.00 | 93.30 | 88.10 |
| Nuevo Leon | 424 | 89.40 | 89.20 | 83.00 | 90.10 | 91.70 | 88.20 |
| Oaxaca | 523 | 91.60 | 89.10 | 81.50 | 92.40 | 96.20 | 90.80 |
| Puebla | 1,079 | 84.80 | 87.80 | 79.40 | 91.40 | 91.50 | 84.80 |
| Queretaro | 281 | 82.60 | 85.80 | 70.80 | 88.30 | 90.00 | 80.80 |
| Quintana Roo | 201 | 80.60 | 89.10 | 78.60 | 90.00 | 91.50 | 82.10 |
| San Luis Potosi | 498 | 85.50 | 87.30 | 77.70 | 90.00 | 88.60 | 85.50 |
| Sinaloa | 1,572 | 89.20 | 91.40 | 83.00 | 91.90 | 93.60 | 89.10 |
| Sonora | 545 | 93.90 | 95.80 | 86.60 | 96.10 | 94.50 | 96.30 |
| Tabasco | 623 | 89.10 | 94.10 | 84.30 | 90.20 | 92.30 | 90.50 |
| Tamaulipas | 709 | 85.00 | 89.70 | 77.30 | 89.00 | 87.70 | 86.70 |
| Tlaxcala | 582 | 84.00 | 84.20 | 77.50 | 91.10 | 89.50 | 84.00 |
| Veracruz | 1,775 | 86.40 | 89.70 | 82.90 | 92.90 | 92.00 | 88.20 |
| Yucatan | 478 | 87.90 | 89.50 | 80.50 | 93.30 | 94.40 | 85.10 |
| Zacatecas | 663 | 90.00 | 88.70 | 79.60 | 92.60 | 92.20 | 87.00 |
| National | 25946 | 88.37 | 90.46 | 81.84 | 92.02 | 92.92 | 87.78 |
Comparison of EDI results between the < 6 months and > 24 months of permanence groups
For greater clarity with regard to how the length of stay has beneficial effects on development, the group of children who remained < 6 months and the group with > 24 months of stay were compared in each state. figure 2 presents all developmental areas, figure 3 shows information concerning the gross motor area, figure 4 describes the fine motor area, figure 5 presents the language area, figure 6 provides insight into the social area, and figure 7 describes the knowledge area. Overall, it can be observed that the group that has attended the program for the longest time achieved better development, and the areas with the greatest differences between less and more time spent in the program are the language (Fig. 5) and social (Fig. 6) areas. It should be noted that the percentage difference between the < 6-month and > 24-month groups was statistically significant (p < 0.001) in practically every state, with some exceptions, such as the gross motor area in Queretaro (p = 0.094) and Quintana Roo (p = 0.159); the fine motor area in Baja California Sur (p = 0.120), Chihuahua (p = 0.108), and Hidalgo (p = 0.231); and the knowledge area in Hidalgo (p = 0.229), Queretaro (p = 0.078), and Quintana Roo (p = 0.136).
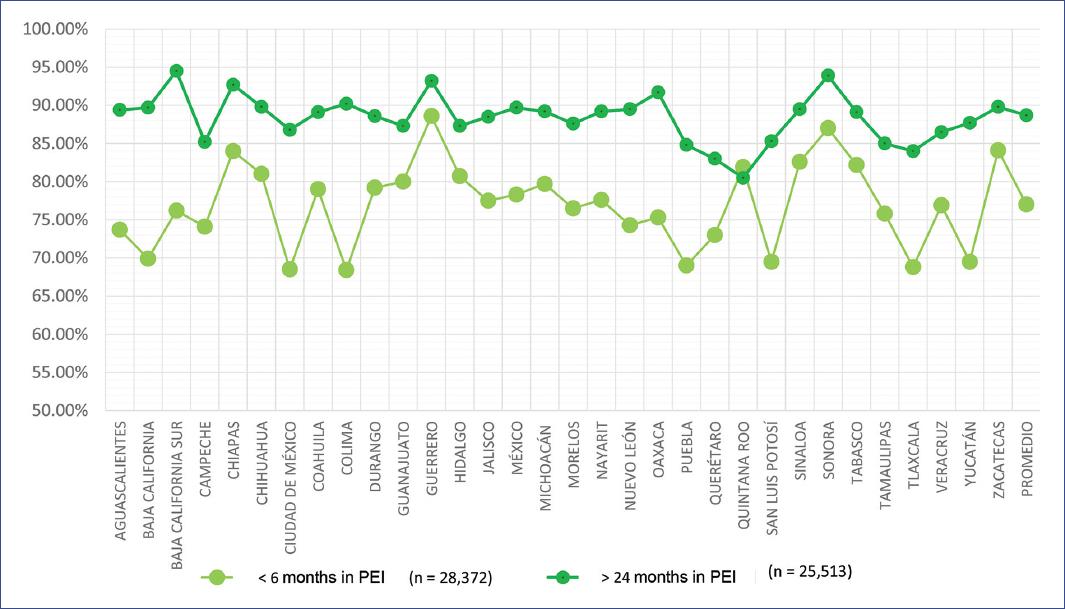
Figure 2 Population percentages by each State of the country (alphabetic order) with normal results in all developmental areas according to length of stay in the PEI (early education program by its acronym in Spanish).
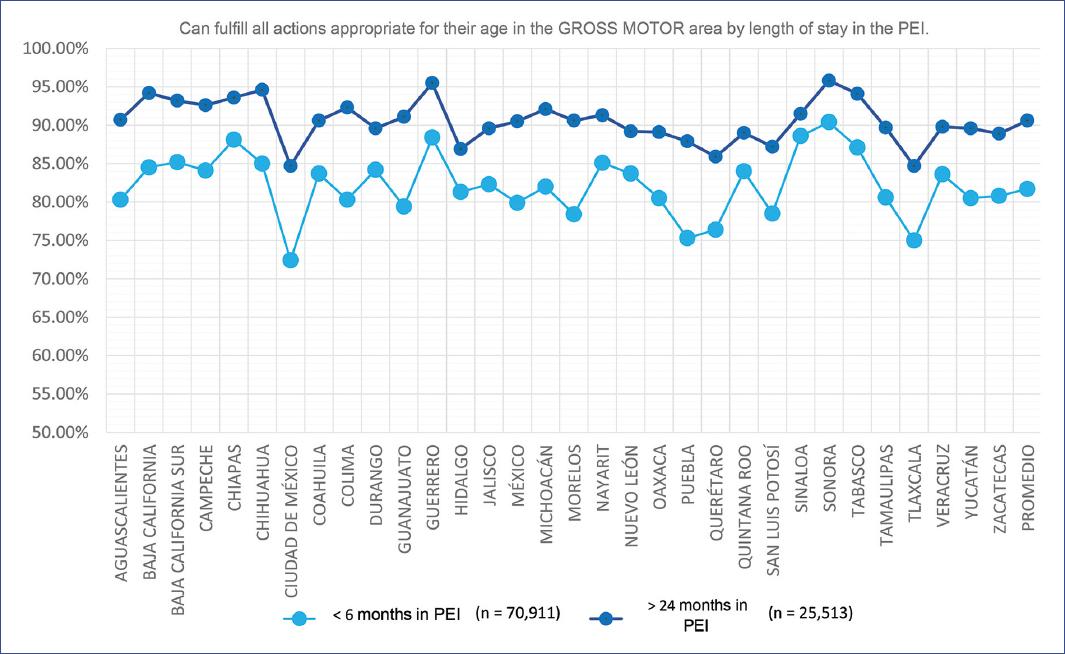
Figure 3 Population percentages by each state of the country (alphabetic order) that has completed all age-appropriate actions in the gross motor based on their age by length of stay in the PEI (early education program by its acronym in Spanish).
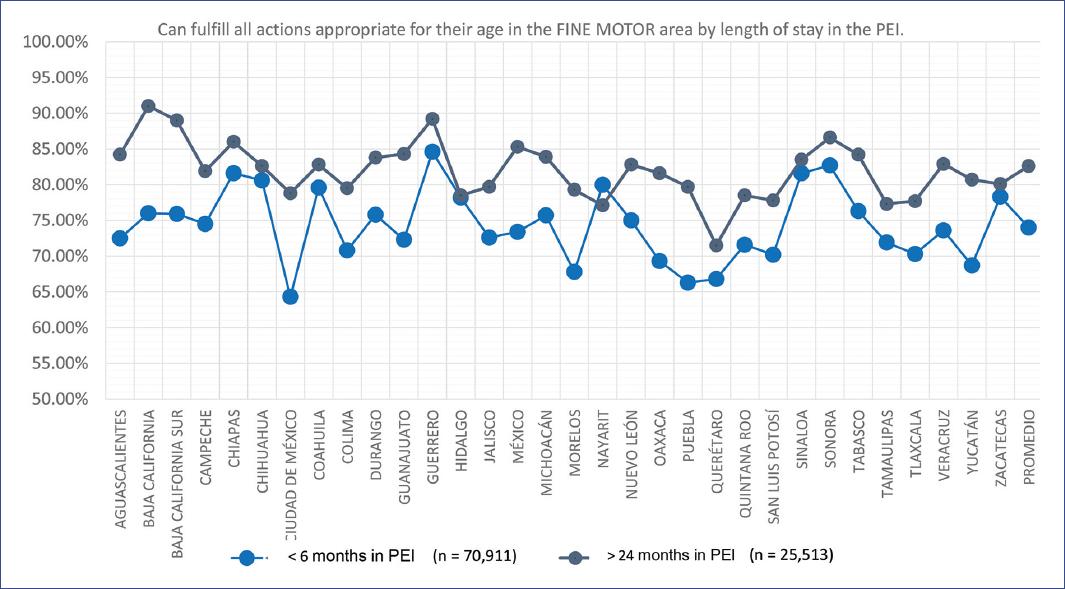
Figure 4 Population percentages by each state of the country (alphabetic order) that has completed all age-appropriate actions in the fine motor based on their age by length of stay in the PEI (early education program by its acronym in Spanish).
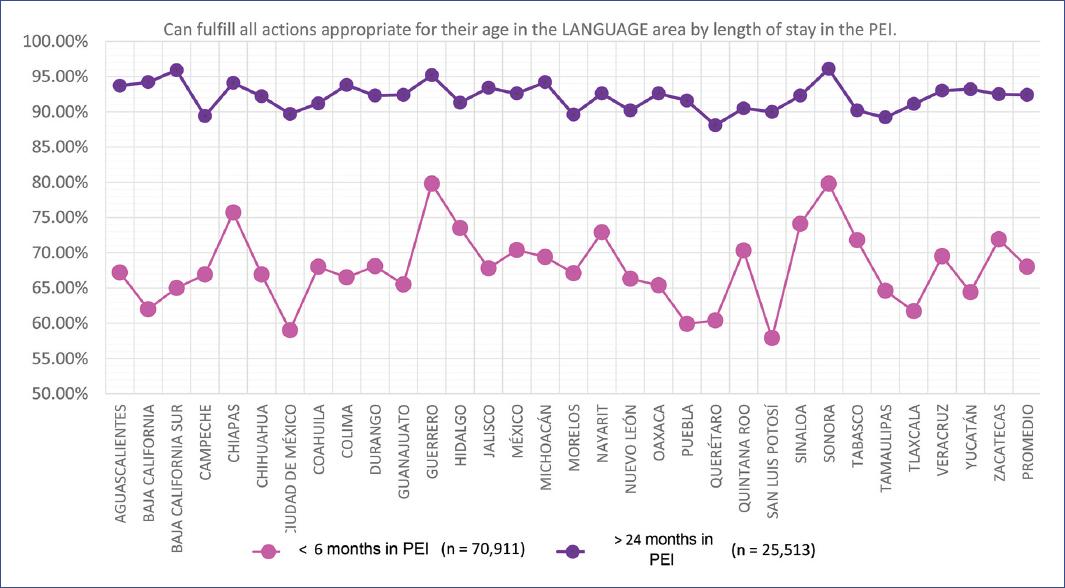
Figure 5 Population percentages by each state of the country (alphabetic order) that has completed all age-appropriate actions in the language based on their age by length of stay in the PEI (early education program by its acronym in Spanish).
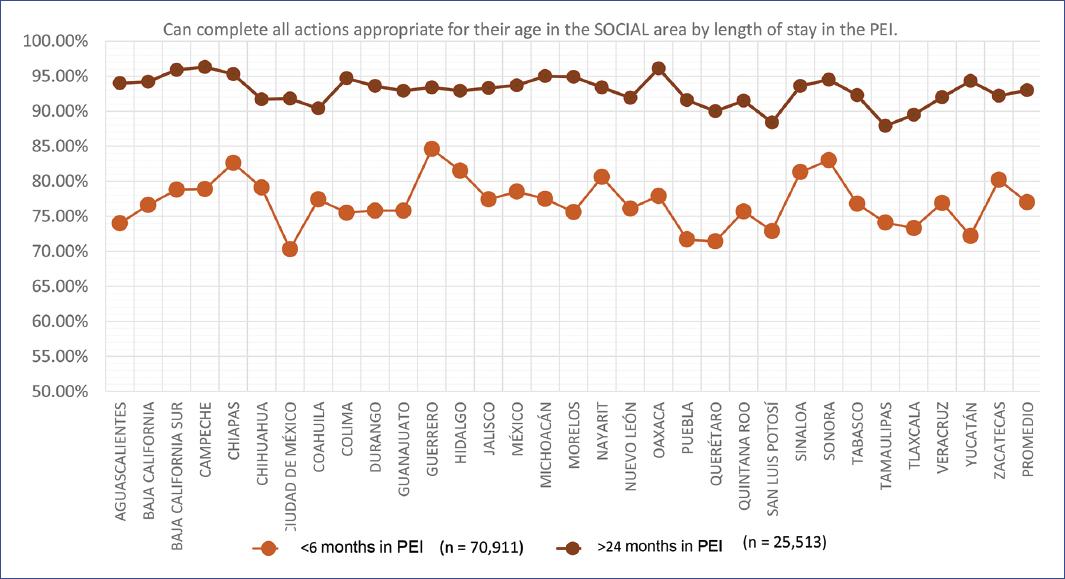
Figure 6 Population percentages by each state of the country (alphabetic order) that has completed all age-appropriate actions in the social based on their age by length of stay in the PEI (early education program by its acronym in Spanish).
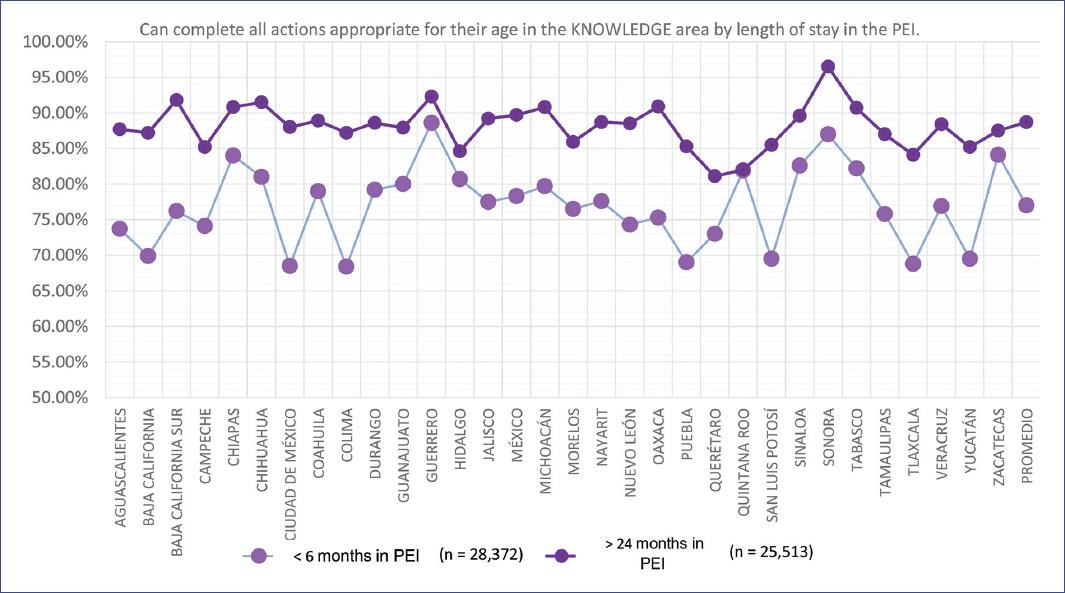
Figure 7 Population percentages by each state of the country (alphabetic order) that has completed all age-appropriate actions in the knowledge based on their age by length of stay in the PEI (early education program by its acronym in Spanish).
Finally, table 3 presents the results of the multivariate analysis to determine the influence of the length of stay in the PEI on a normal outcome, both overall and by area of development, using the OR of prevalence. It can be seen that compared with the group of < 6 months of permanence, there is an increasing tendency for longer lengths of stay to produce greater OR; thus, for the overall rating of the group of 6-11 months of permanence, the OR was 1.4 (95% CI 1.3-1.4), whereas the OR obtained for the 12-17 months group was 1.7 (95% CI 1.7-1.8), that for the 18-23 months group was 2.0 (95% CI 1.9-2.1), and the > 24-month group achieved an OR of 2.4 (95% CI 2.3-2.5). This trend was obtained for all of the developmental areas; however, it was more evident for the language, social, and cognitive areas.
Table 3 Association between length of stay in the PEI and normal outcomes in overall development and specific areas
| Length of stay in the PEI | Global EDI results* OR (95% CI)** | Normal result by area of development* OR (95% CI) | ||||
|---|---|---|---|---|---|---|
| Gross motor | Fine motor | Language | Social | Knowledge | ||
| < 6 months | 1.0 | 1.0 | 1.0 | 1.0 | 1.0 | 1.0 |
| 6-11 months | 1.4 (1.3-1.4) | 1.5 (1.4-1.5) | 1.2 (1.1-1.3) | 1.4 (1.4-1.5) | 1.4 (1.4-1.5) | 1.6 (1.5-1.7) |
| 12-17 months | 1.7 (1.7-1.8) | 1.7 (1.6-1.8) | 1.5 (1.5-1.6) | 1.8 (1.8-1.9) | 2.0 (1.9-2.1) | 2.1 (2.0-2.2) |
| 18-23 months | 2.0 (1.9-2.1) | 2.3 (2.1-2.5) | 1.5 (1.5-1.7) | 2.3 (2.1-2.4) | 2.5 (2.3-2.9) | 2.3 (2.2-2.6) |
| > 24 months | 2.4 (2.3-2.5) | 2.6 (2.4-2.8) | 2.0 (1.9-2.2) | 3.4 (3.1-3.7) | 3.2. (2.9-3.5) | 3.0 (2.7-3.2) |
*Adjusted by sex, age, and state.
**OR (95% CI): odds ratio or prevalence (95% confidence interval); PEI: early education program.
Discussion
This study, which included a very large number of children, demonstrated the beneficial effect of activities carried out in daycare centers on neurodevelopment in children under 5 years old, with the observation that the longer the stay, the more evident the developmental progress, particularly in the areas of language, social, and cognitive skills. These results are consistent with the pilot study conducted before this investigation14. These findings reinforce the idea that the inclusion of children in daycare programs from an early age favors their development22-24, thus justifying continued support for these types of establishments at the national level.
It is worth highlighting the results in the area of language development, as the longer the permanence in the PEI, the greater the probability of normal language development, up to 3.4 times more for the group of children who remained more than 24 months in the program. This is interesting, as previous studies conducted in Mexico have reported a greater risk of language developmental delay in the general population25,26. Thus, it is possible to assume that if families are recommended to enroll their children under 5 years old in daycare centers, this backlog could be reversed. Although it is necessary to acknowledge that the breakthrough does not seem as significant in the fine motor area. This type of national evaluation of federal programs could help to improve the curricula.
The results of this study are not novel, since similar results have been published demonstrating the positive influence of preschool education on psychomotor development in children aged 5 and 6 years old, but it should be noted that the children who benefit most from these educational programs are those who grow up in vulnerable families4,7,24.
Previous studies conducted by our research group have found, using the CDE test, a decrease of up to 3.1% in the proportion of children with abnormal development at 3 years old when compared to 1-year-old children25. At the same time, a recent study conducted using the CDE test between 2019 and 2022 detected a probability of global developmental delay of 42.1% (95% CI: 40.3-43.9), identifying male sex (OR 2.2, 95% CI: 1.9-2.6) as a risk factor26 From this information, as part of the analyses performed for this study, age and sex were considered possible confounders in the logistic regression model; as shown in table 3, in each of the OR, the length of stay remained an independent variable that was associated with normal development when adjusted for age and sex.
To understand the positive influence on child development in daycare centers, the positive and negative points of enrolling children in these facilities must be contrasted. Because the benefits of childcare programs include that they facilitate parents' employment through providing a substitute for the care of children, increasing household income, and providing better food, thus maintaining the health of members of the family. In addition, unlike at home, learning activities are offered in daycare centers, which certainly help to improve children's language and knowledge. Likewise, certain group activities of children attending daycare centers facilitate and enhance social interaction with same-age peers, not to mention the fact that many of these centers offer healthy foods that, without a doubt, are of great help in maintaining children's nutritional status (particularly in low-income families)22.
However, the disadvantages of daycare centers are mainly focused on the detrimental effects of the absence of parents; it is possible that compared to what happens at home, there is a decrease in the attention given to the child, limiting personalized care. Likewise, it should be considered that children attending daycare centers are frequently exposed to infectious diseases owing to contact with contagious staff or peers, as well as accidents attendant on physical activities and joint games. Finally, it is important to keep in mind that the progress in the development of each child also depends on the quality of the psycho-pedagogical and educational activities offered at each facility9.
In addition, it has been noted that some parents worry about their children's attendance at daycare centers, for instance, on the grounds that the care provided by those outside of the child's parents could be insufficient compared to what they could get at home. However, from a sociocognitive perspective, children require social interaction with adults, which is fundamental for language development, cognition, and emotional regulation. In this regard, the effects of attending daycare centers from an early age were evaluated in a prospective longitudinal study, in which 1,201 children aged 18 months were divided into two groups, those who attended daycare centers with individual care and those who were part of group care activities. The results showed that children in group childcare obtained better scores in cognitive ability and better guidance and commitment than infants in individual care23. The results of that study are consistent with this report. Thus, it would be appropriate to say that children who attend daycare centers develop better skills which can help them progress more effectively in subsequent stages of life. However, further longitudinal studies are needed that will compare the development of children who attend daycare with children who remain at home.
In addition to the analysis of ECD services in Latin-American Countries10, in Mexico in 2012 was conducted a study that analyzed the different programs of early childhood provided by the public sector, showing great social disparities in access because the ECD programs were based on a right for the adults that are in the formal sector instead of a right for the children27. In this study, differences between states (high vs. low income) on outcomes in developmental areas, foster the need to provide quality services to promote optimal child development28,29. The ECD services, such as the PEI and the use of CDE test results, could also function as a bridge between the educational sector and the family, as an opportunity to talk about their concerns about development and ideas to implement at home. This is of particular importance because it has been shown in Mexico that better levels of language in children are associated with access to books, preschool, and support to learning30. To really get a change in ECD an intersectoral policy is needed that could articulate the efforts, considering children at the center of that policy31-33.
The limitations of the study are that there is not a representative sample of ECD levels in children by geographical region, sex, and age, neither we could not show the impact on ECD level for the different PEI interventions available, and the results could only apply to the children that are users of the specified ECD program. Another limitation is that neither familiar, emotional, or other health conditions were evaluated. Further studies including these factors and other programs are needed, together with the deep analysis of the children with and without the regular assistance to any ECD service, and later the transition to the formal educational sector. The strengths of the study are that ECD test is used as a public policy in the health sector and the results of the ECD test used in the PEI daycare centers are recognized as a reference tool for further evaluation in primary health facilities. Furthermore, the fact that the program was federal and with unified contents, materials, daycare facilities, and educational contents helped to see the differences among geographical regions without those confusing factors included in previous.
Conclusions
This study showed at the national level, that long-term enrollment in daycare centers (PEI) favors normal development. This seems particularly important in low-income regions because could be an equalizing strategy as a public policy. The different results among in developmental areas could help to improve the curricula of daycare centers, and in this way, the ECD measurement with the CDE test could be both a tool for identifying children that individually need further attention, and a regional level to analyze the impact of the program and areas of opportunity. We hope that the results of new national representative surveys, be able to compare the results within the country and between countries. Further studies are needed to corroborate these findings. The need for monitoring development periodically in early childhood educational services is highlighted.

