


 nova página do texto(beta)
 Espanhol (pdf)
 Artigo em XML
 Referências do artigo
 Enviar este artigo por email
 Citado por SciELO
  Similares em
SciELO
Similares em
SciELO 
 Permalink
Introduction
Soil is a highly dynamic system that supports life and food security worldwide, as 95% of food is directly or indirectly produced in soils (SEMARNAT, 2013). In recent decades, population growth and subsequent urban, industrial, and agricultural development have made soil a critical natural resource. The Mexican government (SEMARNAT, 2013) reported that chemical degradation-associated with agricultural activities (decreased fertility, pollution, salinization/alkalinization and eutrophication) was the most widespread form of soil degradation in Mexico in 2002, affecting approximately 34.04 million hectares (17.8% of the national territory) (López-Pérez et al., 2017).
Soil pollution by trace elements from human activities and released by rocks through natural weathering is a real concern, because of trace elements are toxic to live organism (Balderas-Plata, Gutiérrez, Carillo, Ortiz y Lugo de la Fuente, 2006). According to Álvarez, (2010), among soil nutrients, trace elements (TE), such as cadmium (Cd), chromium (Cr), cooper (Cu), nickel (Ni), lead (Pb) and zinc (Zn) play a crucial role in the development of biomass, as they are essential for the supply and absorption of chemical compounds necessary for plant or crop growth, as well as metabolism. TE can be found as soluble species, available forms, or weakly or strongly bound to solid particles or precipitates. Their accumulation in the soil results from both lithological sources and those added by human activity (Alloway, 2013). The availability of TE in the soil is determined by edaphological parameters (e.g., pH, redox conditions, and cation exchange capacity), their tendency to react with active soil phases (such as clay and organic matter), and the physicochemical reactions occurring between the solid phase and the soil solution (Kabata-Pendias and Pendias, 2000).
Furthermore, chemical properties also play an important role in the soils. For example, organic matter (OM) in soils is crucial because low values may indicate, 1) Low fertility, as OM improvs the soil’s ability to retain nutrients and water; 2) Poor biological and microbiological activity (Paul, 2016); 3) Soil structure problems, as the absence of OM can inhibit root growth (Usharani, Roopashree, and Dhananjay, 2019); and 4) Erosion and weathering, as OM helps to hold soil in place and protects soil surface (Tisdall and Oades, 1982). According to the Mexican regulations (NOM-021-SEMARNAT-2000, 2002), in non-volcanic soils, OM values <0.5% represent very low OM concentration, between 0.6% - 1.5% represent low OM concentration, and values between 1.6% to 3.5% indicate medium OM concentration.
In general, agricultural soils have typical total nitrogen concentrations of around 0.1% to 0.2% in the surface layer (Usharani et al., 2019). When the concentration is low, it is recommended to add an additional nitrogen source, such as nitrogen fertilizers (Snyder, Bruulsema, Jensen, and Fixen, 2009) to these soils. Nitrate concentrations in agricultural soils are estimated to be between 10 to 50 mg kg-1 in the surface layer, which provides an adequate amount of available nitrate for most crops (Brady, 2021; Snyder et al., 2009). On the other hand, when the concentration reaches or exceeds 100 mg kg-1, it may indicate nitrate overload, which can lead to leaching and groundwater contamination (Brady, 2021; Snyder et al., 2009).
According to the Mexican norm NOM-021-SEMARNAT-2000 (2002), the pH in the different soil types should be alkaline, ranging from light to moderate. Fageria and Stone (2006) established that pH is a good indicator of the presence or absence of certain soil constituents, the cations in the exchange complex, the availability of nutrients for crops, and the biological activity in the soil.
In 2017, it was reported that 40 746.87 ha were planted, and 39 010.82 ha were harvested in Baja California Sur, yielding a total production of 744 519.74 tons, with a production value of 5.106 billion pesos (Agricultura de Baja California Sur, 2023). This placed the state 24th in the national ranking for production value. Of the five municipalities, Comondú had the highest agricultural production in the state, contributing over 70%, followed by La Paz with 18% (Agricultura de Baja California Sur, 2023). Additionally, it is important to note that 99% of agricultural soils in Baja California Sur are fertilized, which increases the risk of contamination (Graciano, 20131). Trace elements (TE) such as heavy metals and metalloids constitute a group of hazardous inorganic chemical elements, which are predominant in contaminated soils. These include lead (Pb), chromium (Cr), arsenic (As), zinc (Zn), cadmium (Cd), copper (Cu), mercury (Hg), and nickel (Ni) (Wuana and Okieimen, 2011). Many metals, such as Zn and Cu, are essential for the normal growth of plants and living organisms; however, they can become toxic at high concentrations. Pb and Cr can also be tolerable to the ecosystem at low concentrations, but are very harmful at high levels (Machender, Dhakate, Prasanna, and Govil, 2011).
Irrigation for agricultural purposes accounts for 60% of water resources in developed countries, while in developing countries, this can reach up to 90% (Adeyemi, Grove, Peets, and Norton, 2017). One of the most common practices for disposing of domestic wastewater has been its direct discharge, without treatment, into surface water bodies and the soil. However, the quality of these waters can lead to two types of problems: public health issues, which are particularly significant in tropical countries due to the high incidence of infectious diseases, where pathogens spread efficiently through excreta or raw wastewater (Mara and Cairncross, 1990), and environmental problems, as they affect the conservation or protection of aquatic and soil ecosystems, lead to the loss of ecosystems and species that inhabit these areas, and cause a decrease in biodiversity (Pearce and Turner, 1990). Often, the production methods of food are unknown (Scott, Faruqui, and Raschid, 2004); however, untreated wastewater is frequently used to irrigate 10% of the world’s crops. Although this practice is largely hidden and prohibited in many countries, many farmers, especially those in urban areas, use wastewater because, in addition to its benefits, it is cost-free and abundant, even during drought periods (Scott, Faruqui, and Raschid, 2004).
Given all the above, this research aims to evaluate the potential contamination of surface soil in the La Paz Valley under different irrigation conditions (wastewater, well water) as well as in areas with no agricultural use. We quantified the contamination level associated with the different irrigation conditions. The objectives of this study are to: 1) evaluate the total concentration of six trace elements (Cd, Cr, Cu, Ni, Pb and Zn) Figure 1; 2) determine the Geoaccumulation Index (Igeo) (Müller, 1969), and 3) establish the variation in metal concentrations among the different soil types. Additionally, since TE in soils is closely related to soil chemical properties (organic matter, total nitrogen, nitrates, and pH), and could affect basic soil processes, we aim to 4) assess whether any relationship exists between chemical properties and TE concentrations.
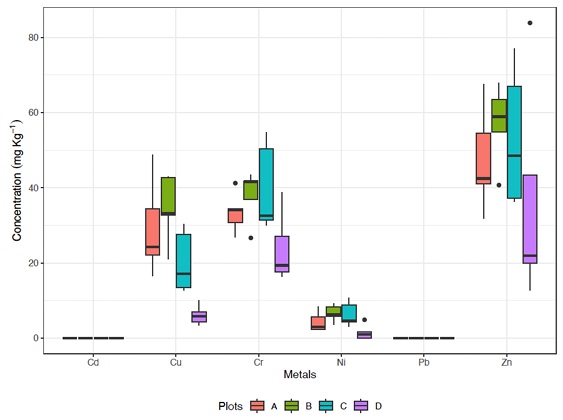
Figure 1: Mean metal concentrations (Cd, Cu, Cr, Ni, Pb, Zn (mg kg-1); horizontal line), confidence interval (box), and range (vertical line) in the different plots. A) Pristine soils, without any productive purpose; B) Irrigated for 15 years with waste water, followed by 20 years without any irrigation; C) Currently irrigated with wastewater; and D) Irrigated with deep well water.
Materials and Methods
Study area
The samples were collected in La Paz Valley (LAP), Baja California Sur, which is located in the southern part of the Baja California Peninsula, near the city of La Paz and close to the airport. The climate in this area is predominantly dry, with an average annual temperature range from 20 to 26 °C, reaching maximum temperatures in July, August, and September (up to 40-45 °C) (Bell, Menzer, and Troyo, 2012). The total annual precipitation is 775 mm (Ritchie, Rosado and, Samborska, 2024), mostly occurring during the summer, with the highest values in August and September. At the end of summer, tropical storms and hurricanes occur, which can reach the region’s aquifers due to the associated rainfall (González-Hita, Mejía, Martinez, Aparicio, and Flores, 2021). La Paz Valley is a tectonic graben with a north-south orientation, limited to the east by the La Paz fault, located on the slopes of the Las Cruces Mountain range, and to the west by the El Carrizal fault (Álvarez, Rojas and Prieto, 1997). This area is characterized by a lack of rivers or permanent surface flows in its surface hydrology (Hirales-Rochin, 2022).
Sample collected
All samples were collected during the first week of December 2023, during the dry season, in accordance with NOM-021-SEMARNAT-2000 (2002). Using a manual post hole digger, approximately 5 to 6 subsamples were collected from 0 to 50 cm depth. The subsamples were then mixed and homogenized to obtain a representative sample of 2 kg, generating 5 samples per site. These samples were subsequently dried for a week at room temperature.
Five samples were collected on four different types of plots (hereafter referred as “site”) with varying forms of irrigation: A) Pristine soils, with no productive use; B) Irrigated for 15 years with wastewater, followed by 20 years without any irrigation; C) Currently irrigated with wastewater; and D) Irrigated with deep well water.
Trace metal analysis
A total of 20 soil samples, divided among the four sites, were analyzed (Table 1). The analysis of six trace elements−cadmium (Cd), chromium (Cr), cooper (Cu), nickel (Ni), lead (Pb) and zinc (Zn) was carried out in the Atomic Absorption Spectrophotometry Laboratory at the Centro de Investigaciones Biológicas del Noroeste (CIBNOR; La Paz, B.C.S.).
Table 1: I-geo classification and contamination level of soils (Charzyński, Plak, and Hanaka, 2017).
| I-geo value | I-geo classification | Contamination level |
| < 0 | 0 | Not contaminated |
| 0 – 1 | 1 | Uncontaminated to moderately contaminated |
| 1 – 2 | 2 | Moderately contaminated |
| 2 – 3 | 3 | Moderately to highly polluted |
| 3 – 4 | 4 | Highly polluted |
| 4 – 5 | 5 | From highly polluted to extremely polluted |
| >5 | 6 | Extremely polluted |
Soil samples were digested with nitric acid and hydrogen peroxide in a microwave oven (Mars 5x, C-EM, Matthew, NC, USA). After acid digestion, 1 ml of hydrochloric acid (HCl) was added to each sample, and the volume was brought to 50 ml with deionized water. Cadmium (Cd), chromium (Cr), copper (Cu), nickel (Ni), lead (Pb), and zinc (Zn) concentrations were determined by atomic absorption spectrophotometry (GBS Scientific AVANTA, Dandenong, Australia) using an air/acetylene flame (Cadena-Cárdenas, Méndez, Zenteno, García, and Acosta, 2009). Each sample was tested in triplicate. High-purity reagents were used in all cases; blanks were analyzed in parallel to validate the method’s efficiency (Barrera-García et al., 2012). A standardized reference material, PACS-2 and MESS-2, from the National Research Council of Canada (NRCC), was also analyzed in each sample run as a quality control. The analysis of metal content yielded recovery values ranging from 93% to 116% for the entire process. The detection limits (mg kg-1) respectively were as follows: Cd: 0.020; Cr: 0.056; Cu: 0.0142; Ni: 0.036; Pb: 0.050 and Zn: 0.0161.
Each sample that produced an undetectable concentration, i.e., below the detection limit (DL), for a given metal was assigned a value corresponding to half the DL for that metal (Farnham, Singh, Stetzenbach, and Johannesson, 2002). We applied this methodology based on Farnham et al. (2002), who found that using Monte Carlo simulation experiments with a mixture multivariate model, performed to test the effects of substitution of the “<DL” values with 0, DL, and DL/2. The results showed that the substitution with DL/2 produced better results than the substitution with DL or 0 (Farnham et al., 2002).
Calculation of the geo-accumulation index (Igeo). The geo-accumulation index (Igeo) proposed by Müller (1969) is widely used to evaluate contamination through the ratio of the concentration of an analyte in the study matrix versus the reference or control values. The geo-accumulation index is calculated according to equation (1) (Charzyński, Plak, and Hanaka, 2017):
Where Cn is the measured concentration of the contaminating metal n (mg kg-1) in the soil, Bn is the geochemical continental crust value (mg kg-1) of each element and the factor of 1.5 is introduced to minimize the effects of possible variations that can be attributed to lithogenic effects (Charzyński, Plak, and Hanaka, 2017). The result of the I-geo gives a measure of the degree of contamination of a soil or sediment and classifies them into seven categories according to Table 1.
Chemical analysis
Four different chemical variables (organic matter, total nitrogen, nitrates, and pH) were evaluated in the same 20 soil samples in which TE was analyzed. All analyses were conducted in the Soil and Water laboratory at the Universidad Autónoma de Baja California Sur (La Paz, B.C.S.), except for nitrates, which were analyzed in the Soil Science Laboratory at CIBNOR (La Paz, B.C.S.).
Organic matter (OM). To determine organic matter content, soil samples were reacted with potassium dichromate (K2Cr2O7) and sulfuric acid (H2SO4), which form a potent oxidizing agent, chromic acid, that oxidizes the carbon in organic matter, converting it into CO2. The chemical reaction produces a green color, depending on the amount of organic matter present in the soil. Dried and sifted (1 mm mesh) soil samples (0.05 g) were weighed, and 10 ml of 1.0 Normal potassium dichromate (K2Cr2O7) was added and gently shaken to impregnate the soil. Additionally, 20 ml of concentrated sulfuric acid (H2SO4) and 170 ml of distilled water were added. Finally, 8 drops of the orthophenanthroline indicator were added, and titration was performed with FeSO4 until the solution turned from green to brown. This is the modified Walkley and Black method (Walkley, 1947).
Total nitrogen. Based on the organic matter values, the total nitrogen was determined. Gros (1992) established that the organic matter contains approximately 5% nitrogen, so its nitrogen content in the soil can be calculated by multiplying the organic matter content by 20 (Castellanos, Uvalle, and Aguilar, 2000).
Nitrates. Nitrate concentration (N-NO3) was determined using the method of Strickland and Parsons (1972), modified by Hernández-López and Vargas (2003). In this method, micro-level samples are used instead of larger amounts. The samples were activated with cadmium, and 250 μl were added to each well of the microplate. To each well, 10 μl of sulfanilamide and dihydrochlorinated ethylenediamine were added. The complete process, including reactions, should take no more than 10 min. The mixture was shaken and incubated at room temperature for 10 min, after which it was read at 540 nm in a spectrophotometer using a microplate, as detailed in Hernández-López and Vargas (2003).
pH. An air-dried soil sample was mixed with distilled water. A pH meter was calibrated using two standard buffers, depending on the type of test sample, with standard buffers at pH levels of 4.00, 7.00, and 10.00. For acid soils, pH 4.00 and 7.00 buffers were used, and for alkaline soils, pH 7.00 and 10.00 buffers were used. Three different standard soils (air-dried) with known pH, covering the pH range of the test samples, were used. Weighted 10 g of dry soil sifted with a 1 mm mesh, and 20 ml of distilled water were added. The mixture was stirred constantly for 30 min. Between each sample reading, the pH meter was recalibrated with the buffer to ensure accurate measurements. pH values were acceptable within ± 0.1 pH unit of known values. If pH values fell outside this range, a recalibration with the standard buffers was performed, and the measurement was repeated (Kalra, 1995; McLean, 1982).
Linear regression was applied to assess the relationships between metal concentrations and chemical variables. All statistical tests and plots were conducted using R (R Core Team, 2020) version R 4.0.0.
Data analysis
Prior to the statistical analyses, the normality and homogeneity of variance were determined using the Shapiro-Wilk and Bartlett tests, respectively. To test for significant differences in trace metal concentration (Cd, Cr, Cu, Ni, Pb and Zn) from the four different sites type a one-way ANOVA on ranks (Cu, Cr, Ni, Zn) or Kruskal-Wallis (Zn) test was used, depending on the normality and homogeneity of variance. And a Tukey or Dunn test was applied as a post hoc test, respectively.
Results and Discussion
Trace metal analysis
Two of the six trace metals analyzed in the different site types were below the detection limits, cadmium (0.01 mg kg-1) and lead (0.025 mg kg-1) (Table 2). All results for trace metal concentrations are included in Table 2. The measurement of these elements is important because the concentration of Cd in the environment has increased more than other trace metals due to the use of phosphate fertilizers, galvanic processes, and cement industry, while Pb contamination has grown due to improper disposal and handling of lead batteries and paints (Gallego et al., 2012). Cd is considered a human carcinogen by the International Agency for Research on Cancer (Gallego et al., 2012), while Pb, after arsenic, is reported as the second most dangerous substance by the Agency for Toxic Substances and Disease Registry (Shahid, Dumat, Pourrut, Sabir, and Pinelli, 2014). The fact that these elements were found at low levels indicates that the sites are not contaminated, which is consistent with the results obtained for the Igeo index for all elements across the four sites (Table 2).
Table 2: Statistics from each trace metal concentration (mg kg-1) in the different sites.
| Concentration | Igeo | ||||||
| Site | Trace metal | Min | Max | Mean | SD | SE | Contamination level |
| A | Cd | 0.01 | 0.01 | 0.01 | 0 | 0 | Not Contaminated |
| Cu | 16.62 | 48.77 | 29.26 | 12.68 | 5.67 | ||
| Cr | 26.89 | 41.26 | 33.53 | 5.30 | 2.37 | ||
| Ni | 2.31 | 8.48 | 4.36 | 2.69 | 1.20 | ||
| Pb | 0.025 | 0.025 | 0.025 | 0 | 0 | ||
| Zn | 31.81 | 67.58 | 47.49 | 13.82 | 6.18 | ||
| B | Cd | 0.01 | 0.01 | 0.01 | 0 | 0 | |
| Cu | 21.07 | 42.91 | 34.54 | 8.99 | 4.02 | ||
| Cr | 26.69 | 43.54 | 38.09 | 6.84 | 3.06 | ||
| Ni | 3.56 | 9.29 | 6.67 | 2.26 | 1.01 | ||
| Pb | 0.025 | 0.025 | 0.025 | 0 | 0 | ||
| Zn | 40.74 | 67.92 | 57.19 | 10.42 | 4.66 | ||
| C | Cd | 0.01 | 0.01 | 0.01 | 0 | 0 | |
| Cu | 12.69 | 30.36 | 20.25 | 8.17 | 3.65 | ||
| Cr | 30.1 | 54.82 | 39.88 | 11.76 | 5.26 | ||
| Ni | 3.14 | 10.72 | 6.33 | 3.24 | 1.45 | ||
| Pb | 0.025 | 0.025 | 0.025 | 0 | 0 | ||
| Zn | 36.36 | 77.00 | 53.24 | 18.11 | 8.10 | ||
| D | Cd | 0.01 | 0.01 | 0.01 | 0 | 0 | |
| Cu | 3.39 | 10.15 | 6.16 | 2.61 | 1.17 | ||
| Cr | 16.40 | 38.82 | 23.56 | 9.34 | 4.18 | ||
| Ni | 0 | 4.91 | 1.53 | 2.03 | 0.91 | ||
| Pb | 0.025 | 0.025 | 0.025 | 0 | 0 | ||
| Zn | 12.75 | 83.88 | 36.42 | 28.90 | 12.92 | ||
Min = minimum; Max = maximum; SD = Standard deviation; SE = Standard error. A) Pristine soils, without any productive purpose; B) Irrigated for 15 years with wastewater, followed by 20 years without any irrigation; C) Currently irrigated with wastewater; and D) Irrigated with deep well water.
There were significant differences by sites in the average concentrations of Cu, Cr, and Ni. For Cu significant differences were found between A (pristine soils) and D (irrigated with deep well water) (X 2 3.16 = -23.1, P < 0.05) sites, and B (irrigated for 15 years with wastewater followed by 20 years without any irrigation) and D (X 2 3.16 = -28.4, P < 0.05) sites. For Cr significant differences were found between sites C (currently irrigated with wastewater) and D (X 2 3.16 = -16.0, P < 0.05) plots. Lastly, significant differences were established between B and D (X 2 3.16 = -5.14, P < 0.05) sites, and C and D (X 2 3.16 = -4.81, P < 0.05) sites in Ni. (Figure 1)
Site B has the highest values for copper (Cu) (21.07 mg kg-1 and 42.91 mg kg-1), nickel (Ni) (3.56 mg kg-1 and 9.29 mg kg-1), and zinc (Zn) (40.74 mg kg-1 and 67.92 mg kg-1). While site D has the lowest values, for Cu(3.39 mg kg-1 and 10.51 mg kg-1), Ni (0.018 mg kg-1 and 4.91 mg kg-1), and Zn (12.75 mg kg-1 and 83.88 mg kg-1) (Table 2).
Copper (Cu) is primarily associated with mining activities (De Gregori, Fuentes, Rojas, Pinochet y Potin, 2003). It alters the natural characteristics of soils in areas near such activities and can cause adverse effects on agricultural crops and in living organisms in the soil (Adriano, 2001). The values obtained in this study were below the Canadian Soil Quality Guidelines for the protection of environmental and human health (63 mg kg-1) (Canadian Council of Ministers of the Environment, 2024). The concentration of Cu in site D was different from that in sites A and B, as the Cu levels in site D were the lowest. It has been established that Cu levels in deep well water are generally low (<0.006 mg kg-1) and can be influenced by the dissolution of copper minerals in the aquifer (Abanyie, Apea, Abagale, Yahans, and Daanoba, 2023).
The concentration of nickel (Ni) in the soil mainly depends on the content of the parent material (the forming rock); however, on the surface, it can also reflect the impact of contamination (Cempel and Nikel, 2006). In humans, high concentrations of Ni can have toxic effects, causing neurological, reproductive, and carcinogenic issues (Marmiroli and Maestri, 2008). None of the sites analyzed exceeded 10 mg kg-1; which is within the limit indicated by the Canadian Soil Quality Guidelines for the Protection of Environmental and Human Health (45 mg kg-1) (Canadian Council of Ministers of the Environment, 2024). The statistical difference between site D and sites B and C is likely due to site D being irrigated with deep well water, which had the lowest values (1.53 mg kg-1) (Table 2). High Ni content is indicative of sediments contaminated by a petrochemical source (Chitsazan, Dorraninejad, Zarasvandi, and Mirzaii, 2009). Still, none of the sites showed high concentrations, and the Igeo index confirmed that the soils were not contaminated.
Zinc (Zn) had the highest concentrations (57.19 mg kg-1 in site B). It has been established that Zn concentrations are generally the highest in soil, which aligns with this study’s findings. When compared to the Canadian Soil Quality Guidelines for the Protection of Environmental and Human Health (250 mg kg-1) (Canadian Council of Ministers of the Environment, 2024), the Zn concentrations obtained in this study fall within the established range. Additionally, according to the Igeo index, the soils are not contaminated (Table 2). Zn plays an important role for both humans and animals, as it is necessary for the functioning of several enzymatic systems (WHO, 2008). However, at high concentrations, it can cause toxicity symptoms in humans and animals (Plant, Bone, Ragnarsdottir, and Voulvoulis, 2011). The concentration range for Zn in soils is generally considered in adequate levels (20 to 100 mg kg-1) (Rashid and Ryan, 2004).
For chromium (Cr), the highest values were found in site C (currently irrigated with wastewater), with values between 30.1 mg kg-1 and 54.82 mg kg-1, while the lowest values were found in site D, with values between 16.39 mg kg−1 and 38.82 mg kg-1 (Table 2; Figure 2).
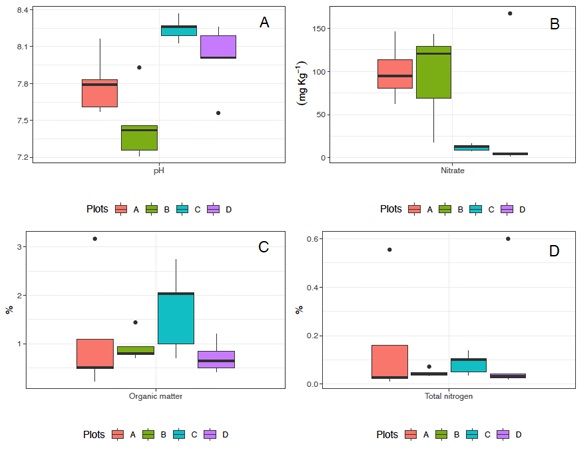
Figure 2: Mean values of concentration (horizontal line), confidence interval (box), and range (vertical line) of pH (A), nitrates (B), organic matter (C), and total nitrogen (D) in the different sites. A) Pristine soils, without any productive purpose; B) Irrigated for 15 years with wastewater, followed by 20 years without any irrigation; C) Currently irrigated with wastewater; and D) Irrigated with deep well water.
Chromium (Cr) is an element that has been identified as both an essential micronutrient and a carcinogenic agent, depending on its chemical form (Katz and Salem, 1994). It is widely used in industry, so high levels can indicate contamination from industrial areas, posing a health risk (Cifuentes-Morales and Novillo, 2016). In this study, the site with the highest concentration of Cr was site C (39.88 mg kg-1). However, this concentration does not exceed the limit set by the Canadian Soil Quality Guidelines for the Protection of Environmental and Human Health (64 mg kg-1) (Canadian Council of Ministers of the Environment, 2024). Sites C and D showed different concentrations, likely because site C (39.88 mg kg-1) was irrigated with wastewater. This may have influenced the Cr concentration, as wastewater often contains relatively high concentrations of chromium species, depending on the effectiveness of wastewater treatment plants (Vaiopoulou and Gikas, 2012).
All the trace metal concentrations analyzed in this study were compared with the Canadian Soil Quality Guidelines for the Protection of Environmental and Human Health, and we found that the concentrations at all four sites were lower than the Canadian guidelines (Canadian Council of Ministers of the Environment, 2024).
Chemical properties
The highest mean values for the chemical properties were found in different sites. For organic matter (OM), the highest mean value (1.70%) was determined in site C, while the highest values for total nitrogen (99.42%) and nitrates (0.15 mg kg−1) were found at site A (pristine soils). The lowest mean values were observed for organic matter (0.72%) at site D, and for total nitrogen (0.08%) and nitrates (11.9 mg kg-1) at site C. The pH values ranged from 7.46 (site B) to 8.24 (site C) (Table 3; Figure 2).
Table 3: Statistics from each physicochemical parameter in the different plots.
| Plot | Parameter | Min | Max | Mean | DS | ES |
| A | Organic matter (%) | 0.22 | 3.17 | 1.1 | 1.2 | 0.54 |
| Total nitrogen (%) | 0.01 | 0.55 | 0.15 | 0.23 | 0.10 | |
| Nitrates (mg kg-1) | 62.7 | 146 | 99.42 | 31.99 | 14.31 | |
| pH | 7.57 | 8.16 | 7.79 | 0.23 | 0.10 | |
| B | Organic matter (%) | 0.7 | 0.8 | 0.93 | 0.29 | 0.13 |
| Total nitrogen (%) | 0.03 | 0.07 | 0.05 | 0.01 | 0.01 | |
| Nitrates (mg kg-1) | 18.1 | 142.9 | 95.86 | 51.73 | 23.14 | |
| pH | 7.21 | 7.93 | 7.46 | 0.28 | 0.13 | |
| C | Organic matter (%) | 0.71 | 2.74 | 1.70 | 0.84 | 0.37 |
| Total nitrogen (%) | 0.04 | 0.10 | 0.08 | 0.04 | 0.02 | |
| Nitrates (mg kg-1) | 7.7 | 16.2 | 11.9 | 3.48 | 1.56 | |
| pH | 8.13 | 8.37 | 8.24 | 0.09 | 0.04 | |
| D | Organic matter (%) | 0.42 | 1.2 | 0.72 | 0.31 | 0.14 |
| Total nitrogen (%) | 0.02 | 0.6 | 0.14 | 0.25 | 0.11 | |
| Nitrates (mg kg-1) | 1.9 | 167.4 | 36.32 | 73.28 | 32.77 | |
| pH | 7.56 | 8.26 | 8.01 | 0.27 | 0.12 |
Min = minimum; Max = maximum; SD = standard deviation; SE = standard error. A) Pristine soils, without any productive purpose; B) Irrigated for 15 years with wastewater, followed by 20 years without any irrigation; C) Currently irrigated with wastewater; and D) Irrigated with deep well water.
There were significant differences by sites in the average percentage of nitrates vs pH. For nitrates significant differences were found between sites A and C (X 2 3,16 = -1.98, P < 0.05), A and D (X 2 3.16 = -2.24, P < 0.05), B and C (X 2 3.16 = -2.03, P < 0.05) and, B and D (X 2 3.16 = -2.30, P < 0.05). pH values were different between sites A and C (X 2 3.16 = 0.452, P < 0.05), C and B (X 2 3.16 = 0.788, P < 0.05) and, D and B (X 2 3.16 = 0.550, P < 0.05). For OM vs. nitrogen, there were no statistically significant differences between sites.
In summary, the low percentage of OM in soils suggests that they are in poor condition in terms of fertility, structure, and biological activity. The mean percentage of total nitrogen at sites A and D falls within the typical range (Usharani et al., 2019), while sites B and C have concentrations below the typical range, indicating nitrogen deficiency. This is probably related to the low OM content at site B, which has the lowest values. Sites A and B have the highest nitrates concentrations, which may indicate leaching processes, although the concentration of lead is low. In general, the pH values across the soils exhibited relatively alkaline levels (mean values ranging from 7.46 to 8.24), likely due to the geology and topography of the area. It is known that the alkaline pH can create optimal conditions for the availability of macro and micronutrients (Fageria, Baligar, and Clark, 2002), which aligns with the pH range observed in this study. However, other factors should be further analyzed.
Most of the combinations between trace elements and chemical properties were not statistically significant (P < 0.05). However, a significant relationship was found between OM and three metals (Cu, Ni, and Zn) (P < 0.05) (Figure 3). These positive correlations suggest that as OM increases, the concentration of these metals also increases, or that these metals share common sources (Vargas-González et al., 2017).
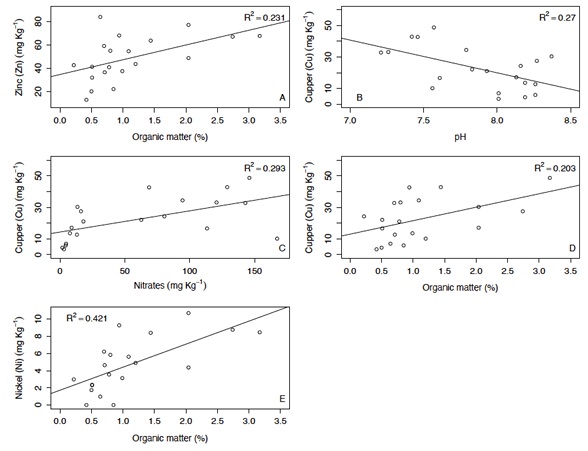
Figure 3: Significant linear relationship between different trace metal concentrations (Zn, Cu, and Ni) and some chemical variables (Organic matter, nitrates, and pH).
A previous study found that Cu was minimally affected by other chemical properties; however, this study revealed a significant effect of OM on Cu. This could be due to reduction and oxidation processes that occur through cycles of wetting and drying, which are likely accelerated by the presence of higher amounts of OM and increased microbial activity (Zamulina et al., 2021). On the other hand, we observed that an increase in OM led to higher Zn concentrations. According to Kashem and Singh (2001), the compounds in the OM can form chelates or complexes with Zn, which increases their solubility and availability in the soil. The concentration of Ni in agricultural soils can also increase with the addition of OM, as OM forms complexes with Ni, thereby increasing its solubility and availability (Vicari-Mellis, Pessôa, and Casagrande, 2004).
The relationship between copper (Cu) and soil pH, as well as between Cu and nitrate, was significant (P < 0.05; Figure 3) and influenced by several interacting factors. For example, with respect to pH: 1) Acidic conditions: Cu solubility increases in acidic soils (low pH), while it decreases in alkaline soils. As soil pH decreases, copper becomes more soluble and available to plants because acidic conditions promote the dissolution of copper ions from soil particles and OM; 2) Complex formation: In acidic soils, copper can form soluble complexes with organic acids and other anions, which further enhancing its availability; 3) Nutrient Interactions: In highly acidic soils, other nutrients such as phosphorus, may become less available, potentially affecting overall plant health and copper uptake (Bohn, McNeal, and O’Connor, 1985). For nitrates, nitrification inhibition depended on metal, and Cu was found to impair nitrification at concentrations lower than the published critical levels in soil (Cela and Summer, 2002).
Conclusions
Trace metal and chemical properties were analyzed in four different plots (sites) with varying irrigation types, finding no contamination from Cd, Cr, Cu, Ni, Pb, and Zn based on the Igeo index and comparison with the Canadian Soil Quality Guidelines for the Protection of Environmental and Human Health. This is significant because it suggests that, at least for these six trace elements, the different water types used for irrigation (e.g., wastewater, well water) do not contribute to contamination. The chemical properties varied between the four sites, with generally low OM concentrations and low nitrogen levels in two sites, as well as high nitrate concentrations in the other two sites. These variations in chemical properties could be attributed to a leaching process and alkaline soil conditions. Additionally, significant correlations were found, which are essential because the interaction between trace metals and chemical properties can influence various factors in the soil, such as acidic conditions, complex formation, nutrient interactions, and the presence of microorganisms, key components for soil health.

