


 nueva página del texto (beta)
 Inglés (pdf)
 Artículo en XML
 Referencias del artículo
 Enviar artículo por email
 Citado por SciELO
  Similares en
SciELO
Similares en
SciELO 
 Permalink
Introduction
Reference evapotranspiration (ETo) is an essential variable for hydrological modeling and design of agricultural irrigation (Matsui & Osawa, 2023; Kim et al., 2024), especially under conditions of limited data availability and prevailing drought (Elbeltagi et al., 2022; Fang et al., 2024; Matimolane et al., 2024; Sutanto et al., 2024). ETo “is the evapotranspiration rate of a hypothetical reference crop 12 cm tall and growing under optimal water conditions” (Kim et al., 2024; Skhiri et al., 2024). At the global level and when all observed variables are available, the standard method for estimating ETo is Penman-Monteith FAO-56 (EToPMO; Raja et al., 2024). However, due to the large number of variables required for its calculation, ETo is usually estimated using alternative methods (EToalti; Song et al., 2018).
One of the EToalti (the letter i refers to alternative methods) that is recommended in the growth stage of agricultural crops (Celestin et al., 2020; Uzunlar & Dis, 2024) is Romanenko (EToRo; Romanenko, 1961), cited by Vásquez et al. (2011). On the other hand, many authors, e.g., Gao et al. (2017), Celestin et al. (2020), Raja et al. (2024) and Uzunlar & Dis (2024), recommend the use of the Priestley-Taylor method (EToPT; Priestley & Taylor, 1972) due to its high sensitivity and consistency under semi-arid climate conditions. Also, because they only use the variables of mean air temperature (Tmean) and extraterrestrial solar radiation (Ra), the McGuinness and Bordne (EToMB; McGuinness & Bordne, 1972) and Oudin (EToOu; Oudin et al., 2005) methods can be a good alternative for measuring ETo. The above is particularly reliable when a good performance is desired (Vásquez et al., 2011; Yang et al., 2021; Li et al., 2024) highlighting the practical necessity of simplified methods. According to Matimolane et al. (2024), Raja et al. (2024) and Uzunlar et al. (2024), the Hargreaves method (Hargreaves, 1975; Hargreaves & Samani, 1985; Hargreaves et al., 2003) is a widely used EToalti (EToH75 and EToH85) worldwide, because it is an excellent alternative when the only variables available are Tmean, maximum temperature (Tmax), and minimum temperature (Tmin). However, when only evaporation (Eva) data are available, Usta (2024) recommends the pan-evaporation method (EToTE), which offers acceptable accuracy, low cost, and operational simplicity. The seven EToalti listed above are widely used in under constraints typical of developing countries, such as Mexico, mainly because weather stations usually present three limitations: a) small number of measured variables, b) high percentage of missing data and c) nonhomogeneity of the climate series. These three limitations are not foreign to Sinaloa, which is an eminently agricultural state and has a mostly semi-arid climate (Llanes et al., 2022), so strategies must be developed to calculate EToPMO using the limited data available (EToPM).
In this study, through the National Water Commission and the National Meteorological Service (CONAGUA-SMN, 2024a), daily data on Tmax, Tmin and Eva were obtained for 11 weather stations in Sinaloa (period 1969-2018). Once the series of series of Tmax, Tmin, and Eva were homogenized, Tmean was computed. Next, ETo was calculated by means of each of the seven EToalti described in the second paragraph of this introduction. Based on the equations proposed by Allen et al. (1998), EToPM was also calculated. Using the mean absolute error (MAE) and the root mean square error (RMSE), the average daily performance of the seven EToalti was calculated. For the MAE and RMSE, the variables were EToPM vs EToalti (i=1,…,7). After calculating the annual cumulated value of EToPM at the 11 weather stations, the predicted annual cumulated value of EToPM [EToPMP (dependent variable)] was modeled using multiple linear and nonlinear regressions, where the seven EToalti acted as independent variables. The 11 models of EToPMP were validated using the three tests recommended by Llanes et al. (2022): a) normality of residuals, b) linearity and fit, and c) homogeneity of residuals. Due to the small number of weather stations, EToPM was validated at only one weather station. This validation consisted of finding a significant Pearson and Spearman correlations in the daily data (Out of sample data) for the year 2008 between EToPM (Mocorito station) and EToPMO (San Juan station).
The goal of the study was to evaluate the performance of seven EToalti and predict EToPMP in the state of Sinaloa, Mexico.
The 11 EToPMP models developed in this study offer a reliable tool for quantifying crop water requirements in Sinaloa (Sutanto et al., 2024). This represents a valuable contribution to sustainable agricultural water management in semi-arid regions (Llanes et al., 2022; Satpathi et al., 2024).
Materials and methods
Study area
This study was carried out in the state of Sinaloa, located in northwestern Mexico (Figure 1). Although the state covers only 2.9% of the area of Mexico, it is considered the largest producer of vegetables and grains (CODESIN, 2023), hence, it is commonly referred to as “the breadbasket of Mexico” (Galindo & Alegría, 2018). According to Flores et al. (2012), the climate conditions of Sinaloa range from dry and semi-dry in the coastal plain to temperate and semi-warm-subhumid in the mountain range. Tmean (semi-sum of Tmax and Tmin) ranges mostly from 14.0°C to 26.0°C. The study uses data from 11 weather stations: Culiacán, El Playón, Guatenipa, Ixpalino, La Cruz, Mocorito, Sanalona II, Rosario, Santa Cruz de Alaya, Siqueros and Surutato. An additional station, San Juan was used for validation of the results of Mocorito station (Figure 1).
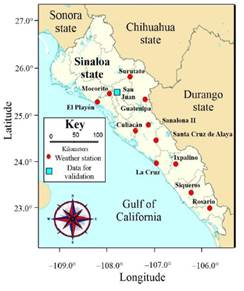
Source: Authors, following database https://smn.conagua.gob.mx/es/climatologia/informacion-climatologica/informacion-estadistica-climatologica and https://smn.conagua.gob.mx/tools/GUI/sivea_v3/sivea.php).
Figure 1 Geographic location of the 11 principal weather stations and 1 weather station for validation, in the state of Sinaloa, Mexico.
Data
Daily data on Tmax, Tmin and Eva were obtained from the 11 weather stations for the period 1969-2018. Provided by (CONAGUA-SMN, 2024a): https://smn.conagua.gob.mx/es/climatologia/informacion-climatologica/informacion-estadistica-climatologica. CONAGUA-SMN (2024b) also provided data for the year 2008 from San Juan station (located approximately 7.7 km from the Mocorito station): https://smn.conagua.gob.mx/tools/GUI/sivea_v3/sivea.php. The sub-hourly series (every 10 minutes) of data provided for San Juan station were wind speed at a height of 10 m (Uz), observed mean temperature (TmeanO), observed incident solar radiation (SRR), observed atmospheric pressure (PatmO), and observed relative humidity (RHO).
Data quality control
The following quality controls were applied to the daily series of Tmax, Tmin and Eva:
To improve the statistical confidence of the results, weather stations containing at least 50 years of available data were chosen.
The missing days were filled in (it was verified that all series recorded 18,262 days); that is, 38 normal years and 12 leap years. The percentages of missing data for the 11 weather stations ranged from Tmax = 0.51% (Culiacán) to Tmax = 32.81% (Surutato); from Tmin = 0.57% (Culiacán) to Tmin = 32.82% (Surutato) and from Eva = 1.27% (Sanalona II) to Eva = 100% (Mocorito).
It was verified that Tmax > Tmin and that Eva ≥ 0.
Missing daily data were imputed using the method of interpolation of standardized neighboring series (Kennedy et al., 2023).
The daily climate series were homogenized using the standard normal homogenization test (SNHT) (Alexandersson, 1986; Perčec et al., 2023).
Items d and e were done with the climatol package, version 4.1.0 (https://cran.r-project.org/web/packages/climatol/climatol.pdf), developed by Guijarro (2024). After quality control, Tmean was calculated from Tmax and Tmin.
The sub-hourly series from the San Juan station were subjected to three quality controls:
The missing days were filled in. Since 2008 is a leap year, it was verified that each series contained 52,704 data points, that is, 366 days. The percentages of missing data from the San Juan station were: Uz = 41.47%, TmeanO = 41.49%, SRR = 65.88%, PatmO = 41.48% and RHO = 41.49%.
Using the multiple imputation technique (Rubin, 2004; Remiro et al., 2024), missing data were imputed.
The daily average of each series was then calculated.
Reference evapotranspiration methods (ETo)
In table 1 are mentioned seven alternative methods and the standard method. These eight methods are widely used in scientific literature due to their simplicity and effectiveness.
Table 1 Reference evapotranspiration methods (ETo) (translation). Source: Authors.
| Formulation | Method | Citations | |
|---|---|---|---|
|
|
Romanenko | Romanenko (1961); Vásquez et al. (2011); Li et al. (2024) | (1) |
|
|
Priestley-Taylor | Penman (1948); Priestley-Taylor (1972); Sentelhas et al. (2010) | (2) |
|
|
McGuinness Bordne | McGuinness Bordne (1972); Vásquez et al. (2011) | (3) |
|
|
Hargreaves 1975 | Hargreaves (1975); Hargreaves et al. (2003) | (4) |
|
|
Pan-evaporation | Doorembos & Pruitt (1977); Chávez et al. (2013) | (5) |
|
|
Hargreaves 1985 | Hargreaves & Samani (1985); Hargreaves et al. (2003) | (6) |
|
|
Oudin | Oudin et al. (2005) | (7) |
|
|
Penman-Monteith (standard method) | Allen et al. (1998); Sentelhas et al. (2010) | (8) |
Tmean = mean temperature (°C), ea = actual vapor pressure (kPa), es = saturation vapor pressure (kPa), ∆ = slope of the saturated vapor pressure curve (kPa °C-1), γ = psychrometric constant (kPa °C-1), Rn = net radiation (MJ m-2 day-1), G = soil heat flux density (MJ m-2 day-1, null when working at the daily scale), λ = latent heat of vaporization (2.45 MJ kg-1), SR = calculated incident solar radiation (MJ m-2 day-1), Ra = extraterrestrial solar radiation (MJ m-2 day-1), Tmax = maximum temperature (°C), Eva = evaporation of water from the pan (placed in a dry fallow area; mm day-1), kp = tabulated adjustment coefficient and U2 = daily wind speed at a height of 2 m (m s-1).
In this study U2 = 2 m s-1 was applied because it is a value recommended by Allen et al. (1998), when observed data are not available. In addition, the same value of U2 was also obtained for 2000 weather stations around the world (Allen et al., 1998; cited by Córdova et al., 2015). Finally, many authors; for example, Lin et al. (2022), Varga et al. (2022) and Yonaba et al. (2023), point out that U2 has a marginal impact on the value of EToPM compared to Tmean and SR.
Performance metrics between the seven alternative methods (EToalti) and the Penman-Monteith method with limited data (EToPM)
Mean absolute error (MAE) and root mean square error (RMSE)
Using two performance metrics, mean absolute error (MAE; Equation 9) and root mean square error (RMSE; Equation 10), the performance of the seven EToalti was evaluated using two metrics: MAE and RMSE.
As: MAE = mean absolute error (mm day-1), RMSE = root mean square error (mm day−1), EToalti = reference evapotranspiration for alternative method i (mm day-1), and EToPMi = Penman-Monteith reference evapotranspiration with limited data (mm day-1).
Predictive models of Penman-Monteith annual cumulative reference evapotranspiration with limited data (EToPMP)
First, the annual cumulative value of EToPM was calculated. Multiple linear and non-linear regressions were applied to all series of EToPM. The annual cumulative EToPM values were modeled as EToPMP (dependent variable) and the seven EToalti were the independent variables.
Predictive models of Penman-Monteith annual cumulative reference evapotranspiration with limited data (EToPMP)
The following validations were applied to the residuals of all multiple regressions (linear and non-linear):
Normality: the Shapiro-Wilk test was applied to the residuals of the linear regressions.
If the residuals of the linear regressions were normal, the model was considered validated, otherwise, a non-linear regression (square polynomial) was applied.
Homogeneity: the nullity of the averages of the residuals of all regressions (linear and non-linear) was verified.
Linearity and fit: a correlation hypothesis test was applied based on Equations 11 and 12 to assess goodness of fit. All linear regressions showed linearity: Pearson correlation (Pr) (Pearson critical correlation (|Pcr|) [(|Pcr| = 0.279; n = 50)]. All non-linear regressions showed good fit: Spearman correlation (Sr) ( Spearman critical correlation ((Scr() [(|Scr| = 0.280; n = 50)]. In all models, Pr and Sr were obtained using √R2.
Penman-Monteith daily reference evapotranspiration with limited data (EToPM)
At San Juan station, using Equation 13, the average daily wind speed was determined at a height of 2 m.
where: Uz = average daily wind speed measured at a height of 10 m (m s-1) and z = measurement height of Uz (m).
Because San Juan station also presented PatmO and RHO data, the observed saturation vapor pressure (ess) was calculated with Equation 14, respectively:
As: ess = observed saturation vapor pressure (kPa) and RHO = observed relative humidity (%).
Finally, for the San Juan station data, a dispersion analysis was applied between EToPM vs EToPMO (Equation 15). After a normality analysis, it was found that Pr ( (Pcr( (|Pcr| = 0.103; n = 366 for the year 2008).
As: EToPMO = Penman-Monteith observed reference evapotranspiration (mm day-1) and TmeanO = observed mean temperature (°C).
Software used and significance of statistical analysis
The following software packages were used to perform statistical analyses and visualization: Office 365, XLstat version 2024, RStudio version 2023.12.1 build 402, Past 4.02 and CorelDRAW version 2019.
All statistical analyses were performed with a statistical significance of α = 0.05.
Results
Variation of maximum (Tmax), minimum (Tmin) and mean (Tmean) temperatures, and evaporation (Eva)
According to the data (table 2), the average daily maximum temperature (Tmax) ranged from 24.995 °C in Surutato to 34.633 °C in Guatenipa. The absolute maximum reached 47.000 °C (Guatenipa), while the lowest recorded maximum was 37.500 °C (Surutato). Regarding minimum temperatures (Tmin), the average values varied from 7.257 °C (Surutato) to 19.545 °C (Culiacán), with extremes ranging from -6.000 °C (Surutato and El Playón) to 2.000 °C (Culiacán). The mean temperature (Tmean) averaged between 16.126 °C (Surutato) and 26.230 °C (Culiacán). For evaporation (Eva), the average values ranged from 3.976 mm (Surutato) to 6.648 mm (El Playón), with monthly extremes between 0.000 mm and 17.900 mm.
Table 2 Maximum, minimum, and average daily values for Tmax, Tmin, Tmean (°C) and Eva (mm), for the period 1969-2018.
| Weather station | Statistical inference | Tmax (°C) | Tmin (°C) | Tmean (°C) | Eva (mm) |
|---|---|---|---|---|---|
| Culiacán | Average | 32.921 | 19.545 | 26.230 | 5.769 |
| maximum | 46.000 | 30.000 | 36.700 | 17.900 | |
| Minimum | 15.500 | 2.000 | 11.000 | 0.000 | |
| El Playón | Average | 31.361 | 16.863 | 24.112 | 6.648 |
| maximum | 45.500 | 37.000 | 38.000 | 17.800 | |
| Minimum | 13.000 | -6.000 | 8.750 | 0.100 | |
| Guatenipa | Average | 34.633 | 17.789 | 26.211 | 4.890 |
| maximum | 47.000 | 30.000 | 36.500 | 14.700 | |
| Minimum | 15.000 | 0.500 | 11.500 | 0.000 | |
| Ixpalino | Average | 34.229 | 17.318 | 25.774 | 4.878 |
| maximum | 46.000 | 28.500 | 34.250 | 17.400 | |
| Minimum | 18.000 | -1.200 | 11.400 | 0.100 | |
| La Cruz | Average | 30.299 | 17.447 | 23.872 | 4.409 |
| maximum | 42.000 | 33.000 | 34.500 | 18.000 | |
| Minimum | 12.000 | 0.000 | 9.100 | 0.000 | |
| Mocorito | Average | 32.971 | 17.318 | 25.144 | No value |
| maximum | 45.000 | 32.000 | 37.500 | No value | |
| Minimum | 9.000 | 0.000 | 6.250 | No value | |
| Sanalona II | Average | 33.872 | 15.847 | 24.860 | 5.464 |
| maximum | 44.000 | 28.500 | 35.000 | 17.800 | |
| Minimum | 17.000 | -5.000 | 8.250 | 0.000 | |
| Rosario | Average | 32.659 | 18.735 | 25.697 | 4.810 |
| maximum | 41.000 | 31.000 | 35.000 | 16.600 | |
| Minimum | 17.000 | 1.400 | 12.750 | 0.000 | |
| Santa Cruz de Alaya | Average | 32.476 | 17.763 | 25.118 | 5.543 |
| maximum | 43.000 | 34.000 | 37.000 | 15.400 | |
| Minimum | 13.400 | 1.000 | 11.800 | 0.000 | |
| Siqueros | Average | 33.907 | 17.958 | 25.932 | 4.746 |
| maximum | 43.000 | 28.500 | 34.500 | 14.600 | |
| Minimum | 17.000 | -0.500 | 11.000 | 0.000 | |
| Surutato | Average | 24.995 | 7.257 | 16.126 | 3.976 |
| maximum | 37.500 | 20.500 | 27.500 | 12.500 | |
| Minimum | 9.000 | -6.000 | 2.300 | 0.000 |
Source: Authors, following database (https://smn.conagua.gob.mx/es/climatologia/informacion-climatologica/informacion-estadistica-climatologica).
Average daily reference evapotranspiration (ETo) estimated using seven alternative methods (EToalti) and the Penman-Monteith method with limited data (EToPM)
The values of ETo (table 3) estimated by the seven alternative methods (EToalti) exhibited seasonal variation. For example, EToH85 ranged from 2.987 mm day-1 (December in La Cruz) to 7.798 mm day-1 (May in Guatenipa), while EToH75 varied between 2.806 and 6.877 mm day-1 in the same periods. The Priestley-Taylor method (EToPT) presented values from 1.920 mm day-1 to 6.767 mm day-1. EToTE values ranged from 1.521 to 6.554 mm day-1. McGuinness and Bordne (EToMB) reached a maximum of 8.710 mm day-1 (June in Guatenipa), and Romanenko (EToRo) recorded the highest values overall, with up to 10.972 mm day-1. The standard Penman-Monteith method with limited data (EToPM) ranged from 2.071 to 4.321 mm day-1.
Table 3 Average daily reference evapotranspiration (ETo) estimated using seven alternative methods (EToalti) and the Penman-Monteith method with limited data (EToPM), for the period 1969-2018 (mm day-1).
| Weather station | Average reference evapotranspiration (mm day-1) 1969-2018 (mm day-1) | ||||||||
|---|---|---|---|---|---|---|---|---|---|
| Month | EToPM | EToH85 | EToH75 | EToPT | EToTE | EToMB | EToRo | EToOu | |
| Culiacán | Jan | 2.196 | 3.245 | 3.047 | 2.317 | 2.190 | 3.668 | 6.363 | 2.494 |
| Feb | 2.467 | 4.040 | 3.794 | 3.180 | 2.895 | 4.491 | 6.792 | 3.054 | |
| Mar | 2.854 | 5.064 | 4.756 | 4.246 | 3.990 | 5.545 | 7.484 | 3.771 | |
| Apr | 3.219 | 6.031 | 5.664 | 5.264 | 4.935 | 6.719 | 8.088 | 4.569 | |
| May | 3.413 | 6.564 | 6.164 | 5.889 | 5.647 | 7.781 | 8.317 | 5.291 | |
| Jun | 3.078 | 6.108 | 5.736 | 5.717 | 5.835 | 8.501 | 7.085 | 5.781 | |
| Jul | 2.923 | 5.885 | 5.527 | 5.553 | 4.775 | 8.497 | 6.642 | 5.778 | |
| Aug | 2.724 | 5.483 | 5.149 | 5.156 | 4.224 | 8.063 | 6.298 | 5.483 | |
| Sep | 2.488 | 4.843 | 4.548 | 4.482 | 3.751 | 7.248 | 6.038 | 4.928 | |
| Oct | 2.601 | 4.497 | 4.223 | 3.843 | 3.529 | 5.975 | 7.097 | 4.063 | |
| Nov | 2.397 | 3.682 | 3.458 | 2.776 | 2.680 | 4.429 | 7.066 | 3.011 | |
| Dec | 2.112 | 3.047 | 2.861 | 2.109 | 1.996 | 3.537 | 6.283 | 2.405 | |
| El Playón | Jan | 2.298 | 3.199 | 3.004 | 2.094 | 2.614 | 3.197 | 6.428 | 2.174 |
| Feb | 2.553 | 3.981 | 3.739 | 2.957 | 3.304 | 3.946 | 6.819 | 2.683 | |
| Mar | 2.866 | 4.939 | 4.638 | 4.007 | 4.413 | 4.931 | 7.341 | 3.353 | |
| Apr | 3.070 | 5.747 | 5.397 | 4.961 | 5.425 | 6.088 | 7.593 | 4.140 | |
| May | 3.273 | 6.326 | 5.941 | 5.606 | 6.211 | 7.074 | 7.932 | 4.810 | |
| Jun | 2.847 | 5.813 | 5.460 | 5.429 | 6.554 | 8.021 | 6.564 | 5.454 | |
| Jul | 2.722 | 5.625 | 5.283 | 5.346 | 5.527 | 8.304 | 6.125 | 5.647 | |
| Aug | 2.621 | 5.349 | 5.023 | 5.060 | 4.979 | 7.943 | 6.027 | 5.402 | |
| Sep | 2.470 | 4.819 | 4.526 | 4.464 | 4.411 | 7.110 | 6.020 | 4.835 | |
| Oct | 2.585 | 4.440 | 4.170 | 3.736 | 4.142 | 5.664 | 7.075 | 3.851 | |
| Nov | 2.524 | 3.692 | 3.467 | 2.612 | 3.192 | 4.032 | 7.320 | 2.742 | |
| Dec | 2.263 | 3.053 | 2.867 | 1.920 | 2.483 | 3.131 | 6.523 | 2.129 | |
| Guatenipa | Jan | 2.596 | 3.578 | 3.360 | 2.331 | 1.785 | 3.618 | 7.677 | 2.460 |
| Feb | 2.999 | 4.589 | 4.309 | 3.379 | 2.476 | 4.584 | 8.479 | 3.117 | |
| Mar | 3.544 | 5.877 | 5.520 | 4.682 | 3.498 | 5.819 | 9.570 | 3.957 | |
| Apr | 4.040 | 7.102 | 6.670 | 5.971 | 4.530 | 7.200 | 10.506 | 4.896 | |
| May | 4.321 | 7.798 | 7.323 | 6.767 | 5.260 | 8.275 | 10.972 | 5.627 | |
| Jun | 3.906 | 7.299 | 6.855 | 6.604 | 4.891 | 8.710 | 9.640 | 5.923 | |
| Jul | 3.141 | 6.304 | 5.921 | 5.861 | 3.516 | 8.149 | 7.611 | 5.541 | |
| Aug | 2.898 | 5.834 | 5.479 | 5.417 | 3.050 | 7.680 | 7.144 | 5.223 | |
| Sep | 2.724 | 5.222 | 4.904 | 4.733 | 2.715 | 6.897 | 7.065 | 4.690 | |
| Oct | 2.955 | 4.898 | 4.600 | 3.986 | 2.527 | 5.661 | 8.442 | 3.850 | |
| Nov | 2.815 | 4.032 | 3.786 | 2.801 | 2.055 | 4.244 | 8.482 | 2.886 | |
| Dec | 2.462 | 3.316 | 3.115 | 2.096 | 1.599 | 3.451 | 7.460 | 2.346 | |
| Ixpalino | Jan | 2.906 | 3.859 | 3.624 | 2.449 | 1.862 | 3.721 | 8.171 | 2.530 |
| Feb | 3.257 | 4.787 | 4.495 | 3.418 | 2.445 | 4.526 | 8.739 | 3.077 | |
| Mar | 3.676 | 5.894 | 5.535 | 4.569 | 3.271 | 5.513 | 9.430 | 3.749 | |
| Apr | 3.993 | 6.876 | 6.458 | 5.653 | 4.062 | 6.629 | 9.966 | 4.508 | |
| May | 4.058 | 7.323 | 6.877 | 6.274 | 4.801 | 7.623 | 10.032 | 5.184 | |
| Jun | 3.479 | 6.648 | 6.243 | 6.047 | 4.715 | 8.354 | 8.329 | 5.681 | |
| Jul | 3.109 | 6.157 | 5.782 | 5.716 | 3.657 | 8.284 | 7.291 | 5.633 | |
| Aug | 2.855 | 5.690 | 5.344 | 5.289 | 3.160 | 7.862 | 6.775 | 5.346 | |
| Sep | 2.616 | 5.049 | 4.742 | 4.627 | 2.884 | 7.105 | 6.475 | 4.831 | |
| Oct | 2.842 | 4.794 | 4.502 | 4.013 | 2.767 | 5.938 | 7.803 | 4.038 | |
| Nov | 2.933 | 4.191 | 3.936 | 2.958 | 2.221 | 4.469 | 8.546 | 3.039 | |
| Dec | 2.755 | 3.609 | 3.389 | 2.252 | 1.715 | 3.631 | 8.015 | 2.469 | |
| La Cruz | Jan | 2.143 | 3.162 | 2.969 | 2.206 | 1.625 | 3.382 | 5.990 | 2.300 |
| Feb | 2.365 | 3.878 | 3.642 | 3.003 | 2.114 | 4.062 | 6.305 | 2.762 | |
| Mar | 2.624 | 4.732 | 4.444 | 3.956 | 2.93 | 4.987 | 6.715 | 3.391 | |
| Apr | 2.862 | 5.516 | 5.181 | 4.837 | 3.658 | 6.015 | 7.073 | 4.090 | |
| May | 2.909 | 5.863 | 5.506 | 5.318 | 4.264 | 7.001 | 7.019 | 4.761 | |
| Jun | 2.504 | 5.312 | 4.988 | 5.054 | 4.583 | 7.833 | 5.669 | 5.327 | |
| Jul | 2.415 | 5.154 | 4.840 | 4.951 | 3.884 | 7.996 | 5.358 | 5.437 | |
| Aug | 2.368 | 4.991 | 4.688 | 4.763 | 3.393 | 7.667 | 5.386 | 5.213 | |
| Sep | 2.221 | 4.50 | 4.226 | 4.224 | 3.036 | 6.949 | 5.307 | 4.726 | |
| Oct | 2.276 | 4.135 | 3.883 | 3.615 | 2.734 | 5.727 | 6.062 | 3.894 | |
| Nov | 2.252 | 3.539 | 3.324 | 2.695 | 2.089 | 4.258 | 6.490 | 2.895 | |
| Dec | 2.071 | 2.987 | 2.806 | 2.041 | 1.521 | 3.339 | 5.959 | 2.271 | |
Source: Authors.
For the remaining stations, similar seasonal variations were observed (table 4). EToH85 ranged from 2.533 to 7.494 mm day-1, and EToH75 from 2.379 to 7.038 mm day-1, both in Surutato and Sanalona II, respectively. EToPT values reached up to 6.338 mm day-1, while EToTE remained below 5.396 mm day-1. EToRo and EToMB continued to show the highest estimates, reaching up to 10.390 and 8.553 mm day-1, respectively. Notably, the Mocorito station lacked Eva data for the entire study period (1969-2018), limiting the use of EToTE at that site.
Table 4 Average daily reference evapotranspiration (ETo) estimated using seven alternative methods (EToalti) and the Penman-Monteith method with limited data (EToPM) for the period 1969-2018 (mm day-1; continuation).
| Weather station | Average reference evapotranspiration (mm day-1) 1969-2018 (mm day-1) | ||||||||
|---|---|---|---|---|---|---|---|---|---|
| Month | EToPM | EToH85 | EToH75 | EToPT | EToTE | EToMB | EToRo | EToOu | |
| Mocorito | Jan | 2.350 | 3.263 | 3.064 | 2.135 | No value value | 3.319 | 6.675 | 2.257 |
| Feb | 2.694 | 4.142 | 3.890 | 3.050 | No value | 4.137 | 7.285 | 2.813 | |
| Mar | 3.228 | 5.366 | 5.039 | 4.261 | No value | 5.261 | 8.366 | 3.577 | |
| Apr | 3.698 | 6.525 | 6.128 | 5.450 | No value | 6.509 | 9.258 | 4.426 | |
| May | 3.969 | 7.223 | 6.783 | 6.238 | No value | 7.69 | 9.756 | 5.229 | |
| Jun | 3.594 | 6.806 | 6.391 | 6.190 | No value | 8.553 | 8.551 | 5.816 | |
| Jul | 3.107 | 6.160 | 5.785 | 5.747 | No value | 8.422 | 7.213 | 5.727 | |
| Aug | 2.832 | 5.642 | 5.299 | 5.256 | No value | 7.888 | 6.673 | 5.364 | |
| Sep | 2.687 | 5.098 | 4.788 | 4.640 | No value | 7.066 | 6.705 | 4.805 | |
| Oct | 2.700 | 4.554 | 4.277 | 3.796 | No value | 5.685 | 7.440 | 3.866 | |
| Nov | 2.532 | 3.703 | 3.477 | 2.639 | No value | 4.123 | 7.407 | 2.804 | |
| Dec | 2.242 | 3.039 | 2.854 | 1.932 | No value | 3.214 | 6.537 | 2.186 | |
| Sanalona II | Jan | 2.925 | 3.728 | 3.501 | 2.246 | 1.928 | 3.417 | 7.996 | 2.323 |
| Feb | 3.273 | 4.665 | 4.381 | 3.233 | 2.598 | 4.219 | 8.590 | 2.869 | |
| Mar | 3.706 | 5.816 | 5.462 | 4.433 | 3.570 | 5.251 | 9.354 | 3.571 | |
| Apr | 4.103 | 6.934 | 6.512 | 5.622 | 4.542 | 6.455 | 10.136 | 4.389 | |
| May | 4.221 | 7.494 | 7.038 | 6.338 | 5.396 | 7.530 | 10.390 | 5.120 | |
| Jun | 3.64 | 6.872 | 6.453 | 6.185 | 5.339 | 8.329 | 8.786 | 5.663 | |
| Jul | 3.187 | 6.279 | 5.897 | 5.794 | 4.027 | 8.234 | 7.534 | 5.599 | |
| Aug | 2.925 | 5.790 | 5.437 | 5.345 | 3.629 | 7.790 | 7.011 | 5.297 | |
| Sep | 2.711 | 5.156 | 4.842 | 4.667 | 3.233 | 6.998 | 6.810 | 4.759 | |
| Oct | 2.967 | 4.863 | 4.567 | 3.942 | 2.945 | 5.686 | 8.210 | 3.866 | |
| Nov | 3.022 | 4.136 | 3.884 | 2.755 | 2.298 | 4.144 | 8.654 | 2.818 | |
| Dec | 2.796 | 3.49 | 3.277 | 2.034 | 1.767 | 3.312 | 7.892 | 2.252 | |
| Rosario | Jan | 2.442 | 3.601 | 3.382 | 2.546 | 1.924 | 3.904 | 7.030 | 2.655 |
| Feb | 2.796 | 4.468 | 4.196 | 3.421 | 2.439 | 4.669 | 7.635 | 3.175 | |
| Mar | 3.181 | 5.467 | 5.134 | 4.451 | 3.328 | 5.577 | 8.267 | 3.793 | |
| Apr | 3.465 | 6.320 | 5.935 | 5.391 | 4.058 | 6.602 | 8.687 | 4.490 | |
| May | 3.469 | 6.617 | 6.214 | 5.867 | 4.685 | 7.534 | 8.516 | 5.123 | |
| Jun | 2.987 | 5.978 | 5.614 | 5.566 | 4.676 | 8.137 | 6.973 | 5.533 | |
| Jul | 2.695 | 5.575 | 5.236 | 5.276 | 3.864 | 8.075 | 6.159 | 5.491 | |
| Aug | 2.497 | 5.200 | 4.884 | 4.927 | 3.525 | 7.703 | 5.755 | 5.238 | |
| Sep | 2.235 | 4.559 | 4.282 | 4.287 | 3.199 | 7.000 | 5.322 | 4.760 | |
| Oct | 2.339 | 4.273 | 4.013 | 3.776 | 2.870 | 5.991 | 6.189 | 4.074 | |
| Nov | 2.412 | 3.812 | 3.580 | 2.968 | 2.308 | 4.659 | 6.998 | 3.168 | |
| Dec | 2.300 | 3.362 | 3.157 | 2.372 | 1.816 | 3.847 | 6.809 | 2.616 | |
| Santa Cruz de Alaya | Jan | 2.374 | 3.403 | 3.196 | 2.329 | 2.394 | 3.645 | 6.847 | 2.479 |
| Feb | 2.638 | 4.205 | 3.949 | 3.201 | 3.031 | 4.433 | 7.239 | 3.014 | |
| Mar | 3.034 | 5.246 | 4.926 | 4.285 | 3.932 | 5.452 | 7.932 | 3.707 | |
| Apr | 3.425 | 6.253 | 5.872 | 5.335 | 4.789 | 6.551 | 8.615 | 4.455 | |
| May | 3.600 | 6.787 | 6.374 | 5.963 | 5.366 | 7.492 | 8.869 | 5.095 | |
| Jun | 3.242 | 6.35 | 5.963 | 5.819 | 5.185 | 8.146 | 7.714 | 5.539 | |
| Jul | 2.886 | 5.861 | 5.504 | 5.472 | 4.073 | 8.021 | 6.733 | 5.454 | |
| Aug | 2.619 | 5.367 | 5.040 | 5.024 | 3.634 | 7.587 | 6.170 | 5.159 | |
| Sep | 2.413 | 4.762 | 4.472 | 4.384 | 3.296 | 6.843 | 5.944 | 4.653 | |
| Oct | 2.660 | 4.555 | 4.278 | 3.825 | 3.205 | 5.732 | 7.295 | 3.898 | |
| Nov | 2.603 | 3.859 | 3.624 | 2.806 | 2.801 | 4.339 | 7.629 | 2.950 | |
| Dec | 2.324 | 3.229 | 3.032 | 2.144 | 2.259 | 3.537 | 6.874 | 2.405 | |
| Siqueros | Jan | 2.752 | 3.828 | 3.595 | 2.557 | 2.056 | 3.870 | 7.867 | 2.632 |
| Feb | 3.081 | 4.703 | 4.417 | 3.470 | 2.513 | 4.637 | 8.365 | 3.153 | |
| Mar | 3.463 | 5.728 | 5.380 | 4.541 | 3.232 | 5.557 | 8.950 | 3.779 | |
| Apr | 3.795 | 6.672 | 6.265 | 5.557 | 3.887 | 6.597 | 9.490 | 4.486 | |
| May | 3.829 | 7.048 | 6.619 | 6.108 | 4.450 | 7.531 | 9.462 | 5.121 | |
| Jun | 3.307 | 6.424 | 6.033 | 5.891 | 4.353 | 8.263 | 7.876 | 5.619 | |
| Jul | 3.044 | 6.066 | 5.697 | 5.649 | 3.500 | 8.243 | 7.124 | 5.605 | |
| Aug | 2.863 | 5.707 | 5.359 | 5.305 | 3.093 | 7.868 | 6.794 | 5.351 | |
| Sep | 2.631 | 5.087 | 4.777 | 4.664 | 2.883 | 7.131 | 6.504 | 4.849 | |
| Oct | 2.750 | 4.739 | 4.451 | 4.040 | 2.749 | 6.042 | 7.496 | 4.109 | |
| Nov | 2.788 | 4.143 | 3.890 | 3.053 | 2.313 | 4.632 | 8.163 | 3.150 | |
| Dec | 2.601 | 3.579 | 3.362 | 2.373 | 1.953 | 3.795 | 7.681 | 2.581 | |
| Surutato | Jan | 1.941 | 2.651 | 2.490 | 1.750 | 1.356 | 2.086 | 5.081 | 1.418 |
| Feb | 2.177 | 3.376 | 3.171 | 2.614 | 1.883 | 2.669 | 5.529 | 1.815 | |
| Mar | 2.472 | 4.303 | 4.041 | 3.688 | 2.613 | 3.462 | 6.137 | 2.354 | |
| Apr | 2.85 | 5.372 | 5.045 | 4.828 | 3.342 | 4.485 | 7.018 | 3.050 | |
| May | 3.035 | 6.066 | 5.697 | 5.565 | 3.982 | 5.471 | 7.620 | 3.721 | |
| Jun | 2.640 | 5.753 | 5.403 | 5.471 | 3.866 | 6.345 | 6.803 | 4.315 | |
| Jul | 2.137 | 5.022 | 4.716 | 4.972 | 2.802 | 6.227 | 5.403 | 4.234 | |
| Aug | 2.103 | 4.83 | 4.536 | 4.716 | 2.569 | 5.938 | 5.455 | 4.038 | |
| Sep | 2.050 | 4.392 | 4.125 | 4.113 | 2.269 | 5.246 | 5.587 | 3.567 | |
| Oct | 2.168 | 3.899 | 3.661 | 3.238 | 2.107 | 3.982 | 6.162 | 2.708 | |
| Nov | 2.149 | 3.131 | 2.940 | 2.151 | 1.610 | 2.722 | 5.992 | 1.851 | |
| Dec | 1.929 | 2.533 | 2.379 | 1.553 | 1.217 | 2.049 | 5.179 | 1.393 | |
Source: Authors
Performance metrics comparing the seven alternative methods (EToalti) with the Penman-Monteith method with limited data (EToPM)
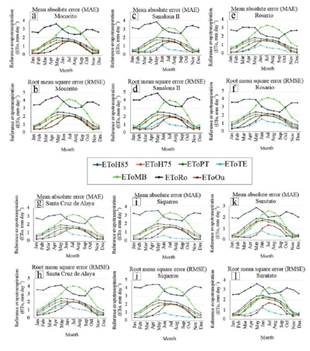
During summer (June-August), the EToTE method showed the best performance, with MAE ranging from 0.399 to 2.294 mm day-1 and RMSE from 0.636 to 3.094 mm day-1. In contrast, for winter (December-February), the best-performing method was EToOu, with MAE values between 0.244 and 0.386 mm day-1 and RMSE between 0.395 and 0.561 mm day-1. The least accurate method during summer was EToMB, with MAE and RMSE values exceeding 3.4 and 4.4 mm day-1, respectively. In winter, EToRo yielded the poorest results (Figure 2).
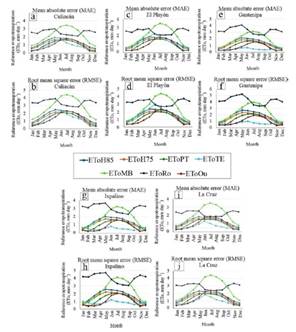
Source: Authors
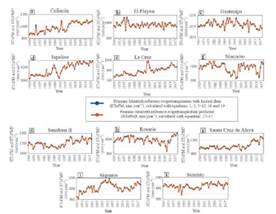
Figure 2 Mean absolute error (MAE) and root mean square error (RMSE) of the average daily reference evapotranspiration between seven alternative methods (EToalti) and the Penman-Monteith method with limited data (EToPM) (mm day-1).
In Figure 3, the EToalti that performed best for summer was EToTE, because MAE ranged from 0.360 mm day-1 (August in Siqueros; Figure 3i) to 1.238 mm day-1 (June in Santa Cruz de Alaya; Figure 3g) and RMSE ranged from 0.594 mm day-1 (August in Siqueros; Figure 3j) to 1.745 mm day-1 (June in Santa Cruz de Alaya; Figure 3h). For winter, the EToalti with the best performance was EToOu, since MAE ranged from 1.023 mm day-1 (June in Surutato; Figure 3k) to 1.752 mm day-1 (July in Rosario; Figure 3e) and RMSE ranged from 1.386 mm day-1 (June in Surutato; Figure 3l) to 2.110 mm day-1 (July in Mocorito; Figure 3b). The minimum performance in summer was recorded for EToMB, since MAE ranged from 2.254 mm day-1 (June in Surutato; Figure 3k) to 3.356 mm day-1 (July in Rosario; Figure 3e) and RMSE ranged from 2.948 mm day-1 (June in Surutato; Figure 3l) to 4.271 mm day-1 (July in Rosario; Figure 3f). The minimum performance in the winter season was for EToRo, since MAE ranged from 1.894 mm day-1 (February in Surutato; Figure 3k) to 3.691 mm day-1 (December in Santa Cruz de Alaya; Figure 3g) and RMSE ranged from 2.530 mm day-1 (January in Surutato; Figure 3l) to 4.086 mm day-1 (December in Sanalona II; Figure 3d).
Predictive models of Penman-Monteith annual cumulative reference evapotranspiration with limited data (EToPMP)
Eleven predictive models (Equations 16-26; table 5) were developed to estimate annual EToPMP, five of which were linear and six nonlinear. The linear models were fitted to stations such as Culiacán and El Playón, while nonlinear models were applied to sites like Ixpalino and Surutato. EToPT was the only independent variable present in all equations, indicating its strong predictive power. Nonlinear models showed better fit in all cases, incorporating squared terms for enhanced accuracy.
Table 5 EToPMP predictive equations (dimensionless)
|
|
(16) |
|
|
(17) |
|
|
(18) |
|
|
(19) |
|
|
(20) |
|
|
(21) |
|
|
(22) |
|
|
(23) |
|
|
(24) |
|
|
(25) |
|
|
(26) |
Source: Authors
Predictive models of Penman-Monteith annual cumulative reference evapotranspiration with limited data (EToPMP)
Normality of residuals
Normality of residuals was assessed using the Shapiro-Wilk test (table 6). The W values ranged from 0.891 (Ixpalino) to 0.983 (Mocorito). Residuals were non-normal (p < 0.05) in six of the eleven stations. Despite this, all models demonstrated high correlation coefficients. For linear regressions, Pearson’s r ranged from 0.997 to 0.999. Nonlinear models showed a perfect Spearman correlation (r = 0.999), confirming strong model fit. Residual means were close to zero in all cases, confirming homogeneity.
Table 6 Normality of residuals (dimensionless)
| Weather station | Shapiro-Wilk (W) | P(normal) |
|---|---|---|
| Culiacán | 0.969 | 0.207 |
| EL Playón | 0.976 | 0.411 |
| Guatenipa | 0.975 | 0.371 |
| Ixpalino | 0.891 | 0.001 |
| La Cruz | 0.905 | 0.001 |
| Mocorito | 0.983 | 0.662 |
| Sanalona II | 0.903 | 0.001 |
| Rosario | 0.940 | 0.013 |
| Santa Cruz de Alaya | 0.940 | 0.013 |
| Siqueros | 0.981 | 0.593 |
| Surutato | 0.952 | 0.042 |
Source: Authors
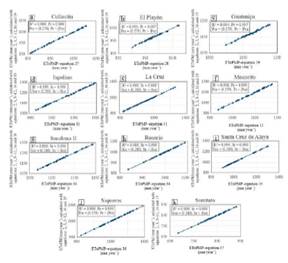
Linearity and fit
All linear regressions showed linearity ((Pr(> 0.279) and all non-linear regressions showed good fit ((Sr( > 0.280). Specifically, the linear regressions yielded correlations from Pr = 0.997 in El Playón (Figure 4b) and Guatenipa (Figure 4c) to Pr = 0.999 in Culiacán (Figure 4a), Mocorito (Figure 4f) and Siqueros (Figure 4j). All non-linear regressions recorded a value of Sr = 0.999 [Ixpalino (Figure 4d), La Cruz (Figure 4e), Sanalona II (Figure 4g), Rosario (Figure 4h), Santa Cruz de Alaya (Figure 4i) and Surutato (Figure 4k)].
Homogeneity of residuals
Nearly all residual averages (linear and non-linear regressions) were null (Figure 5). Specifically, residual averages ranged from -0.003 mm year-1 (Rosario; Figure 5h) to 0.001 mm year-1 (La Cruz and Surutato; Figures 5e and 5k, respectively). The completely homogeneous residuals (0.000 mm year-1) were recorded in Culiacán, El Playón, Guatenipa, Ixpalino, Mocorito, Sanalona II, Santa Cruz de Alaya and Siqueros (Figures 5a-5d, 5f, 5g, 5i and 5j; respectively).
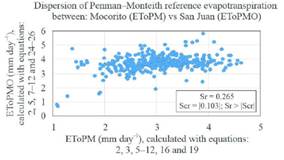
Spearman correlation (Sr) between daily Penman-Monteith reference evapotranspiration and limited data in Mocorito (EToPM), and observed data in San Juan (EToPMO)
A Spearman correlation analysis was performed between daily EToPM from Mocorito and observed EToPMO data from San Juan (Figure 6). After verifying that only EToPM data were normally distributed (W = 0.996; p = 0.436), a significant correlation was found (Sr = 0.265), exceeding the critical threshold (|Scr| = 0.103; n = 366).
Discussion
The results in Table 2 are similar to those reported by Flores et al. (2012), as these authors indicate that Tmean in Sinaloa ranges mostly from 24°C to 26°C, where areas with higher elevation, such as Surutato (1460 masl), record ranges from 14°C to 20°C.
The variation in Eva observed in this study (Table 2) is consistent with the results reported by Velasco & Pimentel (2010), furthermore these authors indicate that the average monthly Eva values for Sinaloa ranged from 98.720 mm month-1 in December (3.185 mm day-1) to 267.830 mm month-1 in May (8.640 mm day−1). In addition, Galindo et al. (1991) and Velasco & Pimentel (2010) also agree that the highest magnitudes of Eva in Sinaloa occur in the spring (March-May)-summer agricultural cycle.
EToTE estimates obtained in this study (Tables 3 and 4) are consistent with the results reported by Velasco & Pimentel (2010), moreover these authors indicate that the average monthly magnitudes of EToTE in Sinaloa ranged from 89.840 mm month-1 in December (2.898 mm day-1) to 222.300 mm month-1 in May (7.171 mm day-1).
The variation in EToPM (Tables 3 and 4) was also consistent with that reported by López et al. (2024), in agreement with these authors, EToPM in Culiacán for the year 2020 ranged from 1.600 mm day-1 in February to 10.300 mm day-1 in September. In addition to the above, the highest magnitudes of EToalti and EToPM (Tables 3 and 4) are consistent with Llanes (2023), who states that the highest percentages of accumulated annual EToH85, for the period 1969-2018 and for the stations Culiacán (60.16%), El Varejonal (60.780%), Ixpalino (59.650%), La Concha (59.250%), Rosario (59.500%), Sanalona II (60.280%), and Santa Cruz de Alaya (59.820%) occur in the spring-summer agricultural cycle.
In general, EToTE showed better performance for summer than EToPT (Figures 2 and 3). Considering the comparative limitations between the climate conditions between Mexico and India, Raja et al. (2024) did not analyze EToTE, these authors point out that EToPT records better performance than EToH85, furthermore they state that in a region of India the RMSE ranged from 0.770 mm day-1 (EToH85) to 3.120 mm day-1 (EToPT). This difference may be explained by the greater stability of radiation-based models under the specific climatic conditions of Sinaloa (González et al., 2008; Valdes et al., 2013). On the other hand, Ndule & Ranjan (2021) calculated the performances for three EToalti (EToPT, EToH85 and EToRo) for Manitoba, Canada, finding the following performances, respectively: MAE = 0.362 mm day-1 and RMSE = 0.516 mm day−1, MAE = 0.514 mm day-1 and RMSE = 0.651 mm day-1, and MAE = 0.534 mm day-1 and RMSE = 0.701 mm day-1. These findings are in agreement with Ndule & Ranjan (2021), since in winter, EToRo recorded the lowest performances and EToPT recorded higher performance than EToH85 (Figures 2 and 3). Another investigation that is consistent with the findings of this study is that of Santiago et al. (2012), because these authors point out that in the state of Mexico, the average annual RMSE for the period 2003-2008 ranged from 0.442 mm day-1 (EToPT for 2008) to 0.873 mm day-1 (EToH85 in 2007). Vásquez et al. (2011) also agree on two aspects: EToOu is the model with the best performance (MAE = 1.100 mm day-1 and RMSE = 1.440 mm day-1).
Azua et al. (2020) note that when generating predictions of EToPMP, specification errors should always be minimized by validating the models (Llanes et al., 2022). Residuals were evaluated for normality and linearity. Non-normal residuals were analyzed using non-linear regression methods (Morantes et al., 2019; Llanes et al., 2024). In all models where the residuals did not present normality (Table 5; Equations 19, 20, 22-24 and 26), Model fit was confirmed when Sr exceeded the critical Spearman correlation value (|Scr|) (Figures 4d, 4e, 4g-4i and 4k; Llanes et al., 2022). The 11 models proposed in this study recorded homogeneity in the residuals (Figure 5; Carrasquilla et al., 2016; Llanes et al., 2024; O.C.R., 2024).
These validations support the reliability for the use of the predictive models of EToPMP, particularly when complete climate series are not available (Sentelhas et al., 2010; Fang et al., 2024; CONAGUA-SMN, 2024a), which supports their applicability in regions with incomplete climatological records (López et al., 2024).
Conclusions
Despite Sinaloa being an eminently agricultural state, in many cases complete climate series are not available, which makes the use of EToalti and the modeling of EToPMP an effective alternative for estimating ETo under incomplete data conditions. In general, EToTE is the best performing EToalti for summer and autumn (September-November), and EToOu is the best performing EToalti for winter. As a result, and due to poorer fit in summer, the use of EToMB and EToRo is not recommended for data from Sinaloa weather stations. This study developed 11 predictive models of EToPMP, where seven EToalti serve as explanatory variables. EToPT was the only method that contributed to all predictive models. The use of EToPMP can help minimize errors of overestimation and underestimation of crop water needs, which in turn can ensure the hydro-agricultural needs of Sinaloa and Mexico. This is particularly relevant under anomalously dry conditions, when irrigation scheduling is often inadequate, affecting both the availability and efficiency of water use in crops. Therefore, the application of the proposed EToPMP models represents a valuable tool for improving irrigation practices and water management in regions with incomplete climatic records.
Future lines of research
Future research should consider site-specific measurement of solar radiation (SR) at each weather station, as this variable may enhance the evaluation and differentiation of model performance.
Given that EToPT was applied across all 11 weather stations, it is advisable to conduct individual calibrations for this method, aiming to enable it to approximate the Penman-Monteith standard more accurately.
Although this study applied the most widely used alternative ETo methods, exploring additional methods could further improve the models’ predictive performance. Moreover, future studies are encouraged to incorporate machine learning techniques-such as multivariate adaptive regression splines, gradient boosting, classification and regression trees, and random forests-to potentially enhance the models' explanatory power (R²).
Finally, establishing an agricultural research station in the study region is recommended, allowing direct observation of all input variables of the Penman-Monteith equation, which would enable comprehensive comparisons between observed EToPM and its predictive alternatives.

