


 nueva página del texto (beta)
 Inglés (pdf)
 Artículo en XML
 Referencias del artículo
 Enviar artículo por email
 Citado por SciELO
  Similares en
SciELO
Similares en
SciELO 
 Permalink
1. Introduction
Boron is a micronutrient that fulfills distinct functions in plants such as sugar and starch metabolism, nucleic acid and protein metabolism, root growth, flower formation, as well as participating in the stability of the cell membrane of the plant (Barker, & Pilbeam, 2007; Princi et al., 2016; Shireen et al., 2018). However, it can become toxic and affect the quality of the crops depending on exposure time, soil conditions, the sensitivity of the crop and the use of irrigation water (Landi et al., 2019). Likewise, the type of plant and the characteristics of the soil will affect the concentration of boron in the water (Alharati et al., 2017; Kabay et al., 2015). Boron toxicity manifests itself with yellowish chlorosis on the tip or edge of the leaves at the beginning and then ends in necrosis (Brdar-Jokanovi ć, 2020)
For the determination of the concentration of boron, one of the most used methods is the spectrophotometric method based on the reaction of boron with different reagents such as curcumin, carmine, and azomethine-H, forming a colorimetric complex (Merdivan et al., 2012; Marczenko, & Balcerzack, 2000).
Diverse studies have investigated new ways of detecting different ions on-site, such as boron and arsenic (Ghasemidehkordi et al., 2018), ferrous ions (Choodum et al., 2019), cobalt, copper, lead (Zhang et al., 2020), fluoride ions (Chatterjee et al., 2020) and cyanide (Li et al., 2019). Others have developed kits based on colorimetric reactions for the rapid detection of compounds (Faham, 2019; Shariati-Rad & Fattahi, 2020).
For the on-site detection of boron, a microplate method with azomethine-H in tissues was used (Sabally et al., 2017), as well as solenoid pumps and a photometric sensor based on the flow with spectrophotometric detection to detect boron in water with azomethine-H for samples of eye drops, drinking water and seawater (González et al., 2017). Analytical sensors were made based on paper with curcumin nanoparticles in conjunction with information technology equipment to quantify boron in situ in water samples (Pena-Pereira et al., 2020). Curcumin nanoparticles contained in a cassava starch film were used in conjunction with a digital image colorimetry (DIC) method (Boonkanon et al., 2020).
Arequipa, Peru has the presence of radiant sun throughout the year which has been used for other studies (Ramírez- Revilla, 2021; Ramírez- Revilla et al., 2023). Due to this factor and the climate, agriculture is one of the most important economic activities in the region. Farmers in the area use the surrounding rivers as a source of water to irrigate their crops, but these rivers sometimes exceed the environmental quality standards of 1 mg/ L for boron (Ambiente, 2017), coastal areas where boron concentrations tend to be high. Research shows elevated concentrations of boron in river water (Bolan et al., 2023). Given this, it is important to monitor the boron concentrations in irrigation water periodically and make it available to farmers in the area.
The main objective of this study, then, is to develop a fast, simple, and economical kit without using sophisticated equipment for the in situ determination of boron concentrations in irrigation water using the colorimetric method, based on the reaction with azomethine-H.
2. Materials and methods
2.1. Reagents
All reagents used were ACS grade or equivalent, from Sigma Aldrich (St. Louis, MO, USA) and Merck (Darmstadt, Germany). The water used was of ultrapure quality for all solutions, ammonium acetate, disodium salt of ethylenediaminetetraacetic acid, boric acid, glacial acetic acid, azomethine-H, and ascorbic acid were used. Solutions for boron determination were prepared according to the referenced standard methods.
2.2. Equipment and software
Spectrophotometric measurements were performed on a Genesys 150 - Thermo Scientific UV-VIS spectrophotometer controlled by VISIONlite software, OHAUS calibrated pH meter, and Simplicity Water UV ultrapure water equipment were all used. The photographs were taken in a closed environment with fluorescent lighting in a structure consisting of a base, a side and front wall made of trupan. A Panasonic Lumix FZ2000 camera and a Godox MS200 flash coupled to a Godox 120 cm diameter diffuser were used.
2.3. Required procedures
2.3.1. Design and printing of the color scale
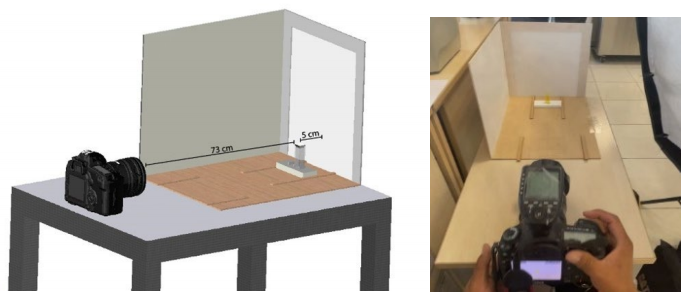
The dimensions of the trupan structure measured 40 x 30 x 30 cm, using 3 mm thick sheets. The side panel was painted matt white. The front panel was cut in the shape of an inverted U measuring 30 x 30 cm with a 3 cm edging, using backlight paper. A Godox AD 600 flash and a Canon EOS 5D Mark III camera were used. The cells were mounted 5 cm from the front panel and 73 cm from the chamber. The photographs taken (45 in total) were downloaded in 5472 x 3648 resolution and in RAW/JPEG format, as shown in Figure 1. At the time of conducting the tests, a 120 cm diameter diffuser coupled to the Godox AD 600 flash was used to illuminate the platform, and one photo was selected for each level of concentration (9 photos). Adobe Photoshop Lightroom software was used to process the photos and adjust the balance of whiteness. The color format of the photos was sRGB.
2.3.2. Determination of boron in water using azomethine-H
A 50 ppm boron stock solution, a 0.9 % azomethine-H solution with 2 % ascorbic acid (which was kept refrigerated) and a pH 5.9 buffer solution of ammonium acetate (2 M) with disodium salt from ethylenediaminetetraacetic acid were prepared, adding glacial acetic acid (2 M) to adjust the pH to 5.9.
From the stock solution, a calibration curve of 0.5, 1, 2, 3, 4, 5, 6, 7 and 8 mg/L of boron was prepared. In 15 mL Falcon tubes, 4 mL of each of the standard solutions were added, 4 mL of buffer solution and 2 mL of the azomethine-H solution were added, mixed and homogenized. After 30 minutes of reaction, it was read at a wavelength of 420 nm in the UV-Vis spectrophotometer. The analyses were conducted in triplicate and the same sample trays were mounted on the structure designed to take the corresponding photographs.
For the evaluation of the linearity of the method, the t test was used to verify the correlation between the concentration and absorbance, using a confidence level of 95 %. In addition, the limit of detection (LOD) and the limit of quantification were determined (LOQ) (Ortiz-Romero & Ramírez-Revilla, 2018).
2.3.3. Determination of boron using the colorimetric scale
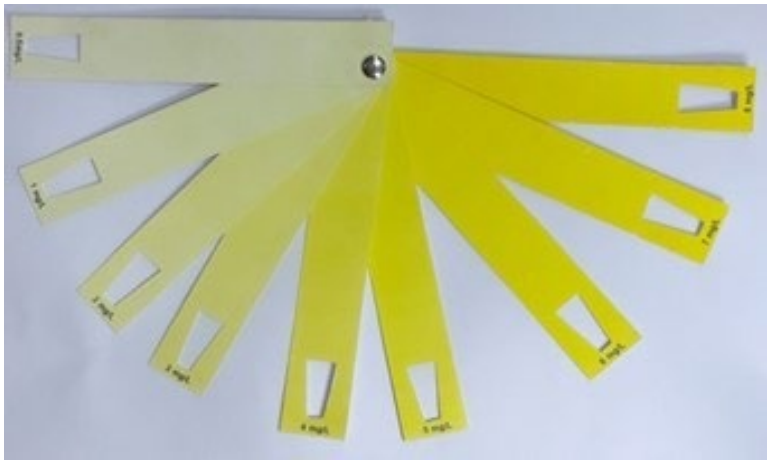
Once the calibration curve was determined and the photographs for each point obtained, a fan-shaped colorimetric scale was printed. To verify the proper functioning of the color scale, samples contaminated with boron at different concentrations of 2, 4 and 6 mg/L respectively were analyzed in triplicate. Following the procedure described for color formation with azomethine-H, the samples were measured using the colorimetric scale and the spectrophotometric method.
2.3.4. Design and evaluation of the colorimetric kit
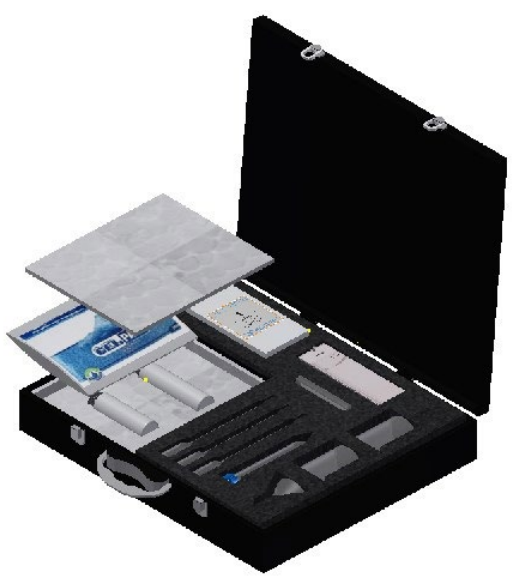
The design was created in Autodesk Inventor professional, the kit consisting of a plastic case made up of two divisions, one for materials: 5 mL pipettes (3), 3 mL Pasteur Pipettes (3), 15 mL Falcon tubes, 2 beakers of 100 mL, 1 funnel of 250 mm radius, all in plastic material, GE Whatman filter paper and colorimetric scale for boron of 0.5-8 mg/L, and another for solutions: 2% ascorbic acid (100 mL), azomethine-H 0.9% (100 mL), pH 5.9 buffer solution (100 mL).
As an additional contribution to the work, an economic evaluation was conducted for the manufacture of the proposed colorimetric kit, reviewing the initial investment, costs, cash flow to determine income and expenses, calculations of the VAN, TIR and the B/C cost-benefit.
3. Results and discussion
3.1. Preparation of the colorimetric scale
For the elaboration of the structure used in the photographic taking of the samples, the structure proposed by Mohamed and Shalaby (2019), was followed, but modified using a translucent material called backlight on an inverted U to avoid reflection of the light which could change the color in the photograph. The same authors also conducted tests with other equipment to take pictures, such as a smartphone and a scanner, but after the tests were conducted, they decided to use a 16.0 MP camera to obtain their results (Mohamed & Shallaby, 2019). It should be noted that the camera used in this research work has 22.3 MP. All materials used to build the structure were purchased locally.
3.2. Calibration curve
9 samples were made with boron at concentrations of 0.5, 1, 2, 3, 4, 5, 6, 7 and 8 mg/L. Color complex formation was generated in falcon test tubes. The average reaction time for the color complex to be generated was 30 minutes, a shorter time than that found by Mohammed and Shallaby (2019), who used a different method for the preparation of the solutions.
The calibration curve was conducted through a triplicate measurement in the UV-VIS Genesys 150 spectrophotometer of the Thermo Scientific brand, at 420 nm of wavelength. The curve in question is shown in Figure 2, where the data of the equation of the line y = 0.3262x - 0.1005 are observed. A correlation coefficient of 0.9984 and a linear absorbance range between 0.1270 ± 0.0082 and 2.5213 ± 0.0040 were obtained.
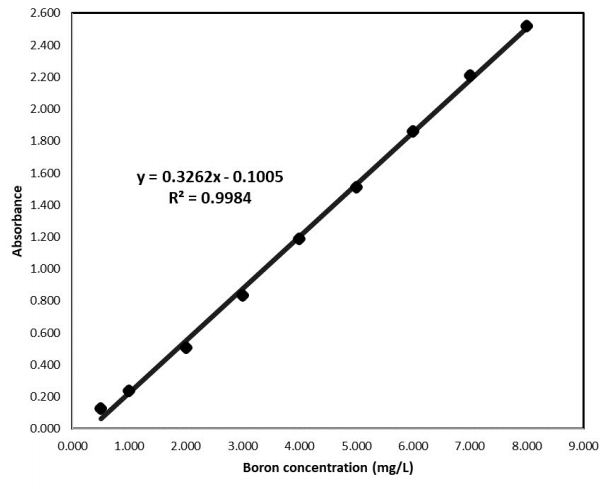
Other authors such as Ramirez-Revilla and Alvaro (2012) and Mohammed et al. (2014) found a correlation coefficient of 0.9996 and 0.9998, respectively; however, the coefficient found of 0.9984, is close to 1, indicating good linearity (Ramirez-Revilla & Alvaro 2012; Mohammed et al., 2014)
To obtain the detection and quantification limit, we created a graph of concentration vs. standard deviation, obtaining y = -4E-05x + 0.005 as the equation of the line. With said data the detection and quantification limit were determined using the standard deviation of the blank (Sblank = 0.0050, Yblank = 0.1005, b = 0.3262). The detection and quantification limit were calculated (Ortiz Romero & Ramírez Revilla , 2018), as being 0.1180 and 0.1538 mg/L, respectively. Mohammed et al. (2014), found a detection coefficient of 0.0514 mg/L but used only 7 points to construct the calibration curve (Mohammed et al., 2014). Palma et al. (2016), using the ICP-OES method, and found a detection and quantification limit of 0.025 mg/L and 0.124 mg/L, respectively (Palma et al., 2016).
Other authors such as Ramirez-Revilla and Alvaro (2012) and Mohammed et al. (2014) found a correlation coefficient of 0.9996 and 0.9998, respectively; however, the coefficient found of 0.9984, is close to 1, indicating good linearity (Ramirez-Revilla & Alvaro 2012; Mohammed et al., 2014)
To obtain the detection and quantification limit, we created a graph of concentration vs. standard deviation, obtaining y = -4E-05x + 0.005 as the equation of the line. With said data the detection and quantification limit were determined using the standard deviation of the blank (Sblank = 0.0050, Yblank = 0.1005, b = 0.3262). The detection and quantification limit were calculated (Ortiz Romero & Ramírez Revilla, 2018), as being 0.1180 and 0.1538 mg/L, respectively. Mohammed et al. (2014), found a detection coefficient of 0.0514 mg/L but used only 7 points to construct the calibration curve (Mohammed et al., 2014). Palma et al. (2016), using the ICP-OES method, and found a detection and quantification limit of 0.025 mg/L and 0.124 mg/L, respectively (Palma et al., 2016).
3.3. Photographic capture of the colored complex
After carrying out the corresponding tests on the structure using the Canon EOS 5D Mark III camera and the Godox AD 600 flash attached to a diffuser and at a lateral distance of 29 cm as shown in Figure 1, it was determined that the camera should be configured with the following parameters: ISO at 320, aperture at 7.1, white balance in flash, in manual mode and with a shooting speed at 1/400.
Unlike the methodology proposed by Mohamed and Shalaby (2019), the camera was located at 73 cm from the quartz cell, because there was no macro lens that allowed the camera to be brought closer to 5cm as a distance as they suggested. Nevertheless, high-quality photos were obtained using the camera's own zoom, which was 22.3 MP, a value greater than that used by Mohamed and Shallaby, which was 16.0 MP (Mohamed & Shallaby, 2019). Other authors such as Lin et al. (2018), used a Nikon D7000 digital camera, but did not use a structure. They simply took the photos on a white surface and observed that the color proceeded to change in the photographs (Lin et al., 2018).
3.4. Design of the colorimetric scale
The color scale was designed in the form of a fan for easy manipulation and to occupy a small space compared to other color scales. Additionally, the scale in question included a trapezoid-shaped hole (Figure 3) in each of the concentrations to insert the transparent container containing the sample to be analyzed in the back of the hole and thus compare and better facilitate the view of the color in the sample. Some authors such as Ren et al. (2020), developed a simple rectangular colored card where all colors were observed to indicate the presence of iodide in human urine (Ren et al., 2020). Colors were displayed in vertical rectangles next to each other with a slight gap. Something similar was done by Lin et al. (2018) to determine benzoyl peroxide, but with the difference that the colors were shown in a square. Mendez-Cid et al. (2017) designed a scale to quantify oxidation in edible animal fats by showing the colors successively without leaving a space between them, but to differentiate the color tones, they were highlighted with a black border (Mendez-Cid et al., 2017). In all the previously mentioned scales, the value that each color tone represented was specified, as in the proposed scale that is found in mg/L.
3.5. Analysis of water samples using the colorimetric scale
To verify the proper functioning of the fan-shaped colorimetric scale, once it had been printed, samples contaminated with boron at different concentrations of 2, 4 and 6 mg/L were analyzed in triplicate, following the procedure described for the formation of color with Azomethine-H. The samples were then compared using the colorimetric scale and spectrophotometric method. A triplicate measurement of each sample of water contaminated with boron was conducted, finding a concentration of 1.9871, 3.9641 and 5.9786 mg/L using the spectrophotometer and using the scale values of 2, 4 and 6 mg/L, respectively.
3.6. Design of the colorimetric kit
The 3D design was developed in Adobe Autodesk Inventor, clearly identifying the materials to be used. The colorimetric kit has dimensions of 35.5 cm in length, 27.5 cm width and is 10.0 cm thick. It consists of a briefcase that contains all the instruments and solutions necessary to quantify the concentration of boron in water outdoors.
The kit has an instruction manual so that people can generate and interpret the colorimetric reaction and thus determine the boron concentration in water samples. In the manual, azomethine-H solution with ascorbic acid is referred to as Solution A and buffer solution as B, to easily identify them and mix them according to the instructions (see Figure 4).
The water samples to be analyzed must be taken directly from the irrigation canal or source to be determined. If the sample is cloudy, the suspended particles must be allowed to settle at the bottom of the container. Then filter the water using the funnel and the filter paper. To generate the color complex and determine the boron concentration, only 4 mL of the water sample that went through the sedimentation and filtering process is required. Add 4 mL of Solution B and 2 mL of Solution A to the conical tube, mix and wait 30 minutes for the color complex to form. Finally, transfer the sample to a glass tube to determine the boron concentration using the printed colorimetric scale.
3.7. Costs analysis
As a further contribution to the work, an evaluation of costs evaluation was conducted, where the opening of a company dedicated to the elaboration and sale of the colorimetric kit is considered, and the potential demand analyzed. Since the city of Arequipa is an agricultural area, with limited potential demand, an average projection was made for 10 years from 2023. For the present study, it was taken as an assumption that 40% of the demand would be satisfied. Taking into consideration a profit of 15%, the general sales tax (IGV) as 18%, and the cost of the kit of $ 35.06, a sale price of $ 47.70 was calculated. The proposed kit will initially allow 25 tests to be conducted. That said, however, azomethine-H solutions and buffer solutions can be readily purchased independently for additional testing if required.
There are kits on the market that allow boron to be determined in the field and one of them is Hanna instruments (model HI 38074), which allows 100 tests to be conducted at a price of $ 259.60, with a price per test of $ 2.60 which is greater than that of the proposed kit.
On the other hand, conventional methods to determine boron in water, such as spectrophotometric methods, are conducted in laboratories and with special equipment. This involves a waiting time for results, in addition to expenses for the transfer of the samples to the laboratory, from which the results of the analysis are delivered between 5 and 10 business days without considering the sample transfer time. However, the proposed kit allows results to be obtained in approximately 30 minutes. Furthermore, while the price of conducting the analysis in the laboratories ranges between $ 22.78 and $ 37.79 for a water sample, the cost per sample of the kit is lower ($ 1.91).
4. Conclusions
For the manufacture of the colorimetric scale, the color reaction between boron and azomethine-H was used as a basis, the fan-shaped colorimetric scale was designed and manufactured, and a calibration curve from 0.5 to 8 mg/L of boron with 0.9984 as a coefficient of determination was used with 0.1605 and 0.1232 mg/L as limits of quantification and detection, respectively.
The color complex of azomethine-H and boron was used to take cascade photographs of the color complex at those concentrations and elaborate the color scale that was laser printed on high-grammage coated paper. The colorimetric kit that was designed by Autodesk Inventor professional will be used to determine boron in situ in irrigation water samples. The results obtained by the kit were compared with the spectrophotometric method, finding concentrations of 2, 4 and 6 mg/L, compared with the spectrophotometric method, which had concentrations of 1.9871, 3.9641 and 5.9786 mg/L.
This colorimetric kit was designed with all the necessary materials and solutions to conduct field analysis of water intended for agricultural irrigation quickly and easily up to a total of 25 times, which makes it an alternative to conventional spectrophotometric methods which are more expensive and do not allow for on-site analysis. The costs of manufacturing the colorimetric kit were evaluated considering the price of the kit to be $ 47.70, finding an adequate VAN and IRR, as well as a B/C of 1.42, which indicates that the manufacturing and commercialization of the proposed prototype would generate profitable income.

