


 nueva página del texto (beta)
 Inglés (pdf)
 Artículo en XML
 Referencias del artículo
 Enviar artículo por email
 Citado por SciELO
  Similares en
SciELO
Similares en
SciELO 
 Permalink
Introduction
Toxic metal contamination is a problem that has been increasing, mainly due to human activities. Among the principal sources of contamination are mining, metallurgy, agriculture, motor vehicles, and the natural contribution of certain aquifers (Covarrubias and Peña-Cabriales, 2017).
Heavy metals are those metallic chemical elements that have a weight greater than 5 g/cm3 and are poisonous at low concentrations (Collin et al., 2022). Lead (Pb) is a highly toxic metal, mainly present in the environment due to anthropogenic activities such as industry, mining, and smelting (Prieto-Méndez et al., 2009), with a reported median lethal dose for humans of 400 mg/kg (Villalón-López et al., 2019). Due to the high toxicity of lead, some US federal agencies have issued standard values in different sources. The Center for Disease Control and Prevention (CDC) sets the standard value in blood at 5 μg/dL, the Environmental Protection Agency (EPA) at 15 μg/m3 in air, and 15 μg/dL in drinking water (Villalón-López et al., 2019).
The high levels of toxic metals such as lead, nickel, cadmium, and manganese, among others, can be dangerous due to their non-biodegradable nature, the toxicity they exert on different crops, and their bioavailability tend to accumulate in soils and waters of great importance for the agriculture and other activities (Ortiz-Cano et al., 2009). Plant species that concentrate more than 1000 mg of Pb kg-1 of matter are considered lead accumulators (Rodriguez-Ortíz et al., 2006). The bioremediation capacity of plants depends on the species, which have been studied in bodies of water and soil contaminated with lead, since can adsorb large amounts of this metal (Tetraena qataranse 2784 mg/kg; Conyza canadensis 1.308 ± 0.043 mg/kg (roots) and 8.517 ± 0.136 mg/kg (shoots); Helianthus annus 7.76 mg/kg) (Collin et al., 2022).
Although lead is not an essential element for plants, it is easily absorbed and concentrated in different parts of the plant. The absorption of Pb in plants is regulated by pH, the size of the particles; and the cation exchange capacity of the soil, as well as by the exudation of the roots and other physicochemical parameters.
The phases of the process by which plants incorporate and accumulate heavy metals are the following (Navarro-Aviñó, 2007):
Phase I. It involves the transport of heavy metals into the plant and then into the cell. The root is the main entry tissue for metals, which arrive by diffusion in the medium, by mass flow or by cation exchange. The root has negative charges on its cells, due to the presence of carboxyl groups, which interact with the positive charges of the heavy metals, creating a dynamic equilibrium that facilitates entry into the cell, either by apoplastic or symplastic means (Navarro-Aviño, 2007).
Phase II. Once inside the plant, the metal species are sequestered or complexed by binding to specific ligands. Among the chelators produced by plants are organic acids (citric, oxalic and malic acids), some amino acids (histidine and cysteine) and two classes of peptides: phytochelatins and metallothioneins. Phytochelatins are high-affinity ligands that have glutathione as a substrate. They are basically made up of 3 amino acids: glutamic acid, cysteine and glycine, linked by peptide bonds.
Metallothioneins are polypeptides of about 70 - 75 amino acids with a high content of cysteine, an amino acid capable of forming complexes with cations through the sulfhydryl group. They have a marked affinity for the ionic forms of Zn, Cd, Hg and Cu.
Phase III. It involves compartmentalization and detoxification, a process by which the ligand-metal complex is retained in the vacuole.
The excess of Pb causes a series of toxicity symptoms in plants, stunted growth, chlorosis, and blackening of the root system. Pb inhibits photosynthesis, alters mineral nutrition and water balance, changes hormonal status, and affects the structure and permeability of the membrane; however, remediation of Pb-contaminated soils using phytoremediation and rhizofiltration technologies has a greater potential to clean up soils contaminated with Pb (Sharma et al., 2005).
Lead is absorbed through the lungs and from the gastrointestinal tract. The mechanism of action is performed by binding to sulfhydryl groups and toxic to zinc-dependent enzymes. Diagnosis is difficult because the symptoms are multisystemic: asthenia, abdominal pain, irritability, nausea, vomiting, weight loss, headache, anemia, and peripheral neuropathy, among others (Infantas, 2005).
A bioindicator can be define as an organism, part of an organism, or a community of organisms, used to obtain information about the quality of an environment. These show the property of responding to the variation of particular abiotic or biotic factor of the environment, in such a way that the response is reflected in the change of the characteristics in one or more variables of the organism, which are known as bioindicator variables (Garbisu et al., 2007).
Bioindicators are also known as highly sensitive organisms to their environment, with a certain tolerance regarding one or more environmental factors (Gagan et al., 2017). They change aspects of their form, can disappear or, on the contrary, can prosper despite the contamination of their environment. Indicator organisms can show macro or microscopic morphological changes, or accumulate the contaminant in the tissues when exposed to higher concentrations (Graciano et al., 2002).
The epiphytic bromeliads to which Bromelia karatas belongs, are sensitive to variations in light, water, and temperature, presenting morphological changes generated by climate change (Cash-Perez et al., 2014). Bromelia karatas, has a very short stem, homorrhice root, lanceolate leaf, and rosettes with branches on the stem, with limited growth, bearers of flowers, and elongated, bittersweet and juicy fruit (Montes-Rojas et al., 2014). Bromelia karatas, in addition to its sensitivity as a bioindicator, has potential use in industry and food, since it generates antioxidant metabolites (Moyano et al., 2012).
Bromelia karatas grow in Mexico (Campeche, Chiapas, Guerrero, Jalisco, Michoacán, Nayarit, Oaxaca, Querétaro, Sinaloa, San Luis Potosí, Veracruz and Yucatán), Central America (Belize, Guatemala and Panama), Les Antilles and northern South America (Espejo-Serna et al., 2005). Due to their tropical cradle, bromeliads are exotic in Northern countries, so they are among the most valued ornamental plants in the world along with orchids, Araceae and heliconias, among others (Miranda-Jiménez et al., 2007).
Throughout history, bromeliads are monocotyledons that were consumed by natives since pre-Hispanic times. The use as food includes from the complete fruit to a part of the plant, consumed as vegetables or in prepared drinks (fermented or not). Currently, they are employed in Latin America more as vegetables than as fruits (Hornung-Leoni et al., 2011). An alternative to contribute to the solution of these problems is the use of plant species for the removal and accumulation of contaminating agents, for which this research focused on the evaluation of the capacity of Bromelia karatas to remove Pb from the soil, being used as a bioindicator of these pollutants in the environment.
Material and methods
Obtaining the experimental units
The experimental unit used for this investigation was the Bromelia karatas; fruits were collected to obtain seeds and later germinate them, thus obtaining the plants to be used. With the support of the Institute of Natural History (INH), the fruits were collected in the municipality of San Fernando, Chiapas, Mexico, at coordinates LN 16° 48’ 12’’ and LW 93° 12’ 01’’, altitude 880 masl. The fruit was dissected and pulped to obtain the seeds, which were washed until the pulp residues were removed, followed by drying at room temperature for 10 days to later be germinated.
Seeds were sown in a 200-unit seedbed with Peat moss (Canadian peat) as a substrate. Germination occurred 21 days after sowing, having a total of 180 germinated seeds by day 25. The germination percentage was 90 %. Finally, after 50 days of germination (in the nursery), the seedlings were transplanted into 30 x 30 cm planter bags until they were used in the different experiments.
Experimental design
Forty 200-day-old Bromelia karatas plants were used, of which 30 were transplanted into a substrate (Peat moss) contaminated with Pb, and the last 10 were transplanted into an uncontaminated substrate (Control). Lead Nitrate Pb(NO3)2) was used as a polluting agent. The experimental design used was a Completely Random Design (CRD) with 4 treatments, Tc = 0, T1 =1000, T2 =2000 and T3 =3000 mg Pb • Kg-1 substrate (Gagan et al., 2017). Each treatment contained ten experimental units, the experimental phase lasted 63 days. During this period, measurements of the morphometric variables were made (number of leaves, height measurement, and chlorophyll quantification). At the end of the experimentation, the samples were prepared to analyze the presence of Pb in the plant tissues (leaves and roots).
Morphometric analyzes of plants
Analysis of morphometric variables: Plant height and chlorophyll quantification
Every seven days, measurements of morphometric variables were carried out, such as the total leaf count (to know the formation of new leaves), and the height of the plant, obtained with the help of a flexometer, measured from the stem (inconspicuous) to the highest leaf because our plant has a rosette shape. The amount of chlorophyll was quantified with the Chlorophilometer, Soil Plant Analysis Development (Minolta SPAD 502), three leaves were measured in total, taking a lower leaf, a middle leaf, and an upper leaf to obtain an average.
This instrument non-destructively measures the light transmission of the leaf at the red and infrared wavelengths at 650 and 940 nm (nanometers), respectively, producing a numerical output indicating the greenness of the leaf (the higher the number given by the instrument, the greener the leaf). Compared to more expensive extraction methods, the SPAD meter can rapidly estimate chlorophyll content (Yamamoto et al., 2002). In plant nutrition studies, the SPAD meter has been used successfully to estimate nitrogen status in different types of plants (Lombard et al., 2010).
Determination of Pb in plant tissues
At the end of the experimental phase, the plants were collected and divided into two parts: leaves and roots. The roots were completely washed until the excess substrate was removed; they were cut and dried in an oven at 70°C for 24 hours (h), having the tissues completely dry, they were crushed with liquid nitrogen and homogenized to a size of 0.8 millimeters (mm) with the help of a sieve (Altıntıg et al., 2014).
An amount of 0.5 grams (g) of sample were taken and placed in 50 milliliter (mL) glass vials, 7 mL of 70% nitric acid (HNO3) were added, and 3 mL of tridistilled water was brought to reflux at a temperature of 90 ± 5 °C for 60 - 90 m(min), it was allowed to cool and later 10 mL of tridistilled water and 3 mL of 70 % HNO3 were added, refluxed again at 90 ± 5 °C for 90 - 120 min (until 5 mL were obtained) and allowed to cool. Finally, the samples were filtered (2 times) through Whatman #1 filters, and tridistilled water was added to the filtered solution in Falcon tubes up to a volume of 25 mL and analyzed by the ICP-OES technique (Thermo Fisher iCAP 6300, USA). Before the analysis, the calibration curve was built using a multi-element standard containing Pb (0.01 to 10 μg/mL) (HIGH PURITY STANDARDS, USA). A solution of 5 μg/mL of Pb was used as QC. Three repetitions were made for each sample. The power of the nebulizer pump was 1150 W with a flow of 0.50 L/min (Ulkuhan et al., 2012; Altıntıg et al., 2014).
Determination of Pb in the Substrate
Samples of substrate (Peat moss) used in the experimentation were analyzed to determine the lead content
For its analysis, samples of previously homogenized substrate were taken with the help of a 0.08 mm sieve and dried in an oven at 80 °C for 24 h (Osma et al., 2014). An amount of 0.5 g of sample was taken and placed in 50 mL glass vials (with five boiling beads for each vial), 5 mL of 70% HNO3 and 5 mL of tridistilled water were added to it, refluxed at 90 ± 5 °C for 50 to 60 min, allowed to cool and then 5 mL of 95 - 98 % HNO3 were added, refluxed at 90 ± 5 °C for 50 min, and allowed to cool. Then, 5 mL of 70% HNO3 and 3 mL of tridistilled water were added, it was refluxed again at 90±5 °C for 90 to 120 min (until 5 mL was obtained) and it was allowed to cool. Ten mL of 35-37% hydrochloric acid (HCl) were added in the same way, it was brought to reflux at 90 ± 5 °C for 60 min (until 5 mL were obtained) and it was allowed to cool. Finally, the samples were filtered (2 times) through Whatman #1 filters, tri-distilled water was added to the filtered solution in Falcon tubes until reaching a capacity of 25 mL.
Results and discussion
Plant morphometric measurements
The measurements were made every seven days, during the experiment lasting 63 d (2 months) obtaining a total of 10 measurements. Day 0 indicates the beginning of the experiments, also indicating how the experimental units used were. Tables 1, 2 and 3, show the averages of each of the measurements of the morphometric variables. The measurement of growth of the new leaves is performed at the beginning and at the end of the experiment, as well as the statistical analysis for each of them (Figures 1 and 2). It is observed that on day zero it does not have measurement data, since the experiment begins.
Tabla 1 Número de hojas a 63 días con las diferentes cantidades de sustrato.
| Days | Control (Tc) | Treatment 1 (T1) | Treatment 2 (T2) | Treatment 3 (T3) |
|---|---|---|---|---|
| 0 | 8 ± 0.3958 | 9 ± 0.3667 | 8 ± 0.3667 | 8 ± 0.2333 |
| 7 | 9 ± 0.4667 | 9 ± 0.4069 | 9 ± 0.3667 | 9 ± 0.3399 |
| 14 | 10 ± 0.4422 | 10 ± 0.3887 | 9 ± 0.4269 | 9 ± 0.2333 |
| 21 | 10 ± 0.5175 | 10 ± 0.4422 | 10 ± 0.4422 | 10 ± 0.3399 |
| 28 | 11 ± 0.5375 | 11 ± 0.3887 | 10 ± 0.4485 | 10 ± 0.2494 |
| 35 | 11 ± 0.5207 | 11 ± 0.4422 | 11 ± 0.4422 | 11 ± 0.3399 |
| 42 | 12 ± 0.5333 | 12 ± 0.3887 | 11 ± 0.4269 | 11 ± 0.2769 |
| 49 | 13 ± 0.5972 | 12 ± 0.4422 | 12 ± 0.4485 | 12 ± 0.3399 |
| 56 | 13 ± 0.5416 | 13 ± 0.4333 | 12 ± 0.4269 | 12 ± 0.2769 |
| 63 | 14 ± 0.5467 | 13 ± 0.4230 | 13 ± 0.4485 | 13 ± 0.3416 |
Tc = without Pb; T1 = 1000 mg Pb • Kg-1 substratum; T2 = 2000 mg Pb • Kg-1 substratum; T3 = 3000 mg Pb • Kg-1 substratum.
Tabla 2 Altura de las plantas en (cm) con las diferentes cantidades de sustrato.
| Days | Control (Tc) | Treatment 1 (T1) | Treatment 2 (T2) | Treatment 3 (T3) |
|---|---|---|---|---|
| 0 | 7.9 ± 0.2544 | 7.3 ± 0.4639 | 5.9 ± 0.1645 | 6.4 ± 0.4006 |
| 7 | 8.4 ± 0.2688 | 7.8 ± 0.4968 | 6.4 ± 0.1703 | 7.2 ± 0.4549 |
| 14 | 8.9 ± 0.2713 | 8.2 ± 0.5236 | 6.9 ± 0.1809 | 7.5 ± 0.3962 |
| 21 | 9.3 ± 0.2840 | 8.7 ± 0.5336 | 7.3 ± 0.2010 | 8.1 ± 0.5093 |
| 28 | 9.8 ± 0.2867 | 9.2 ± 0.5492 | 7.8 ± 0.2063 | 8.3 ± 0.4328 |
| 35 | 10.4 ± 0.3592 | 9.7 ± 0.5675 | 8.3 ± 0.2163 | 8.6 ± 0.4465 |
| 42 | 10.8 ± 0.3906 | 10.2 ± 0.5835 | 8.7 ± 0.2146 | 9.1 ± 0.4428 |
| 49 | 11.3 ± 0.4077 | 10.7 ± 0.5992 | 9.2 ± 0.2372 | 9.4 ± 0.5156 |
| 56 | 11.8 ± 0.4225 | 11.1 ± 0.6044 | 9.6 ± 0.2516 | 9.9 ± 0.5067 |
| 63 | 12.3 ± 0.4279 | 11.5 ± 0.6129 | 10.0 ± 0.2687 | 10.5 ± 0.4527 |
Tc= without Pb; T1 = 1000 mg Pb • Kg-1 substratum; T2 = 2000 mg Pb • Kg-1 substratum; T3 = 3000 mg Pb • Kg-1 substratum.
Tabla 3 Cuantificación de clorofila en unidades SPAD con las diferentes cantidades de sustrato.
| Days | Control (Tc) | Treatment 1 (T1) | Treatment 2 (T2) | Treatment 3 (T3) |
|---|---|---|---|---|
| 0 | 29.27 ± 1.6874 | 24.47 ± 2.0273 | 28.77 ± 1.7315 | 28.54 ± 1.8910 |
| 7 | 35.58 ± 1.5295 | 33.43 ± 2.0180 | 38.32 ± 1.4859 | 36.79 ± 1.7791 |
| 14 | 29.45 ± 1.2055 | 27.67 ± 1.3871 | 29.98 ± 0.6616 | 28.27 ± 1.1582 |
| 21 | 35.20 ± 1.2765 | 31.39 ± 1.1281 | 33.50 ± 1.1218 | 31.15 ± 1.4931 |
| 28 | 41.42 ± 0.8478 | 36.71 ± 1.2845 | 39.63 ± 0.6511 | 36.83 ± 1.1750 |
| 35 | 36.89 ± 0.5748 | 32.63 ± 1.5940 | 33.88 ± 0.8402 | 31.24 ± 0.8566 |
| 42 | 42.70 ± 1.0206 | 38.56 ± 1.7146 | 38.90 ± 0.8207 | 34.42 ± 0.9095 |
| 49 | 42.27 ± 0.9653 | 38.92 ± 1.3072 | 40.57 ± 0.8831 | 37.23 ± 0.6057 |
| 56 | 44.65 ± 0.9903 | 40.02 ± 2.0761 | 38.50 ± 1.3993 | 34.69 ± 0.9627 |
| 63 | 43.19 ± 0.8444 | 32.90 ± 2.1012 | 30.53 ± 1.2904 | 30.01 ± 0.7933 |
Tc= without Pb; T1 = 1000 mg Pb • Kg-1 substratum; T2 = 2000 mg Pb • Kg-1 substratum; T3 = 3000 mg Pb • Kg-1 substratum.
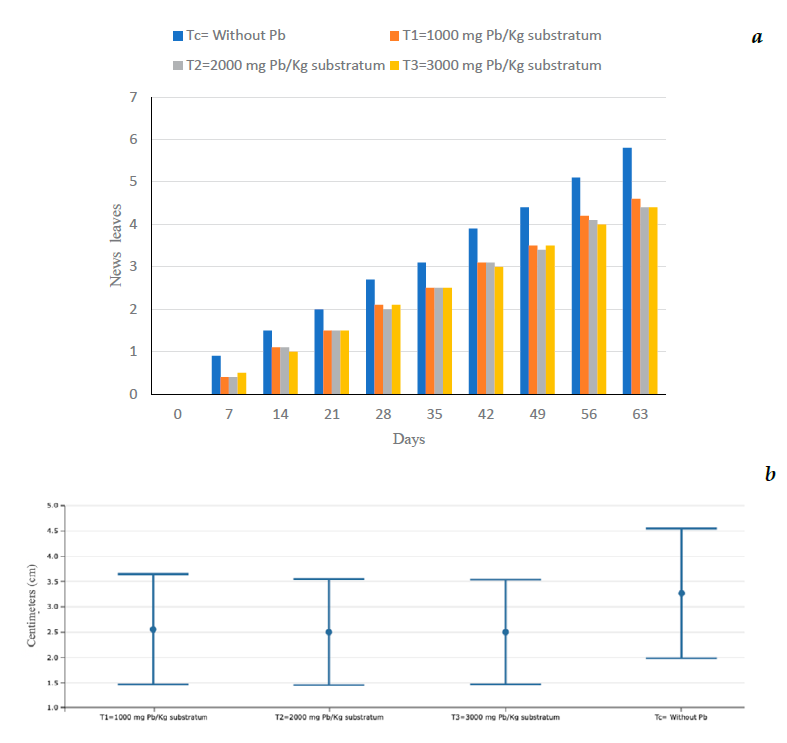
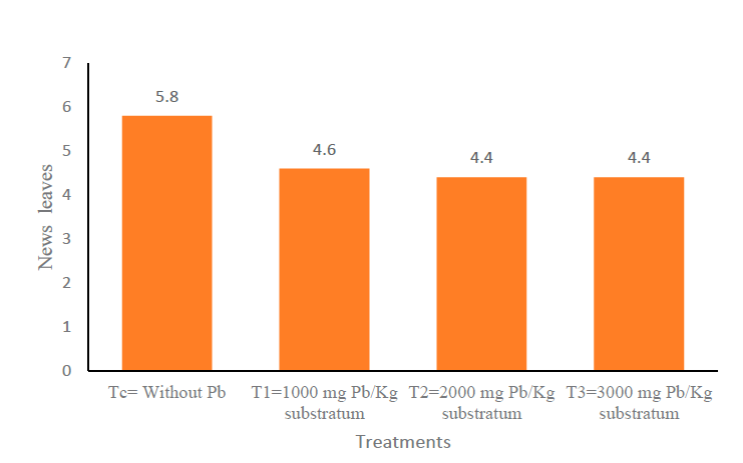
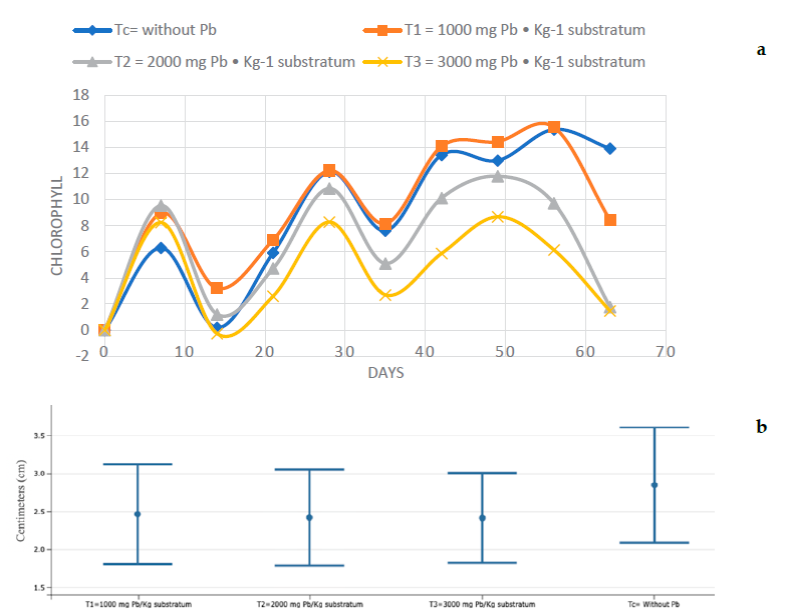
Figure 1a shows the number of new leaves that were born every seven days from the beginning of the experiment until the end of the 63 days, it is observed that the control (Tc) always had the highest measurement, compared to the other treatments. Figure 1b shows no significant statistical difference between the treatments. Figure 2 shows the Tukey HSD test of the response variable (new leaves) with 95% confidence, of the different treatments. At the end of the experimentation, treatment C had, on average, one more leaf compared to the other treatments; from day 42 treatments 1, 2, and 3 (T1, T2 and T3) had similar averages, at 63 days T2 and T3 were equal in average new leaves.
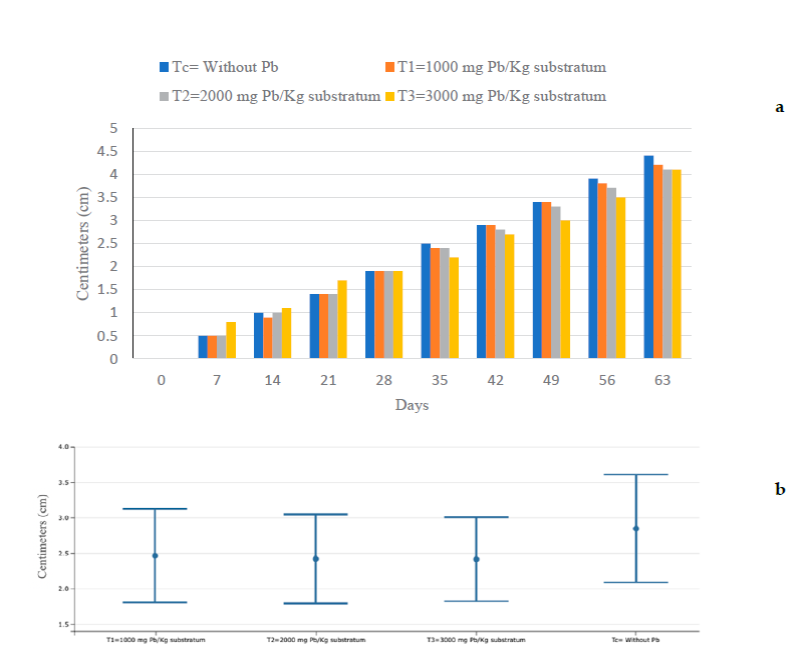
Plant height (grown centimeters)
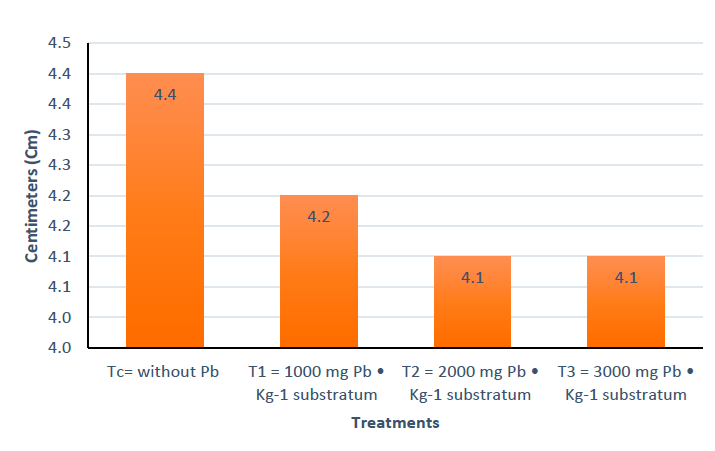
Figure 3a show that at seven days after starting the experiment, T3 had grown 0.8 cm and C, T2, and T3 0.5 cm. It is clear that T3 had a higher growth compared to the other treatments, observing this trend until 21 days; from day 35 the situation changed, with Tc being the highest measurement and T3 the lowest data of the four treatments, which was maintained in the following measurements until the end of the experiment. Figure 3b. shows that there is no significant statistical difference between the treatments, and Figure 4 shows that there is no statistically significant difference in the response variable (centimeters grown) between the four treatments, using the Tukey test.
Chlorophyll quantification
Regarding the amount of chlorophyll, Figure 5a shows the increase or decrease of chlorophyll every seven days, giving the understanding that only the data of chlorophyll amount had increased or decreased in relation to the amount of chlorophyll that the plants had at the beginning of the experiment was expressed. Seven days after the start of stress with Pb, Tc had increased by 6.3 SPAD units, being the treatment that had the lowest increase even below T3, which presented a data of 8.2 SPAD, while T2 was the highest with 9.5 SPAD; on day 14 both Tc and T3 had a decrease compared to the data shown at 7 d, for C of 6.3 SPAD that had increased decreased 6.1 SPAD, while T3 indicated an even lower data than it had at the beginning of the experimentation, from day 21 T3 was the lowest followed by T2. This sequence was maintained until 63 d when the experiment ended, and treatments Tc and T1 were the ones that yielded the highest chlorophyll increase data, maintained until 56 d for T2 given that at 63 d you have a decrease in chlorophyll; C was the highest at the end of the experimentation compared to the other treatments. Figure 5b shows that there is no significant statistical difference between the treatments.
In Figure 6, Tc presents a significant statistical difference with T2 and T3, but not with T1 which does not present a significant statistical difference with the different treatments; it is observed that T2 presents a significant statistical difference with Tc but not with T1 and T3 in the same way that T3 has a significant statistical difference only with Tc, using the Tukey test.
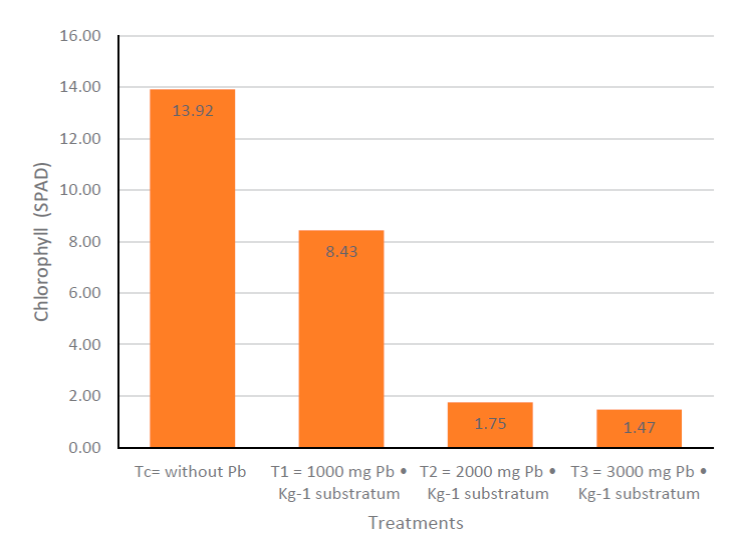
Lead stress has been shown to reduce the photosynthetic activity of sunflower plants due to reduce chlorophyll biosynthesis and leaf area, leading to reduced biomass (Usman Zulfiqar et al., 2019). Furthermore, it has been shown that the phytotoxicity of Pb causes oxidative stress in plants and increases the synthesis and activity of the enzyme chlorophyllase, resulting in a reduction in photosynthesis due to chlorophyll degradation. The structural changes induced by Pb in the photosynthetic apparatus and the decrease in chlorophyll biosynthesis cause a delay in carbon metabolism (Usman Zulfiqar et al., 2019), which would explain the reduction in chlorophyll in Bromelia karatas.
Determination of lead in leaf, root and substrate
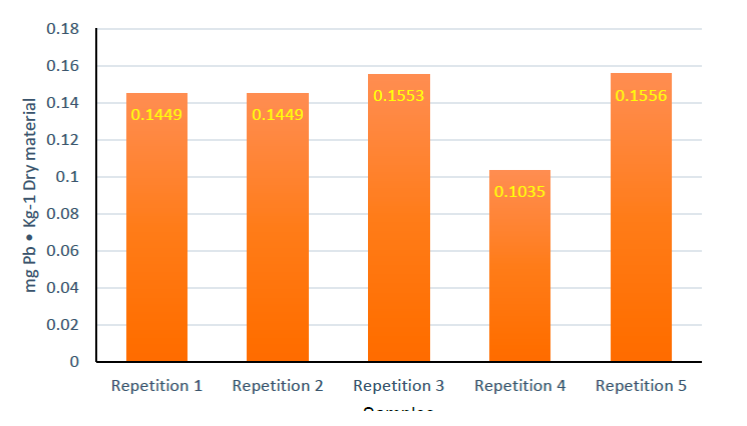
Figure 7 expresses the average of the results of Pb quantification in leaf and root of the four treatments. For treatment Tc, the metal was not detected in the leaves. However, 0.0486 ± 0.0102 mg Pb/Kg Substrate was detected in the root, despite the fact that the control was not exposed to Pb. This may be due to the fact that the substrate used contained traces of Pb and can be observed in Figure 8, which expresses the quantification of the five replicates of peat moss samples analyzed in ICP-OES; it was observed that the substrate actually contained traces of Pb, an average of 0.1408 ± 0.0096 mg Pb/Kg Substrate was determined.
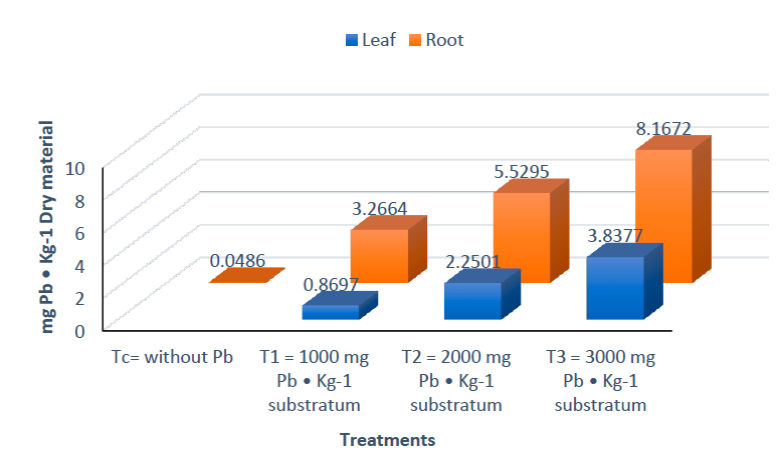
All the treatments exposed to Pb (T1, T2 and T3) presented an accumulation in tissues of Bromeliad karatas; for T1 in leaf 0.8967 ± 0.0332 mg of Pb/Kg was quantified and in root 3.2664 ± 0.2244 mg of Pb/Kg, in T2 2.2501 ± 0.1468 mg of Pb/Kg was quantified in leaf and 5.5295 ± 0.1851 mg of Pb/Kg in roots, and T3 contained in leaf 3.8377 ± 0.166 9 mg Pb/Kg and in roots 8.1672 ± 0.1654 mg Pb/Kg. It is evident that the amount of absorption was also according to the exposed concentration, that is, the higher the concentration of Pb contained in the substrate, the higher the absorption of the heavy metal in the organism (Figure 8).
Tables 4 and 5 show a multiple range test for the accumulation of Pb in leaves and roots respectively. Of the four treatments with a confidence level of 95 %, in the column of homogeneous groups the equal letters tell us that there is no significant statistical difference, while different letters if there is a significant statistical difference, therefore there are no homogeneous groups.
Tabla 5 Pruebas de rango múltiple para la acumulación de plomo en raíces.
| Treatments | Replicas | Media | Homogeneous groups |
|---|---|---|---|
| Tc = Control | 5 | 0.0486 ± 0.0102 | a |
| T1 = 1000 mg Pb • Kg-1 substrate | 5 | 3.2664 ± 0.2244 | b |
| T2= 2000 mg Pb • Kg-1 substrate | 5 | 5.5295 ± 0.1851 | c |
| T3= 3000 mg Pb • Kg-1 substrate | 5 | 8.1672 ± 0.1654 | d |
It is important to mention that the Bromelia karatas was able to tolerate concentrations of 1000, 2000 and 3000 mg Pb/Kg substrate. According to the Agency for Toxic Substances and Disease Registry (2007), the normal content of Pb in soil is 10 mg Pb/Kg (Mahecha-Pulido et al., 2015), a value exceeded in treatments 1, 2 and 3, however, the range of toxicity proposed by this agency is between 50 to 100 mg Pb/Kg which are below the concentrations used in this research.
Regarding the morphometric variables previously analyzed, it is clear that Tc had the best response, mainly due to the fact that it was not in an environment contaminated with Pb followed by T1, which had the lowest concentration of Pb, T3, which had the highest concentration of Pb, was the one that showed the most negative responses, however, no leaf necrosis or cell death was observed in any of the plants of the four treatments due to contact with the heavy metal.
Gagan et al. (2017) examined the ability of Coronopus didymus belonging to the Cruciferae (Brassicaceae) family to accumulate Pb in their tissues. This plant was exposed to Pb concentrations of 100, 350, 1500 and 2500 mg Pb/Kg supplied with Pb(NO3)2 for four and six weeks. After four weeks, he reported that in roots and plant shoots, 502 to 1625 mg Pb/Kg of dry matter (DM) were quantified, while at six weeks the concentration of Pb in their tissues increased significantly. We can clearly appreciate that the accumulation by this plant was much higher than our object of study which presented an accumulation of Pb in its highest concentration of 8.1672 mg Pb/Kg DM in root and 3.8377 mg Pb/Kg DM in leaf being in contact with a concentration of 3000 mg Pb/Kg substrate. The removal of Pb, using Bromelia karatas, is an example of phytoremediation, as experienced by Álvarez-Bernal et al. (2007) using the legume Mimosa monancistra, to remove 87 %, polycyclic aromatic hydrocarbons (PAHs), in a time of 90 days.
Another plant of importance as a bioindicator are lichens, studied by Lijteroff et al. (2009), in the city of San Luis, Argentina, using the atmospheric purity index, to determine the gradualness of contamination levels, the almost absence total lichens in the city of San Luis, indicated the low quality of air in the urban space, but not in the city of Juana Koslay used as control.
Another species of epiphytic Bromeliad used as a bioindicator of atmospheric contamination by metals such as copper, zinc and vanadium, was Tillandsia usneoides L. reported by Figueiredo et al. (2004), being found at higher densities in industrial zones, in the city of Sao Paulo, Brazil.
Another plant of the Bromeliaceae family and of great importance as a biomonitor is Tillandsia recurvata, studied by Zambrano-García et al. (2009), in the Mezquital Valley, an agricultural and industrial region, analyzing contaminants such as polycyclic aromatic hydrocarbons (PAHs) and metals such as chromium, nickel, lead and vanadium.
The results indicated a high deposition of bioaccumulative atmospheric pollutants in the Mezquital Valley, especially in the industrial area. Recommend Tillandsia recurvata, as a biomonitor, for comparisons within Mexico and between countries where it is distributed from the southern United States to Argentina.
Two epiphytic angiosperm species (Tillandsia caput-medusae and Tillandsia bulbosa) for monitoring airborne polycyclic aromatic hydrocarbons (PAHs) from Florence, Italy were analyzed by Brighigna et al. (2002), with PAH data obtained by GC/MS analysis of plant extracts, which indicated physical capture of aerial particles operated by trichomes with prominent bioaccumulation of PAH in tillages. SEM (scanning electron microscope) observations confirmed the role of trichomes. This work indicates that tillages are particularly useful and low-cost biomonitoring organisms within their range (all Latin American countries and the southern US).
Rodríguez et al. (2011) evaluated the air quality in agricultural areas close to industrial emission sources (chemical, metallurgical and cement plants) through a biomonitoring study using the epiphytic species Tillandsia capillaris Ruíz and Pav. F. capillaris. The biomonitors were exposed to ambient air for four periods of 3 months each for one year (for the determination of physiological parameters), and for four periods of 6 months each for two years (for the determination of trace elements). The comparison between study areas indicates the highest values of the leaf damage index in the chemical industry sites, possibly due to the emission of oxidizing pollutants. On the other hand, the concentrations of heavy metals and trace elements (V, Fe, Co, Cu, Br, Ni, Zn and Pb) were mainly associated with the metallurgical industries, although the chemical and cement industries were associated with Ni and Zn.
Schrecka et al. (2016) evaluated the reliability of Tillandsia sp. against passive filters to monitor the atmospheric deposition of metal(loid)s in an area affected by anthropogenic activities. Three zones with different levels of contamination were monitored for five months in 2012. For the highly contaminated area, a linear increase in metal(loid)s accumulation in passive filters was found, while for transplanted Tillandsia capillaris the increase was almost linear for As, Cd, Hg and Sn, but not for Ag, Pb, Sb and Zn. For the moderately contaminated zone, the results showed that the exposure time was not sufficient for the concentrations of metal(loid)s to increase in the plants or in the filters. However, the natural specimens provided some indication of the levels of metal contamination. Metal particles were observed on the surface of the plant and also in the central disk below the tillandsia trichomes, suggesting that this is a possible pathway for metals to enter the plant. X-ray absorption spectroscopy demonstrated the chemical transformation of Pb and As, both in filters and in plants. For Pb, sorbed and/or cell wall Pb complexes were identified in plants. or there was no clear evidence of internalization and detoxification.
Tolerance to heavy metals by plants is limited both by cellular uptake and by the resistance of the metals once they have entered cells (Aman et al., 2018). The strategies used by plants to resist the toxic effects caused by heavy metals, are related to the following mechanisms:
Level of tolerance by the cell membrane towards metals.
Reduced transport across the cell membrane.
Active flow of metals from cells to the outside.
Tolerance level of plant enzymes towards metals.
Compartmentalization or accumulation of excess metals in subcellular organs such as vacuoles.
Metal chelation by organic and/or inorganic ligands such as phytochelates.
Precipitation of the metal to form compounds of low solubility.
Davies et al. (1991) mention that some known examples where these mechanisms are involved are in the accumulation of zinc in the vacuoles, these are associated with chelation by organic acids and their precipitation is linked to forms of zinc phytate. While the precipitation of cadmium and possibly copper and lead are bound to thiol-rich peptides such as phytochelatins.
Conclusions
This research has revealed the potential of Bromelia karatas as a bioindicator of Pb contamination in soil. The bromeliad response to Pb stress was the highest of all the stress inducers examined; a higher concentration of these pollutants was quantified. In the presence of Pb, they were able to detect visible symptoms of leaf damage in their leaves after high doses of the contaminant. The low cost and the easy reproduction and portability of the bromeliad in comparison with other known bioindicators of the bromeliad family will make it a better option to be used as a bioindicator and/or biomonitor in the city of Tuxtla Gutiérrez, and in other future research to experiment with phytoremediation.

