


 nueva página del texto (beta)
 Inglés (pdf)
 Artículo en XML
 Referencias del artículo
 Enviar artículo por email
 Citado por SciELO
  Similares en
SciELO
Similares en
SciELO 
 Permalink
1. Introduction
Zinc oxide (ZnO) is a n-type compound semiconductor with a direct wide band gap [1]. It has a relatively large exciton binding energy (60 meV) at room temperature [2], good optical properties and a high stability [3]. Zinc oxide represents an important basic material due to its low cost as well as its electrical, optoelectronic and luminescent properties [4]. Overall, ZnO is of importance for fundamental research, and also relevant for various fields of industrial and high technological applications such as gas sensors [5], varistors [6], piezoelectric [7], UV light detector and Schottky diodes [8]. Various ZnO nanostructures, such as nanorods have been fabricated by thermal evaporation [9], chemical vapor deposition [10], sol-gel method [11], electrochemically deposition, ion beam assisted deposition [12], rf magnetron sputtering deposition [13], metalorganic chemical vapor deposition [14] and spray pyrolysis aqueous solution method [15]. Among these methods, pulverized pyrolysis is particularly suitable and useful for large surface applications, as it has proven to be a simple and inexpensive method. Many authors have described the preparation of ZnO thin films using spray pyrolysis. However, little attention has been paid to the character of precursors such as Romero et al. [16]. In the present study, by using the spray pyrolysis technique, we report a comparative study of different precursors such as zinc acetate, zinc chloride and zinc nitrate on the ZnO thin films. The structural and optical properties were also investigated.
2. Experimental details
The ZnO thin films for all precursors were fabricated by the chemical spray pyrolysis spray technique on glass substrates. Before the deposition, the substrates of dimensions 75 × 25 mm2 were cleaned with acetone and double-distilled water.
The chemical precursors used are zinc acetates (Zn (CH3COO)2.2H2O), zinc chloride (ZnCl2.H2O) and zinc nitrates (Zn (NO3)2.6H2O). These chemicals were dissolved in double-distilled water at the 0.1 M concentration. Note that a small amount of hydrochloric acid (HCl) has been added to dissolve the zinc chloride since it gives a chemical precipitate if only double-distilled water is used to dissolve it.
Furthermore, all the thin ZnO films obtained were manufactured under the same conditions summarized in Table I.
3. Results and discussion
3.1. Structural properties and morphology
The structural characterization was performed at room temperature using a Bruker X-ray diffractometer model D2 Phaser with CuK
Figure 1 shows the XRD diffraction spectra of ZnO thin films obtained using zinc acetates (Fig. 1a), zinc chloride (Fig. 1b) and nitrates of zinc (Fig. 1c) as precursors.
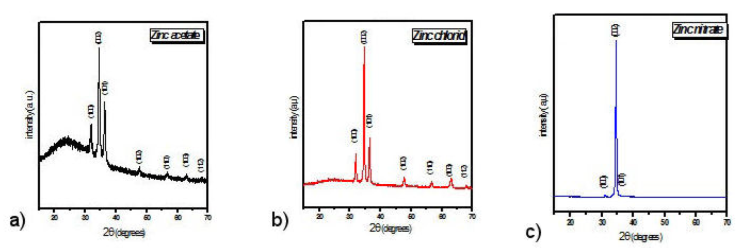
The comparison of its XRD spectra with the standard card JCPDS (Joint Committee on Powder Diffraction Standards) N°36-1451 [17-19] allowed us to conclude that these are polycrystalline thin films of ZnO crystallized in the hexagonal Wurtzite phase.
After indexing its spectra according to the data available in the JCPDS map N°36-1451 (angular positions of the peaks and their corresponding hkl indices), it was noticed that the thin ZnO films obtained using zinc acetates present several reflecting planes, (100), (002), (101), (102), (110), (103) and (112) with a fairly high background noise compared to the maximums of the intensities of reflective peaks. This means that in the case where there are several reflecting planes, this material is not well crystallized, this is the case with the thin films of ZnO obtained from acetates, there is coexistence of the amorphous ZnO material and ZnO crystallites oriented along the planes cited above. The shape of the diffraction spectrum recorded for the ZnO films obtained from acetates also means that there is no strong preferential orientation for the crystallites within them.
Regarding the thin ZnO films obtained from zinc chloride, the indexing of their corresponding XRD spectrum (Fig. 1b), indicates the presence of the same reflective planes observed in the XRD spectrum relating to the films ZnO obtained from acetates, namely (100), (002), (101), (102), (110), (103) and (112). However, unlike the films obtained from zinc acetates, the XRD spectrum relating to those obtained from zinc chloride presents a background noise (Backgound) low in intensity compared to the intensities of the peaks corresponding to the reflecting planes, meaning that amorphous composition is present in these films. Furthermore, a weak preferential orientation of ZnO crystallites with ZnO thin films obtained from zinc chloride as well as those obtained from acetates.
The examination of the XRD diffraction spectrum, relating to the thin ZnO films obtained from zinc nitrates, is characterized by the presence of three peaks corresponding to the reflecting planes (110), (002) and (101) with a noise of almost zero bottom if one compares its intensity compared to that of the peak (002). Furthermore, the intensities of the peaks recorded show a strong preferential orientation along the crystallographic plane [002], noted as the c axis which is perpendicular to the growth plane (plane of the substrate). This result shows that the crystallites composing the thin ZnO films obtained from nitrates grow more easily along the c axis which can be characterized as being the axis relating to the minimization of internal stresses and surface energy [20]. The grain sizes, lattice constants, strains and dislocation density have been evaluated according to Fig. 3. For the estimation of crystallite size the Sherrer formula is used [21,22]:
where k = 0.9, λ = 1.5406 Å is the x-ray wavelength, β is the full width at half maximum (FWHM) of the XRD peak, and θ is Bragg’s diffraction angle. The lattice parameters of the films are determined by the following relation [23]:
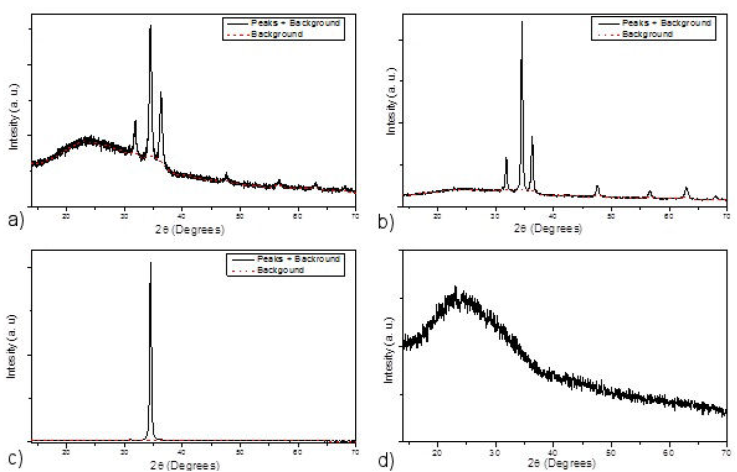
Figure 2 XRD diffraction spectra and background adjustment. a) XRD spectrum of ZnO films obtained from Acetates; b) XRD spectrum of ZnO films obtained from Chlorides; c) XRD spectrum of ZnO films obtained from Nitrates ; d) XRD spectrum of the glass substrates used.
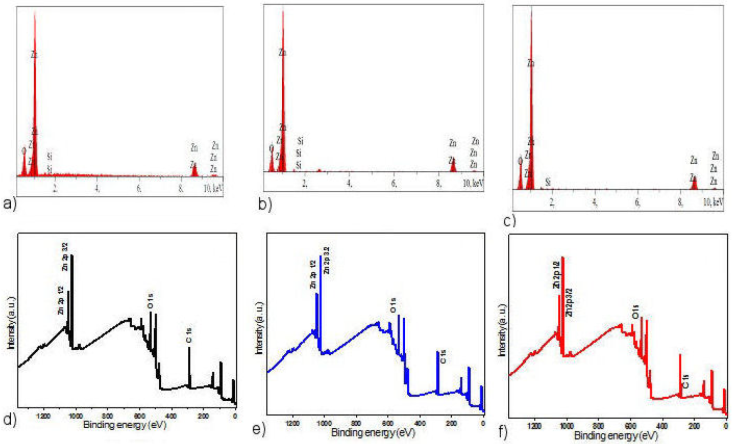
Figure 3 a)-c) Energy dispersive X-ray (EDX) spectra, d)-f) XPS full survey scan of the obtained zinc acetate, zinc chloride and zinc nitrate, respectively.
The micro-strain (ε) has been estimated using the following formula [24]:
The dislocation density of the films has been estimated using the following formula [24]:
All the structural parameters, i.e., full width at half maximum (FWHM), crystallite sizes, lattice constants (a and c), strains and dislocation density are summarized in Table II.
Table II Structural parameters of fabricated ZnO thin films.
| Samples |
|
|
|
|
|
|
|
|---|---|---|---|---|---|---|---|
| JCPDS card N° 36-1451 | 34.422 | - | - | 3.24 | 5.20 | - | - |
| zinc acetate | 34.432 | 5.562 | 25.157 | 3.23 | 5.19 | 13.778 | 15.789 |
| zinc chloride | 34.574 | 5.460 | 26.595 | 3.23 | 5.19 | 13.033 | 14.138 |
| zinc nitrate | 34.521 | 5.093 | 28.508 | 3.24 | 5.19 | 12.157 | 12.300 |
According to Table II, the values of the calculated lattice parameters (a and c) are in agreement with those of standard ZnO (JCPDS card N° 36-1451) and those reported in the literature [26]. Moreover, the sizes of the crystallites oriented along the crystallographic plane (002) which constitute the three films of ZnO have the same order of magnitude with a slight difference and consistency with the results found by other researchers [27]. In fact, it is noted that the ZnO films obtained from zinc nitrates have the smallest size relative to those obtained from acetates and chloride. On the other hand, it is noted that the meshes of the crystallites oriented according to [002] undergo deformation stresses which are the least important for the ZnO films made from nitrates which also result in the lowest density of dislocations (Table II) and consequently fewer structural defects compared to ZnO films obtained from the other zinc acetate and zinc chloride precursors.
3.1.1. Calculation of crystallinity
During the development of polycrystalline thin films, the growth of the material on amorphous substrates, in this case glass, is not favored according to any precise crystallographic orientation plane. Often, and for thermodynamic reasons (energy of formation, temperature etc.), the growth of the material takes place in a mixture of crystalline and amorphous or even totally amorphous (disordered growth).
In this sense, the films obtained can be characterized by a parameter (the amount of amorphous material) that can inform us about their crystalline quality, thus indicating the amorphous and crystalline fractions that make up the samples thus obtained. Experimentally, the amorphous state of a given material results in the recording of a diffraction spectrum with a very broad peak at all angles 2θ scanned. This is clearly seen in the spectrum of Fig. 2d), relating to the glass we used as a deposition support for our films.
Moreover, when a polycrystalline layer is involved, in this case the manufactured ZnO thin films, their diffraction spectra are made up of both an amorphous part, which is distinguished by a large envelope, often called background, and very distinct peaks positioned at very precise angles (Fig. 2a), b) and c)) relating to the reflective planes characteristic of the crystallographic orientation planes of the crystallites that make up the layer.
The percentage of the amount of amorphous or disordered material in the sample is defined by the expression [25]:
Therefore, subtracting this percentage from the amount of amorphous material in 100 gives the amount of crystallised material in the sample commonly referred to as ’crystallinity’: % of the amount of crystalline material = 100 - % of the amount of amorphous material. The results of the calculation performed using the Eva-Diffrac software [26] are given in Table II.
It is clear from Table II that the ZnO samples obtained using the zinc nitrate precursor have a much higher crystallinity than the ZnO samples obtained from the zinc acetate and zinc chloride precursors. This indicates that the ZnO films obtained from the nitrates have good crystallinity compared to those obtained from the other two precursors.
Note that in the calculation of the results summarized in Table II, the contribution of the glass substrate in the diffraction spectra has been neglected. This approximation is all the more plausible if we consider medium thick films, which is the case in our experiment.
The analyses of chemical composition were carried out using a Jeol JSM 5800 scanning electron microscope which is equipped with energy dispersive X-ray detector (EDX, IXRF Model 550i). The XPS measurements were carried out on a Kratos Axis Ultra using Al K
Table III Crystallinity rates of the ZnO samples obtained.
| ZnO thin films | Crystallinity (%) | Amorphous composition |
|---|---|---|
| Obtained from Acetates | 9.6 | 90.4 |
| Obtained from Chlorides | 22.4 | 77.6 |
| Obtained from Nitrate | 82.4 | 17.6 |
The chemical composition checking by the EDX spectra is given in Fig. 3a). As expected, EDX spectra show the presence of peaks attributed to zinc and oxygen elements for all samples and reveal the presence of silicon attributed to the glass substrate.
Figure 3b) illustrates the general (XPS) spectrum of the ZnO obtained from zinc acetate, zinc chloride and zinc nitrate, respectively. It can be observed that the Zinc, Oxygen and Tin peaks are presented, which confirms the (EDX) and (XRD) analysis previously done.
3.2. Optical properties
The optical transmittances have been recorded between 200 and 2500 nm wavelength using a JASCO 570 type UV-vis-NIR double-beam spectrophotometer. Figures 4a)-c) show the optical spectra for ZnO thin films obtained by using different precursors such as zinc acetate (Fig. 4a)), zinc chloride (Fig. 4b)) and zinc nitrate (Fig. 4c)). The optical transmission spectra of the ZnO thin films using the above mentioned precursors were not found to be highly transparent. In the case of thin films of ZnO manufactured using the precursor zinc nitrates, it is noted that the average transmission in the visible range is around 65% (Fig. 4c)) which is in agreement with the work of A. Nakrela et al. [28]. This relatively high transparency is attributed to their good crystallinity, unlike the thin ZnO films obtained from zinc acetates and zinc chloride which have lower transmittances of the order of 58% and 61%, respectively, in agreement with the work of H. Benzarouk et al. [29]. We note, moreover, the absence of interference fringes in the recorded transmission spectra, which may be due to the roughness of the surface of the films deposited by spray pyrolysis due to the small size of the droplets of the solutions [29].
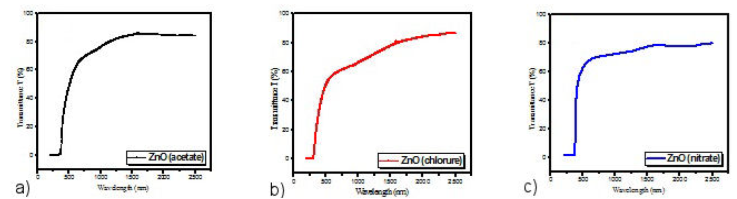
Figure 4 Transmittance spectra of manufactured ZnO thin films. a) zinc acetate; b) zinc chloride; c) zinc nitrate.
The band gap of thin ZnO films is an important parameter for estimating the limit of their absorption band. The optical band gap was determined using the following formula [30-32]:
where α is the absorption coefficient, hv the photon energy, A, a relation constant and E g the optical band gap. We have usually taken n = 0.5 for indirect band gap semiconductors and n = 2 for direct band gap semiconductors. As ZnO no is considered as a direct semiconductor, the intersection of the extrapolation of the linear region of (αhv)2 on the energy axis makes it possible to determine the optical gap (Fig. 5). It can be observed that the gap values for ZnO
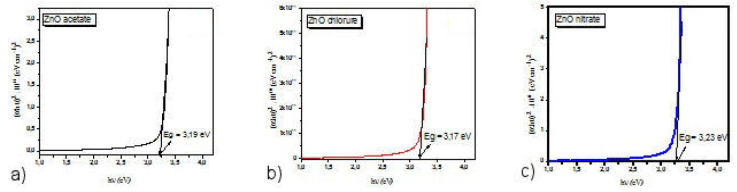
Figure 5 Variation of (αhv)2 as a function of the energy of ZnO thin films. a) zinc acetate; b) zinc chloride; c) zinc nitrate.
lms using zinc acetates, zinc chlorides and zinc nitrates are 3.19, 3.17, and 3.23 eV, respectively,nin agreement with the results of the literature [33].
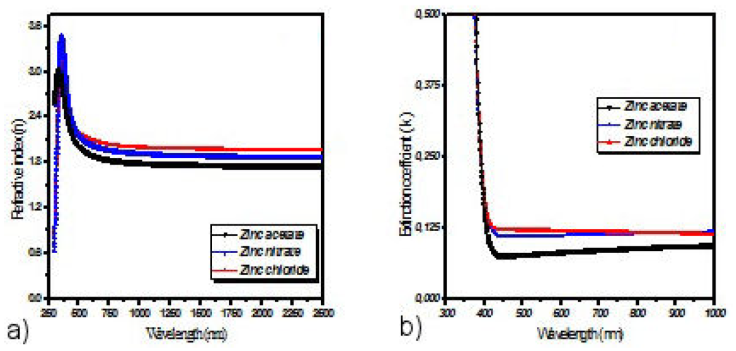
The refractive index n, extinction coefficient k and the thickness d of the thin films were estimated with the spPS (seed preprocessing Pattern search) technique[34]. The obtained values of the deposited films thicknesses are 282, 299, 291 (nm) for ZnO obtained from acetates, chloride and nitrates respectively The refractive index n (Fig. 6a) and the value of extinction coefficient k (Fig. 6b) varied from 2.13 to 1.8, and from 0.12 to zinc acetate, zinc chloride and zinc nitrate, respectively in the visible wavelength range. Similar values are observed in [15,22,33]. These films with low values of n and k are recommended for optoelectronic device applications such as solar cell window films [35,36].
4. Conclusion
ZnO thin films were prepared using zinc acetate, zinc chloride and zinc nitrate precursors by spray pyrolysis technique on glass substrates at 350°C. ZnO thin films are all in hexagonal structure. The film grown using zinc nitrate precursor had a well-preferred orientation of (002) while the other two are low oriented. The EDX images and XPS spectra for all samples confirmed the deposition of Zn and O in the films, and the EDX pattern validated the XRD result. The optical measurements revealed that films have a low transmittance of the zinc acetate and zinc chloride around 58% and 61%, respectively. On the other hand the zinc nitrate achieved 65%. The calculated optical band gap values are 3.19, 3.17 and 3.23 eV for ZnO using different precursors of zinc acetate, zinc chloride and zinc nitrate, respectively. This study suggests that the ZnO obtained from nitrate is the preferable one candidate for optoelectronic applications such as photovoltaic solar cells.

