Original articles
Rehabilitation effect of manual lymphatic drainage on pain threshold and tolerance, tactile sensation, and strength
Efecto de rehabilitación del drenaje linfático manual en el umbral y tolerancia al dolor, sensación táctil y fuerza

Abstract
Objective:
This study evaluates the acute therapeutic effect of manual lymphatic drainage (MLD).
Method:
Eighty-two individuals (164 upper limbs) participating in the study were divided into two groups: MLD and sham. Before and after treatment, measurements of pressure pain threshold (PPT), pain tolerance, muscle strength (using a hand dynamometer and pinchmeter), and two-point discrimination (2PD) with an esthesiometer were conducted.
Results:
Age, height, weight, body mass index, gender, and dominant extremity of the participants showed similar characteristics (p > 0.05). There was a difference hypothenar PPT (p = 0.038) and pain tolerance (p = 0.009), thenar PPT (p = 0.021) and pain tolerance (p = 0.001), mid-ulnar PPT (p = 0.028), biceps PPT (p < 0.001), pain tolerance (p < 0.001), and grip strength (p = 0.030) between the groups after the therapy. When comparison was made between the groups at baseline and after the treatment all were found to differ (p < 0.05).
Conclusions:
MLD reduced PPR, pain tolerance, hand grip, and pinch strength in young adults. However, in this population, the distance felt in 2PD evaluation with MLD decreased.
Keywords:
Manual lymphatic drainage, Pain threshold, Pain tolerance, Tactile sense, Muscle strength
Introduction
Manual lymphatic drainage (MLD), one of the components of complex decongestive physiotherapy, is a gentle massage technique with proven positive effects on lymphatic circulation. MLD can be applied to different parts of the body (e.g., arms, legs, neck, abdomen, and trunk), with a different technique for each region (stationary circle, scoop, pump, and rotary)1. It has disease-specific application principles, and its efficacy can be further increased by respiration2. MLD is effective in mobilizing lymph fluid, promoting lymphangiomotor activity and venous return, and supporting the immune system. With these effects, MLD has been proven to reduce edema in the extremities3.
-
1Dr Vodder's manual lymph drainageA practical guide. NZJ Physiother, 2011
-
2Lymphedema after breast cancer and its treatmentJ Breast Health, 2014
-
3Manual lymphatic drainage for lymphedema following breast cancer treatmentCochrane Database Syst Rev, 2015
Although the efficacy of MLD is frequently investigated in patients with lymphedema/chronic venous insufficiency, it has been reported that this application has different effects on the body other than edema reduction in different patient populations and healthy individuals4-6.
-
4The use of manual lymphatic drainage on clinical presentation of musculoskeletal injuries:A systematic reviewComplement Ther Clin Pract, 2021
-
6Comparison of manual lymph drainage therapy and connective tissue massage in women with fibromyalgia:a randomized controlled trialJ Manipulative Physiol Ther, 2009
Various studies conducted with different populations have shown that soft touch activates different receptors on the skin through, not only increases stimulation in nerve endings but also activates inhibitory nerve endings, causes changes in tactile sensation, provides the activation of the parasympathetic system, increases muscle strength, results in changes in systolic and diastolic blood pressure, and reduces heart rate7,8.
-
7Investigation of the less known effects of manual lymphatic drainage:a narrative reviewLymphat Res Biol, 2022
-
8Effects of manual lymph drainage on the activity of sympathetic nervous system, anxiety, pain, and pressure pain threshold in subjects with psychological stressPhys Ther Korea, 2014
However, it is not known whether these effects are due to the MLD technique or the general therapeutic effectiveness of soft touches. Explaining the effects of MLD in every aspect can provide more effective management of the technique on diseases and pave the way for its use in different areas. Therefore, its effects on healthy individuals need to be known and defined. In this study, the effects of MLD technique and random soft touches on pain threshold, pain tolerance, muscle strength, and tactile sense were investigated.
Method
Patients and study protocol
Ninety-six healthy individuals participated in this 2-arm randomized controlled study. Fourteen individuals that used corticosteroid drugs within the past 2 months, and a further five that did not accept to participate in the study were excluded from the study. As a result, 82 (MLD group: 41, sham group: 41) volunteers were included in the study that November 2023.
The participants were randomly divided into two groups as the study and sham groups. The randomization procedure was performed using a coin toss. The participants were blinded to the group allocation. Ethical approval was obtained from the Non-Pharmaceutical and Medical Device Research Ethics Committee of blinded (decision number: blinded), and the study was conducted in accordance with the principles of the Declaration of Helsinki. Individuals were explained about the measurements and the reason for the study. Consent forms were obtained. It was explained to the participants that if they wanted to leave the study, they could leave the study at any time. The patients demographic data were questioned. MLD application was made by lymphedema physiotherapist. The research was conducted in the physiotherapy course laboratory at Selcuk University.
This is prospective randomized controlled study and randomization was carried out by a different researcher Cansu Sahbaz Pirinççi (CSP), who did not apply the intervention, using a computer program. A researcher (EC) performed the assessments and treatments in this study. The participants were blinded to the group allocation.
Age, gender, height, weight, body mass index (BMI), and dominant extremity were recorded. MLD was applied to both extremities of the participants (a total of 164 upper extremities). Before and after MLD, the same physiotherapist performed pressure pain threshold (PPT) measurements, hand dynamometer (Jamar) and pinchmeter evaluations (Baseline), and tactile sensation evaluation with an esthesiometer.
Inclusion criteria
Exclusion criteria
Procedures
MANUAL LYMPHATIC DRAINAGE (MLD)
MLD was limited to the upper extremities. During the MLD application, when the volunteers were in the supine hook position, blood hemodynamics and lower extremity motor function were increased through active bilateral shoulder rotation combined with breathing after first effleurage. Cervical lymph nodes were stimulated. The suction power in the thoracic duct was increased with breathing exercises. After the stimulation of central lymph nodes, the axillo-axillary collateral path was activated by stimulating the axillary lymph nodes in the contralateral region, and axillo-inguinal lymph nodes were activated by stimulating inguinal lymph nodes in the ipsilateral region. Then, upper extremity drainage was applied to the participants in this position. Following the drainage of the proximal part of the upper extremity, it was distally proceeded. The lymph fluid was drained by returning from the distal to the proximal and moved to axillary and inguinal lymph nodes through collateral pathways. The MLD session took an average of 30 min for each volunteer9.
-
9Földi's Textbook of Lymphology:for Physicians and Lymphedema Therapists, 2012
SHAM MANUAL LYMPHATIC DRAINAGE (MLD)
Similar to the MLD group, the physiotherapist applied random soft touches to similar areas. The touches were not in the order appropriate to any manual technique. Treatment duration and frequency for individuals in the sham MLD group were quite similar to their counterparts in the MLD group.
Outcome measures
PRESSURE PAIN THRESHOLD (PPT) AND PAIN TOLERANCE MEASUREMENT
Quantitative PPT measurements were performed using a 1-cm2 surface algometer (Baseline, USA), which was found to be valid and reliable by previous studies10. This algometer consists of a metal piston attached to a dial that can measure pressure in kilograms (kg) and pounds (Lb). The algometer was positioned vertically and placed on the thenar, hypothenar, mid-ulnar, and biceps regions using the marked points. Measurements were repeated 3 times with a rest period of 10 s. The average of these three measurements was used for analysis. Pain tolerance was measured once at the same points. The highest tolerable pressure was used in the measurement and it was recorded.
-
10Reliability of the pressure algometer as a measure of myofascial trigger point sensitivityPain, 1986
EVALUATION OF HAND AND FINGER GRIP STRENGTH
The Jamar dynamometer recommended by the American Association of Hand Therapists was used to measure hand grip strength. A pinchmeter (Baseline) was used to measure finger grip strength. Hand grip and finger grip strength was measured using the recommended standard position, with the patients sitting, with their shoulders in adduction, elbows in 90° flexion and mid-rotation, and wrists in neutral position. Three measurements were made at 1-min intervals, and the average values were recorded11,12.
-
11Effects of a physical therapy program combined with manual lymphatic drainage on shoulder function, quality of life, lymphedema incidence, and pain in breast cancer patients with axillary web syndrome following axillary dissectionSupport Cancer Ther, 2016
-
12The effect of wrist and arm postures on peak pinch strengthJ Hum Ecol (Tokyo), 1996
TWO-POINT DISCRIMINATION (2PD)
This evaluation was performed using an esthesiometer (Instrument Company, Lafayette, IN, USA), with the participants in the sitting position with their eyes closed. Evaluation was made from the biceps medial to the elbow13. Starting from the range where two points could be easily distinguished, the distance between the two points was reduced in 1-mm increments until the two points were felt as one point. Then, starting with two-point stimulation at the minimum interval that was felt as a single point, the distance between the two points was increased in 1-mm intervals until the distance between the two points was felt separately as two points again. The contact time of the two-point stimulation was adjusted to be approximately 1-2 s, and approximately 3-5 s was waited between each stimulation. The shortest distance felt between two points provided the static 2PD value.
-
13Comparisons of changes in the two-point discrimination test following muscle fatigue in healthy adultsJ Phys Ther Sci, 2015
Statistical analysis
G*Power software package (G*Power, Version 3.0.10, Franz Faul, Universität Kiel, Germany) was used to calculate the sample size. Ten participants from each group were randomly recruited for the pilot study. The effect size corresponding to this value was 0.632. It was calculated that to achieve 80% power with α = 0.05 type I error, 41 patients were required for each group. Frequency tables and descriptive statistics were used to interpret the findings. The conformity of the variables to the normal distribution was examined using visual (histogram and probability graphs) and analytical (Shapiro-Wilk test) methods. Related-samples t-test (Wilcoxon test) was used to evaluate the parameters that did not show a normal distribution and the paired-samples t-test was used to evaluate the parameters with a normal distribution within the groups. In the intergroup evaluations, Mann-Whitney U-test was used for the data that did not show normal distribution. The effect size (d) was calculated by Cohens guidelines. In all statistics, p significance value was accepted as p < 0.05. Statistical analyses were performed using IBM SPSS Statistics version 24.0 package 61 (IBM Corp. Released 2016. IBM SPSS Statistics for Windows, Version 24.0. Armonk, NY: IBM Corp.).
Results
A total of 82 (MLD group: 41, Sham group: 41) people participated in the study. No side effects were observed in participant during and after application. There was no loss during the study (Fig. 1). Age, height, weight, BMI, gender, and dominant extremity of the participants showed similar characteristics (p > 0.05). Changes of the participants demographic data are shown in table 1.
Thumbnail
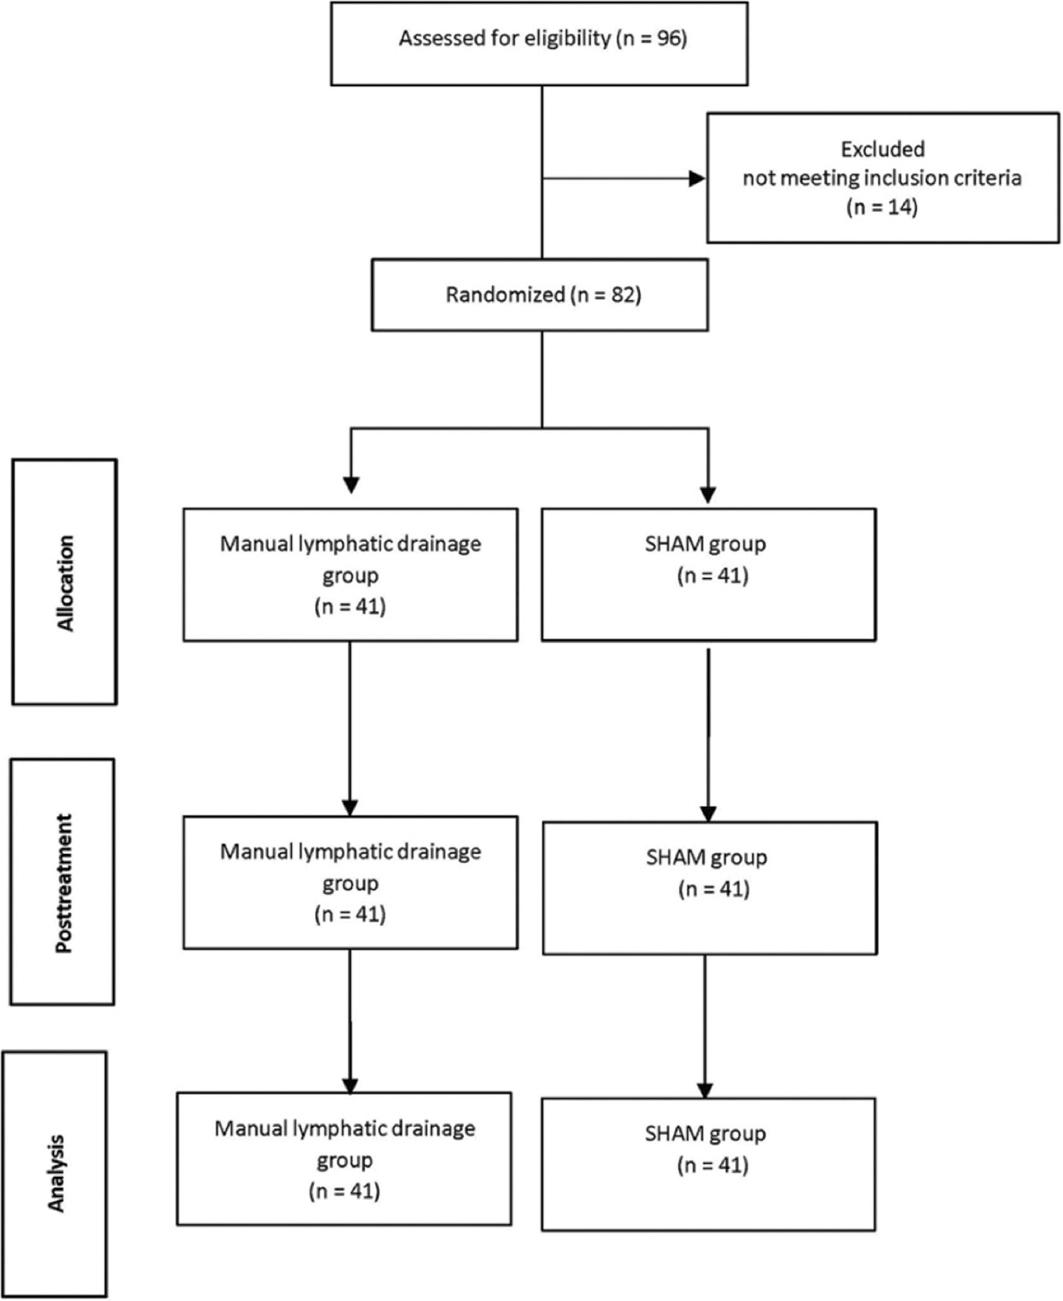
Figure 1
CONSORT flow diagram.
CONSORT flow diagram.
Table 1
Demographic data of the participants
Demographic data of the participants
| Variables | MLD Group (n = 41) | Sham group (n = 41) | x2, z | p | ||
|---|---|---|---|---|---|---|
| X ± SD | n (min-max) | X ± SD (n = 41) | n (min-max) | |||
| Age (years) | 20.07 ± 1.52 | 20 (18.24) | 19.97 ± 1.90 | 19 (18.25) | −0.919 | 0.358 |
| Height (cm) | 166.61 ± 8.05 | 165 (153-186) | 169.73 ± 7.87 | 168 (158-186) | −1.779 | 0.075 |
| Weight (kg) | 64.27 ± 12.11 | 62 (42-95) | 63.43 ± 13.69 | 65 (45-89) | −0.605 | 0.545 |
| BMI (kg/m²) | 23.02 ± 3.12 | 22.67 (17.94-31.02) | 21.78 ± 3.15 | 21.95 (18-28.41) | −1.648 | 0.099 |
| Gender | ||||||
| Male | 14 | 34.1 | 20 | 48.8 | 1.809 | 0.179 |
| Female | 27 | 65.9 | 21 | 51.2 | ||
| Dominant extremity | ||||||
| Right | 33 | 80.5 | 28 | 68.3 | 1.6 | 0.206 |
| Left | 8 | 19.5 | 13 | 31.7 | ||
In the comparison between the groups, all the parameters were similar before the therapy (p > 0.05). There was a difference hypothenar PPT (p = 0.038) and pain tolerance (p = 0.009), thenar PPT (p = 0.021) and pain tolerance (p = 0.001), mid-ulnar PPT (p = 0.028), biceps PPT (p < 0.001), and pain tolerance (p < 0.001) between the groups after the therapy. In the MLD group, all parameters changed after the treatment (p < 0.05). In SHAM group, hypothenar PPT (p = 0.008), mid-ulnar pain tolerance (p = 0.007), and biceps pain tolerance (p = 0.005) changed after the treatment. Changes in PPT and pain tolerance are shown in table 2.
Table 2
Changes in PPT and pain tolerance
Changes in PPT and pain tolerance
| Variables | Variables | MLD Group (n = 82) | Sham group (n = 82) | z | p | d | ||
|---|---|---|---|---|---|---|---|---|
| Mean ± SD | Median (min-max) | Mean ± SD | Median (Min-Max) | |||||
| Hypothenar | BT-PPT | 6.54 ± 2.28 | 6 (3-14) | 6.06 ± 2.49 | 6 (3-12) | −1.828 | 0.068 | |
| AT-PPT | 5.60 ± 2.27 | 5 (2-13) | 6.40 ± 2.48 | 6 (3-12) | −2.075 | 0.038 | 0.336 | |
| t, z | −3.301 | −2.668 | ||||||
| p | 0.001 | 0.008 | ||||||
| d | 0.413 | 0.136 | ||||||
| BT-pain tolerance | 10.82 ± 5.13 | 10 (3-30) | 10.34 ± 4.82 | 9.75 (5-30) | −0.670 | 0.503 | ||
| AT-pain tolerance | 8.62 ± 3.37 | 8 (2-17) | 10.73 ± 5.22 | 10 (3-30) | −2.621 | 0.009 | 0.480 | |
| t, z | −4.496 | −1.178 | ||||||
| p | < 0.001 | 0.239 | ||||||
| d | 0.057 | 0.077 | ||||||
| Thenar | BT-PPT | 6.54 ± 2.72 | 6 (2-15) | 6.13 ± 2.12 | 6 (2-14) | −0.678 | 0.498 | |
| AT-PPT | 6.52 ± 7.22 | 5 (2-55) | 6.16 ± 2.11 | 6 (2-14) | −2.300 | 0.021 | 0.067 | |
| t, z | −3.174 | −1.633 | ||||||
| p | 0.002 | 0.102 | ||||||
| d | 0.003 | 0.014 | ||||||
| BT-Pain tolerance | 9.43 ± 3.95 | 8.75 (4-25) | 9.18 ± 3.37 | 8.75 (4-20) | −0.187 | 0.852 | ||
| AT-Pain tolerance | 7.29 ± 2.74 | 7 (2-16) | 9.07 ± 3.40 | 8.5 (4-20) | −3.383 | 0.001 | 0.576 | |
| t, z | −4.885 | −1.807 | ||||||
| p | < 0.001 | 0.071 | ||||||
| d | 0.629 | 0.032 | ||||||
| Mid-Ulnar | BT-PPT | 5.77 ± 2.18 | 5 (1-13) | 5.54 ± 1.92 | 5 (1-12) | −0.577 | 0.564 | |
| AT-PPT | 5 ± 1.80 | 5 (2-13) | 5.44 ± 1.93 | 5 (1-12) | −2.193 | 0.028 | 0.235 | |
| t, z | −2.795 | −1.841 | ||||||
| p | 0.005 | 0.066 | ||||||
| d | 0.385 | 0.051 | ||||||
| BT-Pain tolerance | 8.68 ± 3.04 | 8 (4-16) | 8.21 ± 2.85 | 8 (4-15) | −1.049 | 0.294 | ||
| AT-Pain tolerance | 7.55 ± 2.72 | 7 (2-15) | 7.90 ± 2.67 | 8 (4-15) | −0.791 | 0.429 | 0.129 | |
| t, z | −3.620 | −2.692 | ||||||
| p | < 0.001 | 0.007 | ||||||
| d | 0.391 | 0.112 | ||||||
| Biceps | BT-PPT | 5.22 ± 1.66 | 5 (2-10) | 5.49 ± 1.77 | 5 (2-12) | −0.89 | 0.373 | |
| AT-PPT | 4.36 ± 1.62 | 4 (1-9) | 5.30 ± 1.86 | 5 (2-12) | −3.751 | < 0.001 | 0.538 | |
| t, z | −4.178 | −1.897 | ||||||
| p | < 0.001 | 0.058 | ||||||
| d | 2.626 | 0.104 | ||||||
| BT-Pain tolerance | 7.82 ± 2.79 | 7.75 (3-15) | 8.06 ± 2.74 | 8 (3.5-15) | −0.556 | 0.578 | ||
| AT-Pain tolerance | 5.89 ± 2.46 | 5 (2-13) | 7.71 ± 2.80 | 8 (3.5-15) | −4.201 | < 0.001 | 3.341 | |
| t, z | −5.282 | −2.823 | ||||||
| p | < 0.001 | 0.005 | ||||||
| d | 0.733 | 0.126 | ||||||
In the comparison between the groups, all the parameters were similar before the treatment (p > 0.05). There was a difference grip strength (p = 0.030) between the groups after the treatment. In the MLD group, all parameters changed after the treatment (p < 0.05). In SHAM group, grip strength (p = 0.008 changed after the treatment. Changes in muscle strength and 2PD are shown in table 3.
Table 3
Changes in muscle strength and two-point discrimination
Changes in muscle strength and two-point discrimination
| Variables | MLD Group (n = 82) | Sham Group (n = 82) | z | p | d | ||
|---|---|---|---|---|---|---|---|
| Mean ± SD | Median (min-max) | Mean ± SD | Median (min-max) | ||||
| BT-Grip strength | 29.20 ± 9.68 | 26.6 (16.3-58.3) | 28.36 ± 9.70 | 26.45 (11-55) | −0.406 | 0.685 | |
| AT-Grip strength | 25.70 ± 9.31 | 21.6 (10-46) | 28.06 ± 9.55 | 25.80 (11-55) | −2.169 | 0.030 | 0.250 |
| t, z | −6.738 | −2.668 | |||||
| P | < 0.001 | 0.008 | |||||
| D | 0.368 | 0.031 | |||||
| BT-Pinch Strength | 4.34 ± 1.71 | 4.1 (1.6-9.6) | 4.19 ± 1.70 | 4 (1.6-9) | −0.628 | 0.530 | |
| AT-Pinch Strength | 3.84 ± 1.47 | 3.55 (1.5-7.6) | 4.04 ± 1.73 | 3.6 (1.6-9) | −0.313 | 0.754 | 0.124 |
| t, z | −3.375 | −1.728 | |||||
| P | 0.001 | 0.084 | |||||
| D | 0.340 | 0.087 | |||||
| BT-Two-point discrimination | 13.97 ± 2.10 | 15 (1-15) | 13.59 ± 2.35 | 14 (1-15) | −1.452 | 0.146 | |
| AT-Two-point discrimination | 13.54 ± 1.84 | 14 (8-18) | 13.85 ± 1.37 | 14 (9-15) | −0.703 | 0.482 | 0.191 |
| t, z | −2.563 | −0.885 | |||||
| P | 0.010 | 0.376 | |||||
| D | 0.217 | 0.135 | |||||
When comparison was made between the groups at baseline and after the treatment all were found to differ (Table 4).
Table 4
Comparison of differences between groups at baseline and after treatment
Comparison of differences between groups at baseline and after treatment
| Variables | MLD group (n = 82) | Sham group (n = 82) | z | p | d | ||
|---|---|---|---|---|---|---|---|
| Mean ± SD | Median (Min-Max) | Mean ± SD | Median (Min-Max) | ||||
| Hypotenar PPT | −0.93 ± 2.67 | −1 (−9-6.5) | 0.34 ± 1.11 | 0 (0-5.5) | −5.161 | < 0.001 | 0.621 |
| Hypotenar pain tolerance | −2.20 ± 4.51 | −2 (−20-7) | 0.39 ± 2.89 | 0 (−2-25) | −5.858 | < 0.001 | 0.683 |
| Thenar PPT | −0.02 ± 7.50 | −1 (−10-49) | 0.03 ± 0.16 | 0 (0-1) | −4.09 | < 0.001 | 0.009 |
| Thenar pain tolerance | −2.14 ± 3.91 | −2 (−19-4) | −0.10 ± 0.54 | 0 (−3-1) | −4.893 | < 0.001 | 0.730 |
| Mid-ulnar PPT | −0.77 ± 2.21 | −1 (−7-4) | −0.09 ± 0.51 | 0 (−4-0) | −2.551 | 0.011 | 0.423 |
| Mid-ulnar pain tolerance | −1.13 ± 2.57 | −1 (−9-4) | −0.31 ± 0.97 | 0 (−4-0) | −2.561 | 0.010 | 0.422 |
| Biceps PPT | − | −1 (−6-4) | −0.18 ± 0.91 | 0 (−5-1.5) | −4.188 | < 0.001 | 0.474 |
| Biceps pain tolerance | −1.93 ± 2.72 | −2 (−9-5) | −0.34 ± 1.03 | 0 (−5-0) | −5.631 | < 0.001 | 0.773 |
| Grip strength | −3.50 ± 4.13 | −2.65 (−17-8) | −0.30 ± 0.99 | 0 (−6-0) | −7.771 | < 0.001 | 1,06 |
| Pinch strength | −0.49 ± 1.31 | −0.3 (−5-2.9) | −0.15 ± 0.79 | 0 (−3.5-2) | −3.24 | 0.001 | 0.314 |
| Two-point discrimination | −0.42 ± 2.67 | 0 (−7-13) | 0.26 ± 1.64 | 0 (−2-8) | −2.797 | 0.005 | 0.306 |
Discussion
On completion of the study, we conducted with healthy young adults, we found that MLD caused a decrease in PPT and pain tolerance, reduced grip and pinch strength, and increased their tactile sensation in 2PD.
MLD is part of complex decongestive therapy, which is considered as the gold standard in the treatment of lymphedema14. In the past decade, the efficacy of MLD on edema and pain has been investigated in different patient groups. In a study including MLD in exercise therapy for complex regional pain syndrome, Uher et al. reported that MLD improved pain, edema, and range of motion, but the results were similar to the exercise-only group15. Similarly, Kim (2014) found that MLD had a curative effect on pain, but this was not statistically significant. The author also noted that PPT significantly increased after MLD treatment8. There are also studies showing that the increase in PPT and pain tolerance has clinical significance16.
-
14Comparison of the effectiveness of complex decongestive therapy and compression bandaging as a method of treatment of lymphedema in the elderlyClin Interv Aging, 2018
-
15Comparison of manual lymph drainage with physical therapy in complex regional pain syndrome, type I. A comparative randomized controlled therapy studyWien Klin Wochenschr, 2000
-
8Effects of manual lymph drainage on the activity of sympathetic nervous system, anxiety, pain, and pressure pain threshold in subjects with psychological stressPhys Ther Korea, 2014
-
16Does manual lymphatic drainage have any effect on pain threshold and tolerance of different body parts?Lymphat Res Biol, 2019
The effect of MLD on pain can be explained by different theories: MLD nociceptive receptors can increase parasympathetic responses by reducing sympathetic nervous system activation through rhythmic stimulation. According to the gate control theory of pain, MLD can reduce the activity of A delta and C fibers through the soft touches that it contains or it can regulate pain intensity by helping increase neurotransmitter release8,17,18.
-
8Effects of manual lymph drainage on the activity of sympathetic nervous system, anxiety, pain, and pressure pain threshold in subjects with psychological stressPhys Ther Korea, 2014
-
17Changes in edema, pain, or range of motion following manual edema mobilization:a single-case design studyJ Hand Ther, 2008
-
18Outcomes with additional manual lymphatic drainage to rehabilitation protocol in primary total knee arthroplasty patients:preliminary clinical resultsSDÜSağlık Bilimleri Derg, 2021
Contrary to the literature, in the present study, we found that MLD caused a significant decrease in PPT and pain tolerance. This may be due to the criteria that we used in sample selection. We only included individuals with a pain level of < 1 according to the Visual Analog Scale, which may actually be evidence that the pain-reducing mechanisms of these individuals were deactivated. We consider that this mechanism of action of MLD on pain has not yet been explained.
The results we obtained from the 2PD evaluation indicate that MLD may have increased sensitivity in fibers carrying pressure sensation. Static 2PD assessment tests the slowly adapting type I afferent Aβ fiber system in the skin and is received by Merkel receptors. While only myelinated thick afferents were previously considered to be tactile sensory receptors, recent studies have shown that C fibers also contribute to tactile sensation. These are unmyelinated low-threshold C afferents that respond strongly to the pleasant sensation caused by a light and soft touch19. C afferents carrying delayed pain20 may make the skin sensitive to touch by acting as tactile receptors for pleasant touches in the absence of pain. Thus, increased tactile sensitivity may heighten the pressure21 factor based on the working mechanism of the algometer. We consider that in painless and healthy tissue that becomes sensitive to pressure, this may cause a decrease in PPT and pain tolerance.
-
19The neurophysiology of unmyelinated tactile afferentsNeurosci Biobehav Rev, 2010
-
20Selective activation of primary afferent fibers evaluated by sine-wave electrical stimulationMol Pain, 2005
-
21Deformation and pressure propagation in deep somatic tissue during painful cuff algometryEur J Pain, 2015
MLD generally provides an increase in muscle strength when used in cases that develop lymphedema after cancer. An increase in muscle strength with increased function as a result of reduced edema is an expected result11. It has been reported that MLD supports the regeneration of muscle strength in the post-exercise period in athletes engaged in Far Eastern sports, MLD has been suggested to be one of the important elements of therapeutic methods to reduce the risk of injury22. However, these studies reporting improvement in muscle strength performed evaluations in the regeneration period. In studies investigating classical massage applications, massage is not recommended before performance because it may reduce performance in activities, such as sprinting and vertical jumping, that require muscle strength23. Massage, whether superficial or deep, affects neuromotor and neuromuscular components and changes the internal tension of structures24. In our study, grip and pinch strength significantly decreased after MLD, which may be due to the reaction of muscles to changes in internal tension or the increase in muscle relaxation as a result of heightened parasympathetic responses with the suppression of the sympathetic system8. Increased parasympathetic activity may have caused a decrease in readiness for action.
-
11Effects of a physical therapy program combined with manual lymphatic drainage on shoulder function, quality of life, lymphedema incidence, and pain in breast cancer patients with axillary web syndrome following axillary dissectionSupport Cancer Ther, 2016
-
22Effect of physical methods of lymphatic drainage on postexercise recovery of mixed martial arts athletesClin J Sport Med, 2019
-
23Is pre-performance massage effective to improve maximal muscle strength and functional performance?A systematic reviewInt J Sports Phys Ther, 2018
-
24Massage acutely increased muscle strength and power forceJ Exerc Physiol Online, 2019
-
8Effects of manual lymph drainage on the activity of sympathetic nervous system, anxiety, pain, and pressure pain threshold in subjects with psychological stressPhys Ther Korea, 2014
Conclusion
MLD applied to healthy individuals causes a decrease in muscle strength. However, it enhances tactile sensation and results in increased sensitivity in 2PD. It reduces PPT and pain tolerance. In this case, MLD can be thought that the activity in pain and sensory receptors increases. The decrease in muscle strength emphasizes the reducing effect of MLD on the internal tension of the muscle. Based on these findings, the clinical usage areas of MLD can be rearranged.
Limitations
Due to the similar ages of the participants, we only evaluated a certain age group. The use of this method in different populations may show age-related variations in terms of efficacy. In addition, laboratory studies should be included in the future to make the results more objective.
References
-
1Johnson G. Dr Vodder's manual lymph drainage. A practical guide. NZJ Physiother. 2011;39:103-4. Links
-
2Bakar Y, Berdici B, Şahin N, Pala ÖO. Lymphedema after breast cancer and its treatment. J Breast Health. 2014;10:6-14. Links
-
3Ezzo J, Manheimer E, McNeely ML, Howell DM, Weiss R, Johansson KI, et al. Manual lymphatic drainage for lymphedema following breast cancer treatment. Cochrane Database Syst Rev. 2015;2015:CD003475. Links
-
4Provencher AM, Giguere-Lemieux E, Croteau E, Ruchat SM, Corbin-Berrigan LA. The use of manual lymphatic drainage on clinical presentation of musculoskeletal injuries:A systematic review. Complement Ther Clin Pract 2021;45:101469. Links
-
5Pichonnaz C, Bassin JP, Lécureux E, Christe G, Currat D, Aminian K, et al. Effect of manual lymphatic drainage after total knee arthroplasty:a randomized controlled trial. Arch Phys Med Rehabil. 2016;97:674-82. Links
-
6Ekici G, Bakar Y, Akbayrak T, Yuksel I. Comparison of manual lymph drainage therapy and connective tissue massage in women with fibromyalgia:a randomized controlled trial. J Manipulative Physiol Ther. 2009;32:127-33. Links
-
7Schingale FJ, Esmer M, Küpeli B, Ünal D. Investigation of the less known effects of manual lymphatic drainage:a narrative review. Lymphat Res Biol. 2022;20:7-10. Links
-
8Kim SJ. Effects of manual lymph drainage on the activity of sympathetic nervous system, anxiety, pain, and pressure pain threshold in subjects with psychological stress. Phys Ther Korea. 2014;26:391-7. Links
-
9Földi M, Földi E, Strößenreuther R, Kubik S. Földi's Textbook of Lymphology:for Physicians and Lymphedema Therapists. Netherlands:Elsevier Health Sciences;2012. Links
-
10Reeves JL, Jaeger B, Graff-Radford SB. Reliability of the pressure algometer as a measure of myofascial trigger point sensitivity. Pain. 1986;24:313-21. Links
-
11Cho Y, Do J, Jung S, Kwon O, Jeon JY. Effects of a physical therapy program combined with manual lymphatic drainage on shoulder function, quality of life, lymphedema incidence, and pain in breast cancer patients with axillary web syndrome following axillary dissection. Support Cancer Ther. 2016;24:2047-57. Links
-
12Halpern CA, Fernandez JE. The effect of wrist and arm postures on peak pinch strength. J Hum Ecol (Tokyo). 1996;25:115-30. Links
-
13Han J, Park S, Jung S, Choi Y, Song H. Comparisons of changes in the two-point discrimination test following muscle fatigue in healthy adults. J Phys Ther Sci. 2015;27:551-4. Links
-
14Zasadzka E, Trzmiel T, Kleczewska M, Pawlaczyk M. Comparison of the effectiveness of complex decongestive therapy and compression bandaging as a method of treatment of lymphedema in the elderly. Clin Interv Aging. 2018;13:929-34. Links
-
15Uher EM, Vacariu, Schneider B, Fialka V. Comparison of manual lymph drainage with physical therapy in complex regional pain syndrome, type I. A comparative randomized controlled therapy study. Wien Klin Wochenschr. 2000;112:133-7. Links
-
16Keser I, Esmer M. Does manual lymphatic drainage have any effect on pain threshold and tolerance of different body parts?Lymphat Res Biol. 2019;17:651-4. Links
-
17Priganc VW, Ito MA. Changes in edema, pain, or range of motion following manual edema mobilization:a single-case design study. J Hand Ther. 2008;21:326-35. Links
-
18Cihan E, Yildirim NÜ, Bilge O, Bakar Y, Doral M. Outcomes with additional manual lymphatic drainage to rehabilitation protocol in primary total knee arthroplasty patients:preliminary clinical results. SDÜSağlık Bilimleri Derg. 2021;12:319-29. Links
-
19Olausson H, Wessberg J, McGlone F, Vallbo Å. The neurophysiology of unmyelinated tactile afferents. Neurosci Biobehav Rev. 2010;34:185-91. Links
-
20Koga K, Furue H, Rashid MH, Takaki A, Katafuchi T, Yoshimura M. Selective activation of primary afferent fibers evaluated by sine-wave electrical stimulation. Mol Pain. 2005;1:1-11. Links
-
21Manafi?Khanian B, Arendt?Nielsen L, Frøkjær JB, Graven-Nielsen T. Deformation and pressure propagation in deep somatic tissue during painful cuff algometry. Eur J Pain. 2015;19:1456-66. Links
-
22Zebrowska A, Trybulski R, Roczniok R, Marcol W. Effect of physical methods of lymphatic drainage on postexercise recovery of mixed martial arts athletes. Clin J Sport Med. 2019;29:49-56. Links
-
23Mine K, Lei D, Nakayama T. Is pre?performance massage effective to improve maximal muscle strength and functional performance?A systematic review. Int J Sports Phys Ther. 2018;13:789-99. Links
-
24Abrantes R, Nunes S, Monteiro E, Fiuza A, Cesar Cunha J, Ribeiro M, et al. Massage acutely increased muscle strength and power force. J Exerc Physiol Online. 2019;22:100-9. Links