Articles
Detection and classification of progressive supranuclear palsy from MRI images using deep learning

-
Publication dates-
August 11, 2025
February , 2024
- Article in PDF
- Article in XML
- Automatic translation
- Send this article by e-mail
- Share this article +
Abstract
A timely and reliable computer aided MR image-based evaluations is required for the detection and classification of progressive supranuclear palsy (PSP). It is a neurodegenerative ailment that is clinically difficult to identify due to a high degree of overlap in characterized symptoms. Unlike other ailments, the primary constraint regarding PSP is the limited research work in this area. The main aim of our study is to establish a generalized model by comparing traditional custom convolutional neural network and transfer learning models such as DenseNet121, ResNet50, InceptionV3, VGG16, EfficientNetB0, Xception, MobileNet and InceptionResNetV2 which are fine tuned for the detection and classification of PSP with higher accuracy rates. Existing research has primarily focused on reducing the time complexity of neural networks and has only had success with low-level features. Furthermore, obtaining a significant volume of distributed labelled data is difficult. In our research, 125 T1 protocol based high resolution MRI images of 65 PSP and 60 normal control patients were considered. The image dataset is preprocessed, normalized, and augmented before deploying them to the respective networks. The results propose that ‘InceptionResNetV2’ model can be considered as a generalized model for the detection and classification of PSP. The network offered a classification accuracy of 95%, precision of 100%, sensitivity of 92.8%, F1 score of 96.2% and a specificity of 100% which is significantly higher compared to other models considered in the study and the existing conventional ML models, thereby providing a prerequisite for significant diagnostic implementation.
Keywords::
Machine learning, transfer learning, progressive supranuclear palsy (PSP), diagnostic imaging, MRI
1. Introduction
Progressive supranuclear palsy is a neurological ailment caused primarily by tau-protein deposition because of neuron degeneration (Hauw et al., 1994; Dickson, 2011) in influential regions in brain, including the brainstem as well as the cortical regions (Dickson et al., 2010; Schofield et al., 2011). In 1964, Richardson syndrome, a mobility disease linked to PSP, was first described. There have been no viable treatments for this progressively fatal illness since then (Lamb et al., 2016). The commonly diagnosed characteristics at the beginning of the disease were gait problems, problems confined to multitasking and planning, bradykinesia, ataxic, spastic, and lack of coordination in speech, subtle character changes (disinhibition), cognitive slowing, dysphagia, and ailments in ocular movement leading to difficulty in reading and opening of eyelid (Williams & Lees, 2009). It has always been difficult to distinguish PSP symptoms from atypical parkinsonism symptoms based on clinical criteria at the time of onset. This is due to two factors: a considerable overlap in symptoms which point to atypical Parkinsonism that hasn't been fully developed (Aerts et al., 2011; Berg et al., 2015). Clinical evaluations along with MRI evaluation of the brain give higher prediction precision to distinguish PSP compared to normal clinical evaluation (Aerts et al., 2015; Meijer et al., 2011). This method includes most modern MRI techniques like FMRI (functional MRI) and diffusion weighted imaging. The improved MRI acquisition techniques help in better evaluations and estimations of atrophies in the brain thereby detecting different atypical parkinsonism (Helmich et al., 2012; Hotter et al., 2009; Meijer et al., 2013; Seppi & Poewe, 2010; Weingarten 2015). In some cases, positron emission tomography is combined with MRI (Koga et al., 2016) and unlike commercial applications where the magnetic field lie within a range of 3 Tesla, higher magnetic fields are used in the field of research thereby yielding higher resolution, producing distinct concentrations in the tissues (Blazejewska et al., 2013; Schwarz et al., 2014) acquisitions for better predictions.
-
Hauw et al., 1994Preliminary NINDS neuropathologic criteria for Steele‐Richardson‐Olszewski syndrome (progressive supranuclear palsy)Neurology, 1994
-
Dickson, 2011Neurodegeneration: The Molecular Pathology of Dementia and Movement Disorders: Second Edition, 2011
-
Dickson et al., 2010Neuropathology of variants of progressive supranuclear palsyCurrent opinion in neurology, 2010
-
Schofield et al., 2011Cortical atrophy differentiates Richardson's syndrome from the parkinsonian form of progressive supranuclear palsyMovement disorders, 2011
-
Lamb et al., 2016Progressive supranuclear palsy and corticobasal degeneration: pathophysiology and treatment optionsCurrent treatment options in neurology, 2016
-
Williams & Lees, 2009Progressive supranuclear palsy: clinicopathological concepts and diagnostic challengesThe Lancet Neurology, 2009
-
Aerts et al., 2011Diagnostic challenges in parkinsonismExpert Review of Neurotherapeutics, 2011
-
Berg et al., 2015MDS research criteria for prodromal Parkinson's diseaseMovement Disorders, 2015
-
Aerts et al., 2015Ancillary investigations to diagnose parkinsonism: a prospective clinical studyJournal of neurology, 2015
-
Meijer et al., 2011Contribution of routine brain MRI to the differential diagnosis of parkinsonism: a 3-year prospective follow-up studyJournal of neurology, 2011
-
Helmich et al., 2012Cerebral causes and consequences of parkinsonian resting tremor: a tale of two circuits?Brain, 2012
-
Hotter et al., 2009Potential of advanced MR imaging techniques in the differential diagnosis of parkinsonismMovement Disorders, 2009
-
Meijer et al., 2013Update on diffusion MRI in Parkinson's disease and atypical parkinsonismJournal of the neurological sciences, 2013
-
Seppi & Poewe, 2010Brain magnetic resonance imaging techniques in the diagnosis of parkinsonian syndromesNeuroimaging Clinics, 2010
-
Weingarten 2015Neuroimaging of Parkinson's disease: Expanding viewsNeuroscience & Biobehavioral Reviews, 2015
-
Koga et al., 2016Cerebellar ataxia in progressive supranuclear palsy: an autopsy study of PSP‐CMovement Disorders, 2016
-
Blazejewska et al., 2013Visualization of nigrosome 1 and its loss in PD: pathoanatomical correlation and in vivo 7 T MRINeurology, 2013
-
Schwarz et al., 2014The ‘swallow tail’appearance of the healthy nigrosome-a new accurate test of Parkinson's disease: a case-control and retrospective cross-sectional MRI study at 3TPloS one, 2014
The morphological abnormalities featured in the mid-brain have always proved to be an important biological marker for clinical diagnosis (Massey et al., 2013; Quattrone et al., 2008; Schulz et al.,1999). These morphological midbrain atrophies are treated as biological markers. Some atrophies exhibit the morphological shapes which portray the shape of a Hummingbird’s head, they are known as ‘hummingbird sign’ or ‘penguin sign’ (Kato et al., 2003). Another morphological atrophies that are usually portrayed are ‘Mickey-Mouse’ and ‘Morning-glory’ (Adachi et al., 2004; Massey et al., 2012). Mostly patients with other atypical parkinsonism exhibit no midbrain atrophy and do not show these radiological signs. Considering the regions of brain especially the areas of mid-brain, its highly apparent that symptomatically the accuracy of identifying PSP-Richardson phenotype from other atypical disorders and normal cohort is always on the higher side (Cosottini et al., 2007; Oba et al., 2005; Zanigni et al., 2016), considering midbrain diameter (Cosottini et al., 2007; Schrag et al., 2000) and volumes (Paviour et al., 2006) and visual assessments. Even though the main approved MRI based estimation utilized in clinical routine with regards to PSP and other atypical parkinsonism’s is the manual morphometric evaluation using traditional MRI, this procedure is tedious, time consuming, efficiency subject to the examiners involvement and is always restricted to limited and specific areas of interest. (Salvatore et al., 2014). Hence, the implementation and execution of programmed automatic classification methods like machine learning techniques and strategies proved to be essential for improving clinical administration of neurological patients.
-
Massey et al., 2013The midbrain to pons ratio: a simple and specific MRI sign of progressive supranuclear palsyNeurology, 2013
-
Quattrone et al., 2008MR imaging index for differentiation of progressive supranuclear palsy from Parkinson disease and the Parkinson variant of multiple system atrophyRadiology, 2008
-
Schulz et al.,1999Magnetic resonance imaging-based volumetry differentiates idiopathic Parkinson's syndrome from multiple system atrophy and progressive supranuclear palsyAnnals of Neurology: Official Journal of the American Neurological Association and the Child Neurology Society, 1999
-
Kato et al., 2003Study of the rostral midbrain atrophy in progressive supranuclear palsyJournal of the neurological sciences, 2003
-
Adachi et al., 2004Morning glory sign: a particular MR finding in progressive supranuclear palsyMagnetic Resonance in Medical Sciences, 2004
-
Massey et al., 2012Conventional magnetic resonance imaging in confirmed progressive supranuclear palsy and multiple system atrophyMovement disorders, 2012
-
Cosottini et al., 2007Assessment of midbrain atrophy in patients with progressive supranuclear palsy with routine magnetic resonance imagingActa neurologica Scandinavica, 2007
-
Oba et al., 2005New and reliable MRI diagnosis for progressive supranuclear palsyNeurology, 2005
-
Zanigni et al., 2016Accuracy of MR markers for differentiating progressive supranuclear palsy from Parkinson's diseaseNeuroImage: Clinical, 2016
-
Cosottini et al., 2007Assessment of midbrain atrophy in patients with progressive supranuclear palsy with routine magnetic resonance imagingActa neurologica Scandinavica, 2007
-
Schrag et al., 2000Differentiation of atypical parkinsonian syndromes with routine MRINeurology, 2000
-
Paviour et al., 2006Regional brain volumes distinguish PSP, MSA‐P, and PD: MRI‐based clinico‐radiological correlationsMovement disorders: official journal of the Movement Disorder Society, 2006
-
Salvatore et al., 2014Machine learning on brain MRI data for differential diagnosis of Parkinson's disease and Progressive Supranuclear PalsyJournal of neuroscience methods, 2014
Machine learning techniques assist doctors by detecting disease growth, propagation, and customizing medicines and treatments to each patient's needs. The definitive diagnosis, which is defined by certain imaging instruments that aid in determining the subtype of a disease, is often the determining factor in prognosis. However, deciding the best classifier and grouping technique to produce the most accurate and high accuracy result is a major undertaking. Furthermore, it must be remembered that not all characteristics are considered when assessing the disease and its stages of propagation. Deep learning models have always portrayed impressive accuracy in medical based image classification procedures. They can automatically learn relevant features from the data, allowing them to achieve high performance in discriminating between different classes (Lecun et al., 2015). These models could adapt and bring out complex traits automatically from medical images, eliminating the requirement for manual feature engineering. This minimizes the amount of manual labelling and improves the model's capacity to identify patterns in the data (Litjens et al., 2017). The convolutional neural networks (CNNs) as well as recurrent neural networks (RNNs), have demonstrated exceptional accuracy and sensitivity in identifying and categorizing different types of brain disorders which may include complex patterns in MRI scans, wherein they have implemented residual and simple 3D convolutional neural network architectures, which provided comparable performances by eliminating the feature extraction phases. (Korolev et al., 2017). Automated brain segmentation and localization tasks employ deep learning models, enabling accurate assessment of the structures and areas of the brain. This gives us the ability to quantify brain problems using morphometric characteristics and offers more precise measures for clinical evaluation, similarly in another study (Moeskops et al., 2016) It has been proposed that deep neural networks be used for automated segmentation of MR brain scans into different tissue types. Different imaging sequences are used to acquire MRI brain scans. Improved diagnosis accuracy results from deep learning models' ability to manage multi-modal input and integrate information from several sequences. Deep learning models can offer quantitative evaluations of the diseases and brain structures, allowing for specific tracking of the development of a disease over time. Monitoring neurodegenerative illnesses and assessing the efficacy of therapies need this longitudinal approach (Zhu et al., 2018) deep learning algorithms can recognize imaging biomarkers linked to certain neurological diseases. These biomarkers can help with early diagnosis and risk assessment, which may result in patient-specific therapy sessions.
-
Lecun et al., 2015Deep learningnature, 2015
-
Litjens et al., 2017A survey on deep learning in medical image analysisMedical image analysis, 2017
-
Korolev et al., 2017Residual and plain convolutional neural networks for 3D brain MRI classification, 2017
-
Moeskops et al., 2016Automatic segmentation of MR brain images with a convolutional neural networkIEEE transactions on medical imaging, 2016
-
Zhu et al., 2018Image reconstruction by domain-transform manifold learningNature, 2018
Limited research has examined pattern-based classification with the application machine based and deep neural network-based techniques in PSP related ailments using MR images. Most studies lacked either primary data or identification and classification accuracy. In certain trials, volumetric values of various brain areas were used to detect the disease. (Massey et al., 2013). Even though feature extraction methods differed between studies, most of them used SVM models to define and classify PSP. Some studies introduced “Voxel based morphometry-VBM” (Ashburner & Friston, 2000; Cherubini et al., 2013; Focke et al., 2011) which is a proposed method employed to evaluate the patterns of brain atrophy by making use of the difference in tissue concentration in the brain (Beyer et al., 2006; Burton et al., 2004; Feldmann et al., 2008; Nagano-Saito et al., 2005; Ramírez-Ruiz et al., 2005; Summerfield et al., 2005). Voxel-based morphometric tests on grey and white matter were used in studies (Archer et al., 2019; Cherubini et al., 2013; Mueller et al., 2017; Talai et al., 2019), preceded by SVM classification yielded 80% accuracies. The main constraint with respect to the VBM based approaches were with respect to distinguishing the diseased cohort from the normal cohort, most of the works were dependent on clinical evaluation, the evaluations may have effects on medication and most of the studies had minimal cohort. The pattern recognition methods utilizing this technique helped in evaluating the corresponding volumetric changes in white matter, mid-brain, and gray matter for predicting PSP cases from other atypical disorders and its own phenotypes (Gröschel et al., 2004). In a companion study conducted by Salvatore et al. (2014) an automated supervised machine learning algorithm was developed to classify PSP cases. The algorithm was developed by the combination of PCA (principal component analysis) utilized in extracting the features from the images which then is followed by SVM classifier which yielded a prediction precision in the range of 90%. The developed algorithm emphasized the characterization of atrophy in certain regions of the brain namely pons, callosal commissure, mid-brain, and thalamus. Another research study utilized a multi class probabilistic approach (Marquand et al., 2013) were they attained high precision in the range of 90% but the major drawback was that they considered only SCP atrophy, and the sample size was small. The main limitation with this study was that the cohort was in minimal amount. Another study (Scherfler et al., 2016) followed a volume-based analysis making use of a decision tree algorithm and had a better precision but the major limitation was that the cases considered were only in final phase and the study was focused on a typical age group and for a prescribed period only. In another research (Bhattacharya et al., 2019), texture-based analysis of brain regions was used to detect PSP, preceded by SVM classification. In research (Pyatigorskaya et al., 2019), a region of interest-based approach was used to detect PSP, preceded by a logistic regression model for classification which yielded 85% accuracy. The major limitation to this was that the study relied on clinical gate evaluation scale and the cohort was minimal. Another study (Sarica et al., 2013) proposed a classification based on morphological data using stacking techniques and employed a naive bayes classifier for prediction. The limitation to this study was that the whole accuracy was dependent on additional tests which were to be done based on stacking techniques. In another study (Surova et al., 2015), diffusional parameters diffusivity values and fractional anisotropy were utilized for SVM model classification. The limitation to this study was that it relied on diffusion-based tensor imaging that relied on tractography which in turn would get adversely effected because of medications. A CNN network is established in research (Kiryu et al., 2019) where feature maps are created by convolution filters for the classifying PSP from other ailments.
-
Massey et al., 2013The midbrain to pons ratio: a simple and specific MRI sign of progressive supranuclear palsyNeurology, 2013
-
Ashburner & Friston, 2000Voxel-based morphometry-the methodsNeuroimage, 2000
-
Cherubini et al., 2013Magnetic resonance support vector machine discriminates between Parkinson disease and progressive supranuclear palsyMovement Disorders, 2013
-
Focke et al., 2011Individual voxel‐based subtype prediction can differentiate progressive supranuclear palsy from idiopathic Parkinson syndrome and healthy controlsHuman brain mapping, 2011
-
Burton et al., 2004Cerebral atrophy in Parkinson’s disease with and without dementia: a comparison with Alzheimer’s disease, dementia with Lewy bodies and controlsBrain, 2004
-
Feldmann et al., 2008Morphometric changes of gray matter in Parkinson's disease with depression: A voxel‐based morphometry studyMovement Disorders, 2008
-
Nagano-Saito et al., 2005Cerebral atrophy and its relation to cognitive impairment in Parkinson diseaseNeurology, 2005
-
Ramírez-Ruiz et al., 2005Longitudinal evaluation of cerebral morphological changes in Parkinson's disease with and without dementiaJournal of neurology, 2005
-
Summerfield et al., 2005Structural brain changes in Parkinson disease with dementia: a voxel-based morphometry studyArchives of neurology, 2005
-
Archer et al., 2019Development and validation of the automated imaging differentiation in parkinsonism (AID-P): a multicentre machine learning studyThe Lancet Digital Health, 2019
-
Cherubini et al., 2013Magnetic resonance support vector machine discriminates between Parkinson disease and progressive supranuclear palsyMovement Disorders, 2013
-
Mueller et al., 2017Disease-specific regions outperform whole-brain approaches in identifying progressive supranuclear palsy: a Multicentric MRI StudyFrontiers in neuroscience, 2017
-
Talai et al., 2019Improved automatic morphology-based classification of Parkinson’s disease and progressive supranuclear palsyClinical Neuroradiology, 2019
-
Gröschel et al., 2004Magnetic resonance imaging-based volumetry differentiates progressive supranuclear palsy from corticobasal degenerationNeuroimage, 2004
-
Salvatore et al. (2014)Machine learning on brain MRI data for differential diagnosis of Parkinson's disease and Progressive Supranuclear PalsyJournal of neuroscience methods, 2014
-
Marquand et al., 2013Automated, high accuracy classification of parkinsonian disorders: a pattern recognition approachPloS one, 2013
-
Scherfler et al., 2016Diagnostic potential of automated subcortical volume segmentation in atypical parkinsonismNeurology, 2016
-
Bhattacharya et al., 2019Structural MRI based texture analysis of corpus callosum in patients with Progressive Supraneuclear Palsy, 2019
-
Sarica et al., 2013Application of different classification techniques on brain morphological data, 2013
-
Surova et al., 2015Disease-specific structural changes in thalamus and dentatorubrothalamic tract in progressive supranuclear palsyNeuroradiology, 2015
-
Kiryu et al., 2019Deep learning to differentiate parkinsonian disorders separately using single midsagittal MR imaging: a proof of concept studyEuropean radiology, 2019
In recent times, researchers have attempted to reduce the need for, and effort involved in gathering training data. Transfer learning (TL) or domain transfer between task domains is highly desirable among researchers in such cases (Liu et al., 2016). Only when enough labelled training images are available in the database, conventional classification methods work effectively and the distributions of the training as well as the testing sample need to be comparable, according to the main principle of classification learning.
-
Liu et al., 2016Simple to complex transfer learning for action recognitionIEEE Transactions on Image Processing, 2016
In this study, we have proposed to find a generalized model which provide higher degree of classification accuracies in determining a PSP patient by performing a comparison study among the conventional custom CNN network and the transfer learning models such as DenseNet121, BResNet50, InceptionV3, VGG16, EfficientNetB0, Xception, MobileNet and InceptionResNetV2 which are fine tuned. Our study made primary contributions in establishing that the fine-tuned transfer learning models provide significant classification accuracies compared to the conventional CNN and other ML techniques.
2. Materials and methods
The work proposed can be divided into two phases, the primary phase includes data acquisition and pre-processing steps, and the secondary phase is to employ the various transfer learning models as well as the conventional CNN model on enhanced images for feature extraction and classification, to find the generalized model based on the efficiency of the employed models. Figure 1 depicts the flowchart highlighting the different steps in proposed work.
Thumbnail
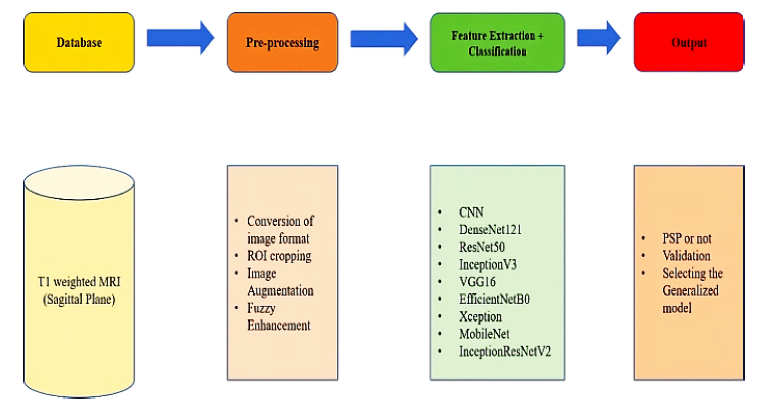
Figure 1
Flowchart representing general workflow of the proposed system including databases, pre-processing tools, feature extraction, classifier algorithm and output.
Flowchart representing general workflow of the proposed system including databases, pre-processing tools, feature extraction, classifier algorithm and output.
2.1. Hardware
To conduct the work, we employed a Windows© system with an Intel© core i7 processor (9750H) with a clock speed of 2.60-GHz having 16GB RAM and a 4GB-NVIDIA© GeForce GTX 1650 graphics card. Python© 3.7.11, Keras© 2.5 with TensorFlow© 2.5 backend.
2.2. Database
The data for our analysis came from the 4RTNI and PPMI databases of the Image & Data Archive (IDA) (Image & Data Archive [IDA], 2021), which is part of the University of South California's Laboratory of Neuroimaging. Our study dataset included 65 PSP patients and 60 control patients. A neuro specialist doctor again validated the images. The images were acquired in the sagittal plane using the T1 structural MRI image protocol. The data was collected in dcm format, also known as DICOM format, which is the most common image format used in neuroimaging. The image data was split into three groups: training, testing, and validation. They were then divided into two groups: diseased and normal.
-
Image & Data Archive [IDA], 2021LONI Image Data Archive (IDA), 2021
2.3. Pre-processing
With the support of python codes, the DICOM format images were converted to JPEG format, and the images were then cropped.
In Figure 2 (B), the T1 weighted sagittal view of midbrain showcases significant atrophy in the case of PSP patient (Jones, 2021). Cropping the images resulted in the region of interest being confined to the midbrain. The midbrain was identified as the region of interest because it experienced the highest atrophy or degeneration because of tau protein deposition, which leads to PSP disease. A specialist doctor validated the ROI. Due to the atrophy in the midbrain region, the midbrain was shaped like a hummingbird. (Shukla et al., 2009). The resulting images were then subjected to image augmentations to improve the database.
-
Jones, 2021Progressive supranuclear palsyRadiopaedia.org, 2021
-
Shukla et al., 2009‘Hummingbird’sign in progressive supranuclear palsyAnnals of Indian Academy of Neurology, 2009
Thumbnail
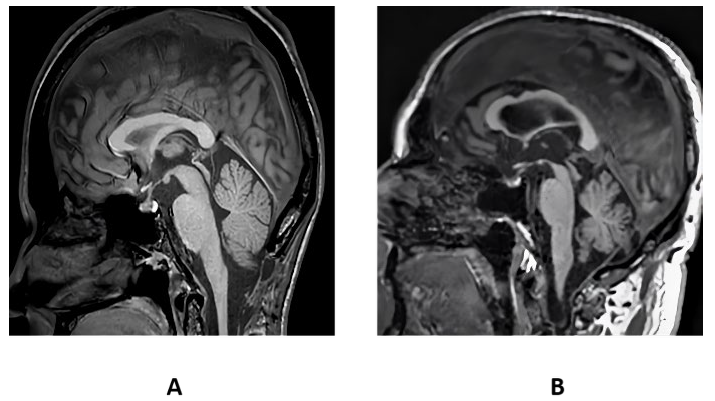
Figure 2
T1 weighted sagittal view of midbrain of a control (A) and PSP patient (B).
T1 weighted sagittal view of midbrain of a control (A) and PSP patient (B).
The images were then normalized based on intensities and dimensions and were subjected to fuzzy image enhancement. In our study the image is structured using fuzzy partitions, where the partitions are categorized on the image and each partition sub-image is confined to transform differently. Fuzzy partitions are used since the conventional partitions produce block effects at the borders of every sub-image. In our case at first the image is divided into fuzzy windows where every window pixel is confined to membership degree values. The membership degree values are estimated based on the distance between the pixel and the window. Followed by the calculation of mean and variance based on membership degrees. Summation of all fuzzy windows corresponding to their weights is taken to obtain the output enhanced image, where weights are used as membership degrees (Pătraşcu, 2003).
-
Pătraşcu, 2003Color image enhancement using the support fuzzificationInternational Fuzzy Systems Association World Congress, 2003
The weighted sum of affine transformation (ij based on membership degree wij of each fuzzy window is given by the transform (enh which gives enhanced fuzzy image.
2.4. Classification pipeline
To find a generalized model a comparative study has been done using many networks. It helped in classifying PSP patient from a normal control patient, starting from the conventional CNN network followed by other efficient transfer learning networks.
2.4.1. CNN custom model
Nowadays, convolutional neural networks are widely used in advanced computer vision based deep learning models. CNN is composed of layers in the structure which explicitly assume that any input they receive is an image. The primary layers of a CNN detect the low-level features of an image, especially the edges thereby providing temporal as well as spatial dependencies of an image. These layers, unlike the traditional feed-forward layers, have a much smaller number of parameters and use a weight updating strategy to reduce computation time.
All layer's learnable parameters are kernels that extend throughout the convolutional layers. A 2D feature map for the kernel is produced for every convolution over the input dimensions. Therefore, in case “N” filters are employed then the full output of the convolutional layer is formed by piling those ‘N' activation maps (Albawi et al., 2017). The activation layer is immensely beneficial since it aids in the approximate representation of every nonlinear function. It receives the input from the convolution layers in the form of feature maps. This is followed by pooling layers which reduce spatial complexity and convoluted layer size. The pooling layers are rotational as well as position invariant and thereby helps in extracting prominent features. Both max pooling as well as average pooling layers are used for dimension reduction, but mostly max pooling is employed.
-
Albawi et al., 2017Understanding of a convolutional neural network, 2017
The custom CNN model proposed in our work (Figure 3) is comprised of 6 layers of convolution and batch normalization followed by max pooling. Activation- function employed was relu. The dropout was set at 0.7 for the network after flattening the layer. The activation for the final layer was a sigmoid function to identify whether the output was of a PSP or control patient. The training for the model was conducted using the training cohort. Simultaneously, validation cohort was used to validate each batch of training. Each batch size for the network was set at 32 and the number of epochs were designed to be 100.
Thumbnail
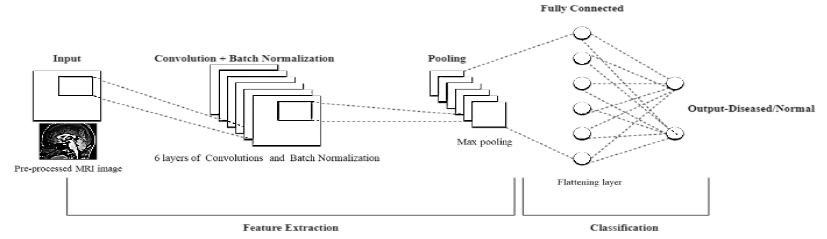
Figure 3
Basic block diagram of the proposed CNN network
Basic block diagram of the proposed CNN network
The process of training a model from the initial state takes time, to decrease the computation time and complications we employ pretrained models are used and this process of using the pretrained weights and networks is known as transfer learning.
2.4.2. Transfer learning models employed
When the dataset which we propose for training purpose is comparatively small an effective way to achieve a significant accuracy and to reduce the corresponding training time is by deploying a network which has been fine-tuned for a given case after being pre-trained on larger dataset. Here in our work in addition to conventional CNN network we have used other transfer learning models with pretrained weights (Figure 4) such as DenseNet121, ResNet50, InceptionV3, VGG16, EfficientNetB0, Xception, MobileNet and InceptionResNetV2.The model packages are provided by Keras, and all the models are primarily trained over a huge dataset of over a million images provided by the ImageNet dataset.
Thumbnail
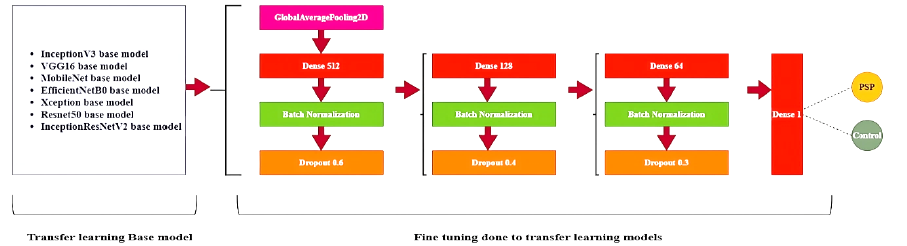
Figure 4
Overview of fine tuning of some of the pretrained networks employed in the proposed work.
Overview of fine tuning of some of the pretrained networks employed in the proposed work.
2.4.3. Fine tuning of pretrained networks
DenseNet121 model is a CNN in which each layer is linked to all the layers below it, i.e., in a sequential manner, where the primary 1st layer is linked to second and the next corresponding layers. Similarly, the 2nd layer is linked to the 3rd and the next corresponding layers. In comparison to a typical CNN, the DenseNet model needs less parameters. Just 12 filters are used in DenseNet layers, along with some feature maps. The gradient values from the input image as well as the loss function are varied for reducing the computation time in training time since it fetches the input from every previous layer (Huang et al., 2017). The network model had 428 layers; average pooling was employed throughout the network. The network output was designed with sigmoid activation so as yield the output as either PSP or control patient.
-
Huang et al., 2017Densely connected convolutional networks, 2017
The ResNet50 model includes a residual learning system that makes training deeper networks easier. The model architecture is focused on formulating the layers of the framework as adaptive learning residual operations with respect to the input layer rather than unreferenced functions. Even though the residual network is eight times deeper than VGG networks it exhibits a comparatively reduced complexity and high gain accuracy (He et al., 2016). In the proposed work, a new model was generated with Keras and all the layers from ResNet50 base model were incorporated with it. Average pooling was employed and a relu activation function was used along with batch normalization within the new model network and the dropout was set between 0.6 to 0.3 across the newly established model. The output coming from the ResNet50 network was then fed to a flattened layer. Like the other networks, the network output l was designed with sigmoid activation so as yield the output as either PSP or control patient. The InceptionV3 model framework enables learning network's depth and width to be increased and provides a constant computational complexity and time. The inception model is primarily trained over a huge dataset of over a million images provided by the ImageNet dataset. The model provides the use of different size kernels on the input image and is composed of a multilevel feature map generator having convolutions from 1x1 to 5x5.The convoluted outputs are fed to the next layers by stacking them corresponding to the outputs along channel dimensions (Szegedy et al., 2016). InceptionV3 has a depth of 159 layers. In the case of InceptionV3 network also a new model was generated with Keras and all the layers from InceptionV3 base model were incorporated with it. Like the fine tuning in Resnet50 the same parameters as well as the procedure were employed.
-
He et al., 2016Deep residual learning for image recognition, 2016
-
Szegedy et al., 2016Rethinking the inception architecture for computer vision, 2016
The 16 in VGG 16 signifies the number of layers having weights. VGG16 model does not rely on hyperparameter they are concentrated on having 3x3-convolution layers with a stride 1 of the same padding and max pooling layer of 2x2-kernel with a stride of 2. Throughout the design framework of the model, the convolution and max pooling layers are arranged in a unique way till the final two fully connected layers have a softmax activation function at the output layer (Simonyan & Zisserman, 2014). The fine tuning of VGG 16 network was also done in a similar procedure as that of InceptionV3 and Resnet50 networks.
-
Simonyan & Zisserman, 2014Very deep convolutional networks for large-scale image recognition, 2014
The EfficientNetB0 model proposes a no-scaling approach for scaling up CNNs in a more organized manner, based on a basic yet highly effective coefficient. Unlike traditional methods, which scale network dimensions like depth, width, and resolution arbitrarily, the EfficientNetB0 model with the help of fixed coefficients scales each dimension uniformly and therefore in comparison with the existing ConvNets they exhibit higher efficiency and accuracies (Tan & Le, 2021). The fine tuning of EfficientNetB0 network was also done in the similar procedure as that of InceptionV3, VGG16 and Resnet50 networks.
With 126 layers, Xception is one of finest optimized image classifiers in Keras. The Xception model is built on the presumption that the spatial correlation is entirely separate from the association among the input channels. Primarily, Xception framework model enhances the inception model by substituting depth wise independent convolution for regular convolution. It consists of a layered stack having residual connections. On the ImageNet dataset, Xception performs marginally better than InceptionV3 marginally, and significantly outperformed InceptionV3 on a larger dataset considering the same parameters (Chollet, 2017). The fine tuning of Xception network was also done in a similar procedure as that of InceptionV3, VGG16, EfficientNetB0 and Resnet50 networks.
-
Chollet, 2017Xception: Deep Learning with Depthwise Separable Convolutions, 2017
MobileNet framework is a simplified model that makes use of deep convoluted networks to develop a light weighted deep convoluted network. The depth wise convolution in MobileNets uses a single filter to every input channel. It is followed by the integration of deep convolutions outputs using 1x1 kernel convolution which leads way to developing a new set of output. This output is then divided into two separable layers, one used for filtering and the other for combining. Thereby reducing the complexity drastically. MobileNet model is used for mobile applications (Howard et al., 2017). The fine tuning of MobileNet network was also done in a similar procedure as that of InceptionV3, VGG16, EfficientNetB0, Xception and Resnet50 networks.
-
Howard et al., 2017Mobilenets: Efficient convolutional neural networks for mobile vision applications, 2017
InceptionResNetV2 model is established by incorporating the Inception framework with the residual connections. The network model weights are pretrained utilizing the ImageNet data. The various features are learned and extracted through the 164 layers of the network. The output is provided in the form of probabilities of different classes (Szegedy et al., 2017). The fine tuning of network was also done in a similar procedure as that of InceptionV3, VGG16, MobileNet, EfficientNetB0, Xception and Resnet50 networks.
-
Szegedy et al., 2017Inception-v4, Inception-ResNet and the Impact of Residual Connections on LearningProceedings of the AAAI Conference on Artificial Intelligence, 2017
2.4.4. Parameter evaluation
The parameters such as accuracy, precision, f measure, sensitivity(recall), and specificity justify system's efficiency, and are treated as some of the most important parameters.
Eq. (2-6) gives the mathematical expression for essential parameters.
Where, TN- true negative, FP - false positive, TP -true positive and FN - false negative.
Then, for each model, ROC (receiver operating characteristic) curves and their respective AUC (area under curve) values are computed.
3. Results and discussion
3.1. Pre-processing results
The dataset as explained has been converted from DCM format to JPEG to reduce computational complexities and is then cropped as per the region of interest with the help of a specialist doctor. The dimensions of the input image fed into the networks are of 165 pixels width and 110 pixels height and all the images are of only one-color channel. The maximum value for pixel image generated is 170.0000 and minimum is 0. 0000.Standard deviation (SD) as well as the mean of the pixels is calculated, they were 24.3510 and 43.0974, respectively. Figure 5 depicts the image as well as the distribution graph.
Thumbnail
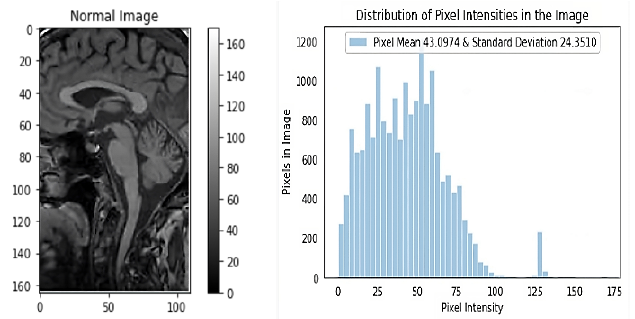
Figure 5
Depicts the input image read from the repository of that of a normal patient and displays the graph with the corresponding distribution of pixel intensity of the input image.
Depicts the input image read from the repository of that of a normal patient and displays the graph with the corresponding distribution of pixel intensity of the input image.
The input images are modified before they are subjected to training phase to make the images more suitable for training a CNN. Images are then Fuzzy enhanced and normalized (Figure 6) and are subjected to further pre-processing steps (Figure 8). To perform data pre-processing and data augmentation, Keras ImageDataGenerator function is employed. Basic data augmentation, such as horizontal image flipping, rotation, zooming etc is done by the class. Generator is used to convert each image batch's values in such a way that the standard deviation was given a value 1 and the mean of the pixels were given a value 0 to facilitate standardization of input image distribution.
Thumbnail
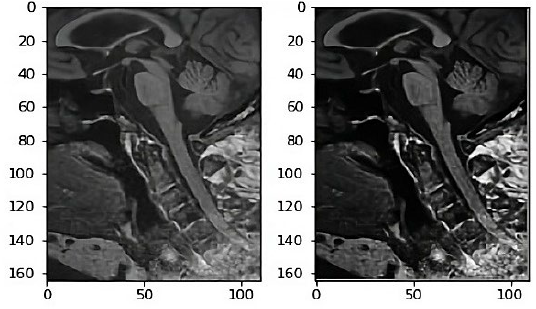
Figure 6
T1 weighted sagittal view of midbrain of a normal input image and fuzzy enhanced image.
T1 weighted sagittal view of midbrain of a normal input image and fuzzy enhanced image.
Thumbnail
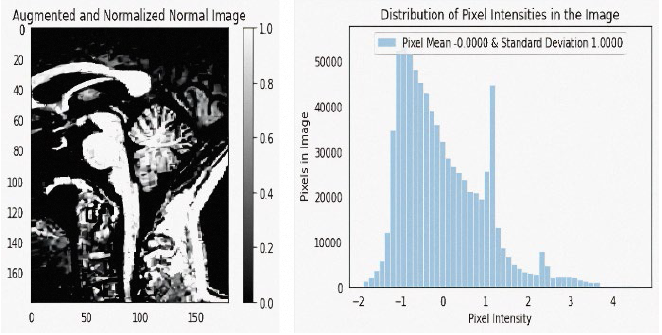
Figure 7
Depicts the input image read from the repository of that of a normal patient after being augmented, normalized, and displays the graph with the corresponding distribution of pixel intensity of the augmented, normalized image.
Depicts the input image read from the repository of that of a normal patient after being augmented, normalized, and displays the graph with the corresponding distribution of pixel intensity of the augmented, normalized image.
Thumbnail
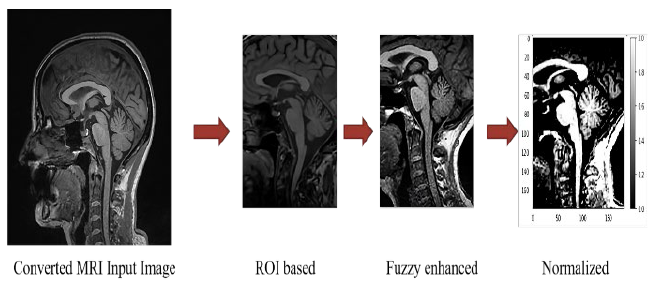
Figure 8
Summary of steps involved in pre-processing pipeline.
Summary of steps involved in pre-processing pipeline.
The input data is then clipped in such a way that the imshow function range is satisfied with the RGB data, where the float values are assigned between 0 to 1 and the integer values between 0 to 255. The dimensions of the image are 180x180, with one single color channel. The maximum pixel value then generated is 4.5882 and the minimum is -1. 8962.The mean value of the pixels came to around -0.0000 and the standard deviation around 1.0000. Figure 7 depicts the image as well as the distribution graph.
3.2. Classification results by different networks
The conventional CNN model which was customized is employed at first, the CNN model was trained on the enhanced and augmented dataset for 100 iterations with a subsequent batch size as 32 for training as well as validation. The model comprised of 6 convolution layers followed by 3 max-pool layers and these layers were finally linked to a Dense layer having a sigmoid operation as the activation at the end. Batch normalization was employed after every convolution to normalize the subsequent inputs to the corresponding layers for every mini batch. A binary cross-entropy operation along with an Adam optimizer was used as the cost function. The cross-entropy for the model is determined using Eq. (7) where D, entire training set of size N.
The transfer learning models such as DenseNet121, ResNet50, InceptionV3, VGG16, EfficientNetB0, Xception, MobileNet and InceptionResNetV2 were then employed on the data. All the model packages were downloaded from Keras and the pretrained weights were downloaded from ImageNet. After making the subsequent changes by fine tuning as described in the architecture the models are established. Following a batch size of 32 for training and validation, all models were trained for 100 iterations.
All the transfer learning networks showed significantly higher accuracies compared to the conventional CNN. Among the networks the InceptionResNetV2 framework showcased the highest accuracy. Most of the fine-tuned transfer learning networks showed an accuracy of more than 80 % except the EfficentnetB0 network. The DenseNet121, ResNet50, InceptionV3, VGG16 and Xception networks highlighted an accuracy between 80 to 94 %. VGG 16 and DenseNet 121 displayed a similar 92.7% accuracy.
InceptionResNetV2 displayed the highest accuracy with 95% with a specificity of 100. The outputs of all networks were validated by the help of a specialist doctor. The graphs shown in Figure 9, showcases the evolution of accuracy of all the deep learning networks used in this study. The Table 1 provides the description of the performance metrics of the respective models used in this Study.
Thumbnail

Figure 9
Graphs depicting the evolution of accuracy of; (A) custom CNN framework, (B) DenseNet121, (C) ResNet50, (D) InceptionV3, (E) VGG16, (F) EfficientNetB0, (G) Xception, (H) MobileNet and (I) InceptionResNetV2.
Graphs depicting the evolution of accuracy of; (A) custom CNN framework, (B) DenseNet121, (C) ResNet50, (D) InceptionV3, (E) VGG16, (F) EfficientNetB0, (G) Xception, (H) MobileNet and (I) InceptionResNetV2.
Table 1
Accuracies, precision, sensitivity F1 score and specificity of the respective models employed in this study.
Accuracies, precision, sensitivity F1 score and specificity of the respective models employed in this study.
| Model Architecture | Accuracy | Precision | Sensitivity/
|
F1 score | Specificity |
| Custom CNN | 77 | 74.6 | 100 | 85 | 30 |
| DenseNet121 | 92.7 | 90.3 | 100 | 94.9 | 77.7 |
| ResNet50 | 89.1 | 100 | 83.9 | 91.2 | 100 |
| InceptionV3 | 93.9 | 91.8 | 100 | 95.7 | 81 |
| VGG16 | 92.7 | 94.6 | 94 | 94 | 88 |
| EfficientNetB0 | 75.9 | 73.6 | 100 | 84.8 | 25.9 |
| Xception | 92 | 90 | 100 | 94 | 77 |
| MobileNet | 90.3 | 87.5 | 100 | 93.3 | 70.3 |
| InceptionResNetV2 | 95 | 100 | 92.8 | 96.2 | 100 |
Figure 10 represents ROC (Receiver Operating Characteristic) curves and their respective AUC (Area Under Curve) values of Custom CNN framework, DenseNet121, ResNet50, InceptionV3, VGG16, EfficientNetB0, Xception, MobileNet and InceptionResNetV2. The graph showcased in Figure 11 depicts the Parameter analysis chart regarding the obtained accuracies, sensitivity, F1 score, precision and specificity of the networks considered in this study at the end of 100 iterations.
Thumbnail
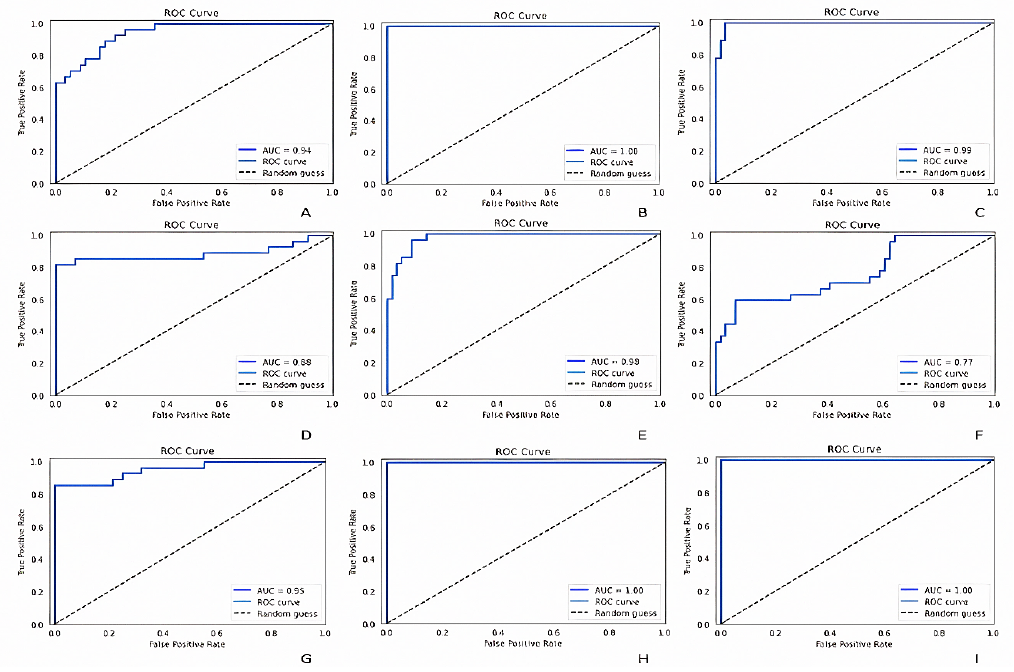
Figure 10
ROC (receiver operating characteristic) curves and their respective AUC (area under curve) values of; (A) custom CNN framework, (B) DenseNet121, (C) ResNet50, (D) InceptionV3, (E) VGG16, (F) EfficientNetB0, (G) Xception, (H) MobileNet and (I) InceptionResNetV2.
ROC (receiver operating characteristic) curves and their respective AUC (area under curve) values of; (A) custom CNN framework, (B) DenseNet121, (C) ResNet50, (D) InceptionV3, (E) VGG16, (F) EfficientNetB0, (G) Xception, (H) MobileNet and (I) InceptionResNetV2.
Thumbnail
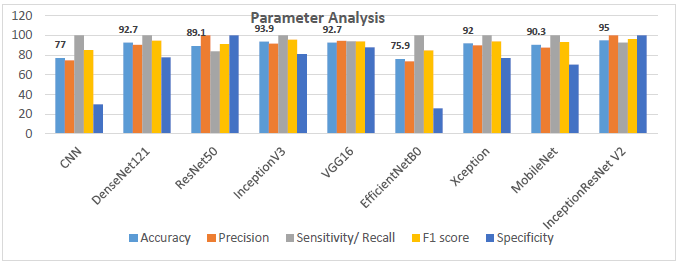
Figure 11
Graph displaying the parameter analysis chart regarding the obtained accuracies, sensitivity, F1 score, precision and specificity of the networks considered in this study at the end of 100 iterations.
Graph displaying the parameter analysis chart regarding the obtained accuracies, sensitivity, F1 score, precision and specificity of the networks considered in this study at the end of 100 iterations.
4. Conclusions
The study's key finding was that the fine-tuned transfer learning-based CNN models outperformed the conventional CNN model showing significant outputs in detecting and identifying PSP patients from control patients. Contradictory to the traditional machine learning methods which relied on handcrafted and manually labelled features from the image as well as the developer’s expertise, transfer learning models where comparatively much easier to deploy. Also transfer learning approaches address the issues that are raised due to the scarcity of labelled data. The results stated that the InceptionResNetV2 transfer learning framework model achieved an accuracy of 95% precision of 100%, sensitivity of 92.8%, F1 score of 96.2% and a specificity of 100% which is significantly higher compared to other models considered in our study and therefore InceptionResNetV2 model can be treated as the generalized model in the classification of PSP patients from control patients. The results were validated with the help of a specialist doctor. The findings of this study open new possibilities for using transfer learning in conjunction with enhanced neuroimages for the automated early prediction and diagnosis of progressive supranuclear palsy, even if the system is pre-trained on images of any dataset. We are also planning to implement an autonomous hyperparameter optimizing framework with enhanced pre-processing techniques along with some state-of-the-art ensemble methods as a continuation to this work.
Acknowledgements
We are grateful to Dr. Raeez Mohammed Basheer, MBBS, MD, DM Neurology, Neurologist, Dr. SMCSI Medical College, Trivandrum, for his support in validating the predictions and to the School of Electronics Engineering, VIT University. The study involves data provided by the database (https://ida.loni.usc.edu).
References
- Aerts, M., Meijer, F. J., Verbeek, M., Esselink, R., & Bloem, B. R. (2011). Diagnostic challenges in parkinsonism.Expert Review of Neurotherapeutics,11(8), 1099-1101. https://doi.org/10.1586/ern.11.96 Links
- Aerts, M. B., Esselink, R. A. J., Abdo, W. F., Meijer, F. J. A., Drost, G., Norgren, N., ... & Verbeek, M. M. (2015). Ancillary investigations to diagnose parkinsonism: a prospective clinical study.Journal of neurology,262, 346-356. https://doi.org/10.1007/s00415-014-7568-4 Links
- Adachi, M., Kawanami, T., Ohshima, H., Sugai, Y., & Hosoya, T. (2004). Morning glory sign: a particular MR finding in progressive supranuclear palsy.Magnetic Resonance in Medical Sciences, 3(3), 125-132. Links
- Albawi, S., Mohammed, T. A., & Al-Zawi, S. (2017). Understanding of a convolutional neural network. In2017 international conference on engineering and technology (ICET)(pp. 1-6). IEEE. https://doi.org/10.1109/ICEngTechnol.2017.8308186 Links
- Archer, D. B., Bricker, J. T., Chu, W. T., Burciu, R. G., McCracken, J. L., Lai, S., ... & Vaillancourt, D. E. (2019). Development and validation of the automated imaging differentiation in parkinsonism (AID-P): a multicentre machine learning study.The Lancet Digital Health, 1(5), e222-e231. https://doi.org/10.1016/S2589-7500(19)30105-0 Links
- Ashburner, J., & Friston, K. J. (2000). Voxel-based morphometry-the methods.Neuroimage,11(6), 805-821. https://doi.org/10.1006/nimg.2000.0582 Links
- Berg, D., Postuma, R. B., Adler, C. H., Bloem, B. R., Chan, P., Dubois, B., ... & Deuschl, G. (2015). MDS research criteria for prodromal Parkinson's disease.Movement Disorders,30(12), 1600-1611. https://doi.org/10.1002/mds.26431 Links
- Beyer, M. K., Janvin, C. C., Larsen, J. P., & Aarsland, D. (2007). A magnetic resonance imaging study of patients with Parkinson’s disease with mild cognitive impairment and dementia using voxel-based morphometry.Journal of Neurology, Neurosurgery & Psychiatry,78(3), 254-259. Links
- Bhattacharya, D., Vengalil, S. K., Sinha, N., Saini, J., Pal, P., & Sandhya, M. (2019). Structural MRI based texture analysis of corpus callosum in patients with Progressive Supraneuclear Palsy. InTENCON 2019-2019 IEEE Region 10 Conference (TENCON)(pp. 441-446). IEEE. https://doi.org/10.1109/TENCON.2019.8929403 Links
- Blazejewska, A. I., Schwarz, S. T., Pitiot, A., Stephenson, M. C., Lowe, J., Bajaj, N., ... & Gowland, P. A. (2013). Visualization of nigrosome 1 and its loss in PD: pathoanatomical correlation and in vivo 7 T MRI.Neurology,81(6), 534-540. https://doi.org/10.1212/WNL.0b013e31829e6fd2 Links
- Burton, E. J., McKeith, I. G., Burn, D. J., Williams, E. D., & O’Brien, J. T. (2004). Cerebral atrophy in Parkinson’s disease with and without dementia: a comparison with Alzheimer’s disease, dementia with Lewy bodies and controls.Brain,127(4), 791-800. https://doi.org/10.1093/brain/awh088 Links
- Cosottini, M., Ceravolo, R., Faggioni, L., Lazzarotti, G., Michelassi, M. C., Bonuccelli, U., & Bartolozzi, C. (2007). Assessment of midbrain atrophy in patients with progressive supranuclear palsy with routine magnetic resonance imaging.Acta neurologica Scandinavica,116(1), 37-42. https://doi.org/10.1111/j.1600-0404.2006.00767.x Links
- Cherubini, A., Morelli, M., Nisticó, R., Salsone, M., Arabia, G., Vasta, R., ... & Quattrone, A. (2013). Magnetic resonance support vector machine discriminates between Parkinson disease and progressive supranuclear palsy.Movement Disorders,29(2), 266-269. https://doi.org/10.1002/mds.25737 Links
- Chollet, F. (2017). Xception: Deep Learning with Depthwise Separable Convolutions. In2017 IEEE Conference on Computer Vision and Pattern Recognition (CVPR)(pp. 1800-1807). IEEE Computer Society. https://doi.org/10.1109/CVPR.2017.195 Links
- Dickson, D. W., & Weller, R. O. (2011).Neurodegeneration: The Molecular Pathology of Dementia and Movement Disorders: Second Edition. Wiley-Blackwell. https://doi.org/10.1002/9781444341256 Links
- Dickson, D. W., Ahmed, Z., Algom, A. A., Tsuboi, Y., & Josephs, K. A. (2010). Neuropathology of variants of progressive supranuclear palsy.Current opinion in neurology,23(4), 394-400. https://doi.org/10.1097/WCO.0b013e32833be924 Links
- Feldmann, A., Illes, Z., Kosztolanyi, P., Illes, E., Mike, A., Kover, F., & Nagy, F. (2008). Morphometric changes of gray matter in Parkinson's disease with depression: A voxel‐based morphometry study.Movement Disorders,23(1), 42-46. https://doi.org/10.1002/mds.21765 Links
- Focke, N. K., Helms, G., Scheewe, S., Pantel, P. M., Bachmann, C. G., Dechent, P., ... & Trenkwalder, C. (2011). Individual voxel‐based subtype prediction can differentiate progressive supranuclear palsy from idiopathic Parkinson syndrome and healthy controls.Human brain mapping,32(11), 1905-1915. https://doi.org/10.1002/hbm.21161 Links
- Gröschel, K., Hauser, T. K., Luft, A., Patronas, N., Dichgans, J., Litvan, I., & Schulz, J. B. (2004). Magnetic resonance imaging-based volumetry differentiates progressive supranuclear palsy from corticobasal degeneration.Neuroimage,21(2), 714-724. https://doi.org/10.1016/j.neuroimage.2003.09.070 Links
- Hauw, J. J., Daniel, S. E., Dickson, D., Horoupian, D. S., Jellinger, K., Lantos, P. L., ... & Litvan, I. (1994). Preliminary NINDS neuropathologic criteria for Steele‐Richardson‐Olszewski syndrome (progressive supranuclear palsy).Neurology,44(11), 2015-2015. https://doi.org/10.1212/WNL.44.11.2015 Links
- He, K., Zhang, X., Ren, S., & Sun, J. (2016). Deep residual learning for image recognition. InProceedings of the IEEE conference on computer vision and pattern recognition(pp. 770-778). Links
- Helmich, R. C., Hallett, M., Deuschl, G., Toni, I., & Bloem, B. R. (2012). Cerebral causes and consequences of parkinsonian resting tremor: a tale of two circuits?.Brain,135(11), 3206-3226. https://doi.org/10.1093/brain/aws023 Links
- Huang, G., Liu, Z., Van Der Maaten, L., & Weinberger, K. Q. (2017). Densely connected convolutional networks. InProceedings of the IEEE conference on computer vision and pattern recognition(pp. 4700-4708). Links
- Hotter, A., Esterhammer, R., Schocke, M. F., & Seppi, K. (2009). Potential of advanced MR imaging techniques in the differential diagnosis of parkinsonism.Movement Disorders,24(S2), S711-S720. https://doi.org/10.1002/mds.22648 Links
- Howard, A. G., Zhu, M., Chen, B., Kalenichenko, D., Wang, W., Weyand, T., ... & Adam, H. (2017). Mobilenets: Efficient convolutional neural networks for mobile vision applications.arXiv preprint arXiv:1704.04861. https://doi.org/10.48550/arXiv.1704.04861 Links
- Image & Data Archive IDA. (2021).LONI Image Data Archive (IDA). Usc.edu. https://ida.loni.usc.edu/login.jsp Links
- Jones, J. (2021).Progressive supranuclear palsy | Radiology Reference Article | Radiopaedia.org. Radiopaedia.https://radiopaedia.org/articles/progressive-supranuclear-palsy-1 Links
- Kato, N., Arai, K., & Hattori, T. (2003). Study of the rostral midbrain atrophy in progressive supranuclear palsy.Journal of the neurological sciences,210(1-2), 57-60. https://doi.org/10.1016/S0022-510X(03)00014-5 Links
- Kiryu, S., Yasaka, K., Akai, H., Nakata, Y., Sugomori, Y., Hara, S., ... & Ohtomo, K. (2019). Deep learning to differentiate parkinsonian disorders separately using single midsagittal MR imaging: a proof of concept study.European radiology,29, 6891-6899. https://doi.org/10.1007/s00330-019-06327-0 Links
- Koga, S., Josephs, K. A., Ogaki, K., Labbé, C., Uitti, R. J., Graff‐Radford, N., ... & Dickson, D. W. (2016). Cerebellar ataxia in progressive supranuclear palsy: an autopsy study of PSP‐C.Movement Disorders,31(5), 653-662. https://doi.org/10.1002/mds.26499 Links
- Korolev, S., Safiullin, A., Belyaev, M., & Dodonova, Y. (2017). Residual and plain convolutional neural networks for 3D brain MRI classification. In2017 IEEE 14th international symposium on biomedical imaging (ISBI 2017)(pp. 835-838). IEEE. https://doi.org/10.1109/ISBI.2017.7950647 Links
- LeCun, Y., Bengio, Y., & Hinton, G. (2015). Deep learning.nature,521(7553), 436-444. https://doi.org/10.1038/nature14539 Links
- Litjens, G., Kooi, T., Bejnordi, B. E., Setio, A. A. A., Ciompi, F., Ghafoorian, M., ... & Sánchez, C. I. (2017). A survey on deep learning in medical image analysis.Medical image analysis,42, 60-88. https://doi.org/10.1016/j.media.2017.07.005 Links
- Lamb, R., Rohrer, J. D., Lees, A. J., & Morris, H. R. (2016). Progressive supranuclear palsy and corticobasal degeneration: pathophysiology and treatment options.Current treatment options in neurology,18, 1-18. https://doi.org/10.1007/s11940-016-0422-5 Links
- Liu, F., Xu, X., Qiu, S., Qing, C., & Tao, D. (2016). Simple to complex transfer learning for action recognition.IEEE Transactions on Image Processing,25(2), 949-960. https://doi.org/10.1109/TIP.2015.2512107 Links
- Massey, L. A., Micallef, C., Paviour, D. C., O'Sullivan, S. S., Ling, H., Williams, D. R., ... & Jäger, H. R. (2012). Conventional magnetic resonance imaging in confirmed progressive supranuclear palsy and multiple system atrophy.Movement disorders,27(14), 1754-1762. https://doi.org/10.1002/mds.24968 Links
- Massey, L. A., Jäger, H. R., Paviour, D. C., O’Sullivan, S. S., Ling, H., Williams, D. R., ... & Micallef, C. (2013). The midbrain to pons ratio: a simple and specific MRI sign of progressive supranuclear palsy.Neurology,80(20), 1856-1861. https://doi.org/10.1212/WNL.0b013e318292a2d2 Links
- Marquand, A. F., Filippone, M., Ashburner, J., Girolami, M., Mourao-Miranda, J., Barker, G. J., ... & Blain, C. R. (2013). Automated, high accuracy classification of parkinsonian disorders: a pattern recognition approach.PloS one, 8(7), e69237. https://doi.org/10.1371/journal.pone.0069237 Links
- Meijer, F. J., Aerts, M. B., Abdo, W. F., Prokop, M., Borm, G. F., Esselink, R. A., ... & Bloem, B. R. (2011). Contribution of routine brain MRI to the differential diagnosis of parkinsonism: a 3-year prospective follow-up study.Journal of neurology,259, 929-935. https://doi.org/10.1007/s00415-011-6280-x Links
- Meijer, F. J., Bloem, B. R., Mahlknecht, P., Seppi, K., & Goraj, B. (2013). Update on diffusion MRI in Parkinson's disease and atypical parkinsonism.Journal of the neurological sciences,332(1-2), 21-29. https://doi.org/10.1016/j.jns.2013.06.032 Links
- Moeskops, P., Viergever, M. A., Mendrik, A. M., De Vries, L. S., Benders, M. J., & Išgum, I. (2016). Automatic segmentation of MR brain images with a convolutional neural network.IEEE transactions on medical imaging,35(5), 1252-1261. https://doi.org/10.1109/TMI.2016.2548501 Links
- Mueller, K., Jech, R., Bonnet, C., Tintěra, J., Hanuška, J., Möller, H. E., ... & FTLDc Study Group. (2017). Disease-specific regions outperform whole-brain approaches in identifying progressive supranuclear palsy: a Multicentric MRI Study.Frontiers in neuroscience,11, 100. https://doi.org/10.3389/fnins.2017.00100 Links
- Nagano-Saito, A., Washimi, Y., Arahata, Y., Kachi, T., Lerch, J. P., Evans, A. C., ... & Ito, K. (2005). Cerebral atrophy and its relation to cognitive impairment in Parkinson disease.Neurology,64(2), 224-229. https://doi.org/10.1212/01.WNL.0000149510.41793.50 Links
- Oba, H., Yagishita, A., Terada, H., Barkovich, A. J., Kutomi, K., Yamauchi, T., ... & Suzuki, S. (2005). New and reliable MRI diagnosis for progressive supranuclear palsy.Neurology,64(12), 2050-2055 https://doi.org/10.1212/01.WNL.0000165960.04422.D0 Links
- Pătraşcu, V. (2003). Color image enhancement using the support fuzzification. InInternational Fuzzy Systems Association World Congress(pp. 412-419). Berlin, Heidelberg: Springer Berlin Heidelberg. https://doi.org/10.1007/3-540-44967-1_49 Links
- Paviour, D. C., Price, S. L., Jahanshahi, M., Lees, A. J., & Fox, N. C. (2006). Regional brain volumes distinguish PSP, MSA‐P, and PD: MRI‐based clinico‐radiological correlations.Movement disorders: official journal of the Movement Disorder Society,21(7), 989-996. https://doi.org/10.1002/mds.20877 Links
- Pyatigorskaya, N., Yahia‐Cherif, L., Gaurav, R., Ewenczyk, C., Gallea, C., Valabregue, R., ... & Lehericy, S. (2020). Multimodal magnetic resonance imaging quantification of brain changes in progressive supranuclear palsy.Movement Disorders,35(1), 161-170. https://doi.org/10.1002/mds.27877 Links
- Quattrone, A., Nicoletti, G., Messina, D., Fera, F., Condino, F., Pugliese, P., ... & Gallo, O. (2008). MR imaging index for differentiation of progressive supranuclear palsy from Parkinson disease and the Parkinson variant of multiple system atrophy.Radiology,246(1), 214-221. https://doi.org/10.1148/radiol.2453061703 Links
- Ramírez-Ruiz, B., Martí, M. J., Tolosa, E., Bartrés-Faz, D., Summerfield, C., Salgado-Pineda, P., ... & Junqué, C. (2005). Longitudinal evaluation of cerebral morphological changes in Parkinson's disease with and without dementia.Journal of neurology,252, 1345-1352. https://doi.org/10.1007/s00415-005-0864-2 Links
- Salvatore, C., Cerasa, A., Castiglioni, I., Gallivanone, F., Augimeri, A., Lopez, M., ... & Quattrone, A. (2014). Machine learning on brain MRI data for differential diagnosis of Parkinson's disease and Progressive Supranuclear Palsy.Journal of neuroscience methods,222, 230-237. https://doi.org/10.1016/j.jneumeth.2013.11.016 Links
- Sarica, A., Critelli, C., Guzzi, P. H., Cerasa, A., Quattrone, A., & Cannataro, M. (2013). Application of different classification techniques on brain morphological data. InProceedings of the 26th IEEE International Symposium on Computer-Based Medical Systems(pp. 425-428). IEEE. https://doi.org/10.1109/CBMS.2013.6627832 Links
- Seppi, K., & Poewe, W. (2010). Brain magnetic resonance imaging techniques in the diagnosis of parkinsonian syndromes.Neuroimaging Clinics,20(1), 29-55. https://doi.org/10.1016/j.nic.2009.08.016 Links
- Simonyan, K., & Zisserman, A. (2014). Very deep convolutional networks for large-scale image recognition.arXiv preprint arXiv:1409.1556. https://doi.org/10.48550/arXiv.1409.1556 Links
- Scherfler, C., Göbel, G., Müller, C., Nocker, M., Wenning, G. K., Schocke, M., ... & Seppi, K. (2016). Diagnostic potential of automated subcortical volume segmentation in atypical parkinsonism.Neurology,86(13), 1242-1249. https://doi.org/10.1212/WNL.0000000000002518 Links
- Schofield, E. C., Hodges, J. R., Macdonald, V., Cordato, N. J., Kril, J. J., & Halliday, G. M. (2011). Cortical atrophy differentiates Richardson's syndrome from the parkinsonian form of progressive supranuclear palsy.Movement disorders,26(2), 256-263. https://doi.org/10.1002/mds.23295 Links
- Schrag, A., Good, C. D., Miszkiel, K., Morris, H. R., Mathias, C. J., Lees, A. J., & Quinn, N. P. (2000). Differentiation of atypical parkinsonian syndromes with routine MRI.Neurology,54(3), 697-697. https://doi.org/10.1212/WNL.54.3.697 Links
- Schulz, J. B., Skalej, M., Wedekind, D., Luft, A. R., Abele, M., Voigt, K., ... & Klockgether, T. (1999). Magnetic resonance imaging-based volumetry differentiates idiopathic Parkinson's syndrome from multiple system atrophy and progressive supranuclear palsy.Annals of Neurology: Official Journal of the American Neurological Association and the Child Neurology Society,45(1), 65-74. https://doi.org/10.1002/1531-8249(199901)45:1<65::AID-ART12>3.0.CO;2-1 Links
- Schwarz, S. T., Afzal, M., Morgan, P. S., Bajaj, N., Gowland, P. A., & Auer, D. P. (2014). The ‘swallow tail’appearance of the healthy nigrosome-a new accurate test of Parkinson's disease: a case-control and retrospective cross-sectional MRI study at 3T.PloS one, 9(4), e93814. https://doi.org/10.1371/journal.pone.0093814 Links
- Shukla, R., Sinha, M., Kumar, R., & Singh, D. (2009). ‘Hummingbird’sign in progressive supranuclear palsy.Annals of Indian Academy of Neurology,12(2), 133. https://doi.org/10.4103/0972-2327.53087 Links
- Summerfield, C., Junqué, C., Tolosa, E., Salgado-Pineda, P., Gómez-Ansón, B., Martí, M. J., ... & Mercader, J. (2005). Structural brain changes in Parkinson disease with dementia: a voxel-based morphometry study.Archives of neurology,62(2), 281-285. Links
- Surova, Y., Nilsson, M., Lätt, J., Lampinen, B., Lindberg, O., Hall, S., ... & Hansson, O. (2015). Disease-specific structural changes in thalamus and dentatorubrothalamic tract in progressive supranuclear palsy.Neuroradiology,57, 1079-1091. https://doi.org/10.1007/s00234-015-1563-z Links
- Szegedy, C., Vanhoucke, V., Ioffe, S., Shlens, J., & Wojna, Z. (2016). Rethinking the inception architecture for computer vision. InProceedings of the IEEE conference on computer vision and pattern recognition(pp. 2818-2826). Links
- Szegedy, C., Ioffe, S., Vanhoucke, V., & Alemi, A. (2017). Inception-v4, Inception-ResNet and the Impact of Residual Connections on Learning.Proceedings of the AAAI Conference on Artificial Intelligence,31(1). https://doi.org/10.1609/aaai.v31i1.11231 Links
- Talai, A. S., Ismail, Z., Sedlacik, J., Boelmans, K., & Forkert, N. D. (2019). Improved automatic morphology-based classification of Parkinson’s disease and progressive supranuclear palsy.Clinical Neuroradiology,29, 605-614. https://doi.org/10.1007/s00062-018-0727-8 Links
- Tan, M., & Le, Q. (2019). Efficientnet: Rethinking model scaling for convolutional neural networks. InInternational conference on machine learning(pp. 6105-6114). PMLR. Links
- Weingarten, C. P., Sundman, M. H., Hickey, P., & Chen, N. K. (2015). Neuroimaging of Parkinson's disease: Expanding views.Neuroscience & Biobehavioral Reviews,59, 16-52. https://doi.org/10.1016/j.neubiorev.2015.09.007 Links
- Williams, D. R., & Lees, A. J. (2009). Progressive supranuclear palsy: clinicopathological concepts and diagnostic challenges.The Lancet Neurology, 8(3), 270-279. https://doi.org/10.1016/S1474-4422(09)70042-0 Links
- Zanigni, S., Calandra-Buonaura, G., Manners, D. N., Testa, C., Gibertoni, D., Evangelisti, S., ... & Tonon, C. (2016). Accuracy of MR markers for differentiating progressive supranuclear palsy from Parkinson's disease.NeuroImage: Clinical,11, 736-742. https://doi.org/10.1016/j.nicl.2016.05.016 Links
- Zhu, B., Liu, J. Z., Cauley, S. F., Rosen, B. R., & Rosen, M. S. (2018). Image reconstruction by domain-transform manifold learning.Nature,555(7697), 487-492. https://doi.org/10.1038/nature25988 Links