Articles
Rock-magnetic parameters and heavy metal distribution of the El Fraile I tailings (Guerrero, Mexico)
Parámetros de magnetismo de roca y distribución de metales pesados de los relaves mineros de la presa El Fraile I (Guerrero, México)

-
Publication dates-
September 29, 2025
December , 2024
- Article in PDF
- Article in XML
- Automatic translation
- Send this article by e-mail
- Share this article +
ABSTRACT
As a result of the mining activity at Taxco, seven mining waste dams have been generated, which could represent severe health problems for the community and environment. The study's goal comprises the El Fraile I mining-wastes dam (the oldest of the region), located south of Taxco de Alarcón, in the northern sector of the Guerrero State, Mexico. In this investigation, we present the results of a vertical magnetic-parameters prospecting and chemical characterization of 26 tailing samples from the El Fraile I. Magnetic-method results stand out diverse deposit layers of variable mineral concentration and composition, as easily identified in the stratigraphic column. The old dam's long evolution period is corroborated by the variable and much lower than 1 S-300 ratio values (high oxidation degree of the magnetic mineralogy) and the mostly acid pH character through the whole dam. Most maximum potential toxic elements concentration values are under the maximum permissible levels for agriculture/residential use, except for those of Pb, Cu, and Zn. An advantageous proxy method for a quick and cost-effective heavy metal evaluation of mining-wastes dams results from simple sample preparation and fast magnetic and elemental concentration estimations, together with a suitable systematic sampling distribution.
Keywords::
rock-magnetic parameters, potentially toxic elements, Taxco tailings, Guerrero state
1. Introduction
Among the different economic activities in Mexico, mining stands as one of the most traditional of them, practiced since pre-Hispanic times (Pollard, 1987; Maldonado and Rehren, 2009). It is also a regional expansion source since the Colony and plays a critical modernization and expansion role, contributing 2.05% of the country's gross domestic product (Secretaría de Economía, 2024), by supplying raw materials to virtually all sorts of industries (e.g., construction, metallurgical, steel, chemistry, electronics).
-
Pollard, 1987The Political Economy of Prehispanic Tarascan MetallurgyAmerican Antiquity, 1987
-
Maldonado and
Rehren, 2009Early copper smelting at Itziparátzico, MexicoJournal of Archaeological Science, 2009
-
Secretaría de
Economía, 2024Minería, 2024
Due to its long mining history of more than 450 years (Corona-Chávez et al., 2010), Taxco de Alarcón rises as one of the most important Mexican mining towns. It is located in the Guerrero State's northern area (Figure 1). The Taxco Mining District (TMD) is situated south of Taxco de Alarcón. Throughout the colonial period (1521-1810), Taxco mines produced huge silver and gold amounts to be considered among America's richest mines (Talavera-Mendoza et al., 2005). During this period, 5.6 Mt of tailings were generated and deposited in two valleys near the Cacalotenango River (Dótor-Almazán et al., 2017).
-
Corona-Chávez et al., 2010The impact of mining in the regional ecosystem: the Mining District of El Oro and Tlalpujahua, MexicoDe Re Metallica, 2010
-
Talavera-Mendoza et al., 2005Mineralogy and geochemistry of sulfide-bearing tailings from silver mines in the Taxco, Mexico area to evaluate their potential environmental impactGeofísica Internacional, 2005
-
Dótor-Almazán et al.,
2017Geochemical behavior of Cu and sulfur isotopes in the tropical mining region of Taxco, Guerrero (southern Mexico)Chemical Geology, 2017
Thumbnail
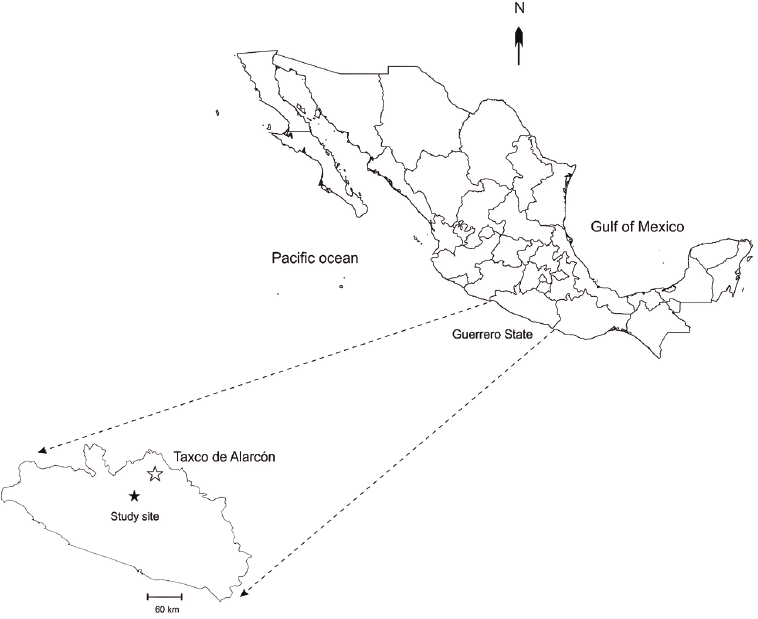
Figure 1
Location map of the study area. The hollow star highlights the Taxco de Alarcón locality, while the solid one indicates the El Fraile I tailings.
Location map of the study area. The hollow star highlights the Taxco de Alarcón locality, while the solid one indicates the El Fraile I tailings.
Its extensive mining history has produced seven mining waste deposits in the region (El Fraile I, La Concha, El Solar, Guerrero I, Guerrero II, Los Jales, and San Antonio), encompassing more than 55 million tons (Dótor-Almazán et al., 2017).
-
Dótor-Almazán et al., 2017Geochemical behavior of Cu and sulfur isotopes in the tropical mining region of Taxco, Guerrero (southern Mexico)Chemical Geology, 2017
The El Fraile I impoundment is an abandoned tailings dam (470 m × 372 m × 60 m) located 5 km SW of Taxco, showing a high oxidation degree and a yellow-reddish color. It was formed from the exploitation of Ag-Cu-Pb-Zn ores during 1940-1970 (Talavera-Mendoza et al., 2016).
-
Talavera-Mendoza et al.,
2016Water-rock-tailings interactions and sources of sulfur and metals in the subtropical mining region of Taxco, Guerrero (southern Mexico): a multi-isotopic approachApplied Geochemistry, 2016
However, this activity also has some negative impacts on the environment and health (Armienta et al., 2003; Ramos-Arroyo et al., 2004; Talavera-Mendoza et al., 2005), which frequently represent a severe problem for mining districts. Such waste accumulations have great polluting potential due to their high potentially toxic element (PTE) concentrations, as reported in various studies like Armienta et al. (2003), Talavera-Mendoza et al. (2005), Talavera-Mendoza et al. (2006), Méndez y Armienta (2012). For this reason, the study of the distribution and concentration of potentially toxic elements contained in mining wastes (tailings) is currently an issue of significant relevance (Talavera-Mendoza et al., 2006).
-
Armienta et al., 2003Geochemistry of Metals from Mine Tailings in Taxco, MexicoBulletin of Environmental Contamination and Toxicology, 2003
-
Ramos-Arroyo et al.,
2004Características geológicas y mineralógicas e historia de extracción del Distrito de Guanajuato, México. Posibles escenarios geoquímicos para los residuos minerosRevista Mexicana de Ciencias Geológicas, 2004
-
Talavera-Mendoza et
al., 2005Mineralogy and geochemistry of sulfide-bearing tailings from silver mines in the Taxco, Mexico area to evaluate their potential environmental impactGeofísica Internacional, 2005
-
Armienta et al.
(2003)Geochemistry of Metals from Mine Tailings in Taxco, MexicoBulletin of Environmental Contamination and Toxicology, 2003
-
Talavera-Mendoza et
al. (2005)Mineralogy and geochemistry of sulfide-bearing tailings from silver mines in the Taxco, Mexico area to evaluate their potential environmental impactGeofísica Internacional, 2005
-
Talavera-Mendoza
et al. (2006)Geochemistry of leachates from the El Fraile I sulfide tailings piles in Taxco, Guerrero, southern MexicoEnvironmental Geochemistry and Health, 2006
-
Méndez y Armienta (2012)Distribución de Fe, Zn, Pb, Cu, Cd y As originada por residuos mineros y aguas residuales en un transecto del Río Taxco en Guerrero, MéxicoRevista Mexicana de Ciencias Geológicas, 2012
-
Talavera-Mendoza et al., 2006Geochemistry of leachates from the El Fraile I sulfide tailings piles in Taxco, Guerrero, southern MexicoEnvironmental Geochemistry and Health, 2006
Although different investigations: Armienta et al. (2003), Talavera-Mendoza et al. (2005), Dótor-Almazán et al. (2017), have been carried out on mine tailings in Taxco, waste-dump physical characteristics (color, oxidation state, etc.) on the one hand, and a limited number of samples per waste-dump (10, between 5 - 15, and 2, respectively) on the other hand, seems to have guided the sampling strategy, rather than a systematic and an exhaustive one. The low number of samples per waste dump taken could be justified due to standard methodologies used normally require ultra-pure facilities, high-purity reagents, and long processing time, making them generally expensive. Therefore, an alternative economic and rapid procedure allowing reliable PTE concentration estimation would be desirable; this would allow economic resources, time, and effort to be directed toward areas with the most significant impact or interest.
-
Armienta et
al. (2003)Geochemistry of Metals from Mine Tailings in Taxco, MexicoBulletin of Environmental Contamination and Toxicology, 2003
-
Talavera-Mendoza
et al. (2005)Mineralogy and geochemistry of sulfide-bearing tailings from silver mines in the Taxco, Mexico area to evaluate their potential environmental impactGeofísica Internacional, 2005
-
Dótor-Almazán et al. (2017)Geochemical behavior of Cu and sulfur isotopes in the tropical mining region of Taxco, Guerrero (southern Mexico)Chemical Geology, 2017
Different investigations have shown the correlation between magnetic susceptibility and heavy metal content (Petrovsky et al., 1998; Petrovsky et al., 2001; Ďurža, 1999; Shu et al., 2001). This correlation has been attributed to the incorporation of heavy metal elements into the lattice structure of the ferrimagnetics during combustion, or alternatively to their adsorption onto the surface of the ferrimagnetics present in the environments (Petrovsky et al., 1998).
-
Petrovsky et
al., 1998Correlation between magnetic parameters and chemical composition of lake sediments from Northern Bohemia- preliminary studyPhysics and Chemistry of the Earth, 1998
-
Petrovsky
et al., 2001Magnetic properties of alluvial soils contaminated with lead, zinc and cadmiumJournal of Applied Geophysics, 2001
-
Ďurža,
1999Heavy metals contamination and magnetic susceptibility in soils around metallurgical plantPhysics and Chemistry of the Earth, Part A: Solid Earth and Geodesy, 1999
-
Shu et al.,
2001Determining the sources of atmospheric particles in Shanghai, China, from magnetic and geochemical propertiesAtmospheric Environment, 2001
-
Petrovsky et
al., 1998Correlation between magnetic parameters and chemical composition of lake sediments from Northern Bohemia- preliminary studyPhysics and Chemistry of the Earth, 1998
Even though magnetic methods are now broadly applied in most areas of environmental investigation as a proxy for heavy metal pollution in industrial (e.g.,Petrovsky et al., 1998; Petrovsky et al., 2001; Ďurža, 1999) and urban regions (e.g., Shu et al., 2001; Aguilera et al., 2020), mining wastes, nevertheless, have hardly been investigated by magnetic methods (Matasova et al., 2005).
-
Petrovsky et
al., 1998Correlation between magnetic parameters and chemical composition of lake sediments from Northern Bohemia- preliminary studyPhysics and Chemistry of the Earth, 1998
-
Petrovsky
et al., 2001Magnetic properties of alluvial soils contaminated with lead, zinc and cadmiumJournal of Applied Geophysics, 2001
-
Ďurža,
1999Heavy metals contamination and magnetic susceptibility in soils around metallurgical plantPhysics and Chemistry of the Earth, Part A: Solid Earth and Geodesy, 1999
-
Shu et al., 2001Determining the sources of atmospheric particles in Shanghai, China, from magnetic and geochemical propertiesAtmospheric Environment, 2001
-
Aguilera et al., 2020Spatial distribution of magnetic material in urban road dust classified by land use and type of road in San Luis Potosí, MexicoAir Quality, Atmosphere & Health, 2020
-
Matasova et al., 2005The use of magnetic methods in an environmental study of áreas polluted with non-magnetic wastes of the mining industry (Salair region, Western Siberia, Russia)Geochemistry: Exploration, Environment, Analysis, 2005
In the case of Mexican mining wastes, magnetic methods have only been systematically employed in a metallurgical area in the San Luis Potosí State, Mexico (Pérez et al., 2014), and in two western Mexico mining districts: Tlalpujahua-El Oro (Morales et al., 2016), and Angangueo (Hernández-Bernal et al., 2016).
-
Pérez et al., 2014Magnetic susceptibility and electrical conductivity as a proxy for evaluating soil contaminated with arsenic, cadmium and lead in a metallurgical area in the San Luis Potosi State, MexicoEnvironmental Earth Sciences, 2014
-
Morales et al., 2016Further evidence for magnetic susceptibility as a proxy for the evaluation of heavy metals in mining wastes: case study of Tlalpujahua and El Oro Mining DistrictsEnvironmental Earth Sciences, 2016
-
Hernández-Bernal et al.,
2016Combined rock-magnetic and geochemical characterization of Angangueo mining district, central MexicoEnvironmental Earth Sciences, 2016
In this study, the results of a methodical and comprehensive rock-magnetic and geochemical vertical survey of the El Fraile I mining-waste deposits (the oldest of the region) are presented, emphasizing their variations with the dam's depth. To achieve this aim, magnetic, physicochemical, and geochemical methods were applied.
2. Materials and methods
2.1. MATERIALS
Twenty-six tailing samples from the El Fraile I dam were collected during a field campaign at the TMD. A vertical (from top to dam's base) sampling was carried out, visually identifying the different horizons. At each horizon, approximately half a kilogram was collected and deposited into previously labeled and georeferenced polyethylene bags. Figure 2 shows the sampling points at the El Fraile I dam. The samples were kept for two weeks in a dry room away from direct sunlight and wind to avoid possible microorganism growth and cross-contamination at the laboratory facilities.
Thumbnail
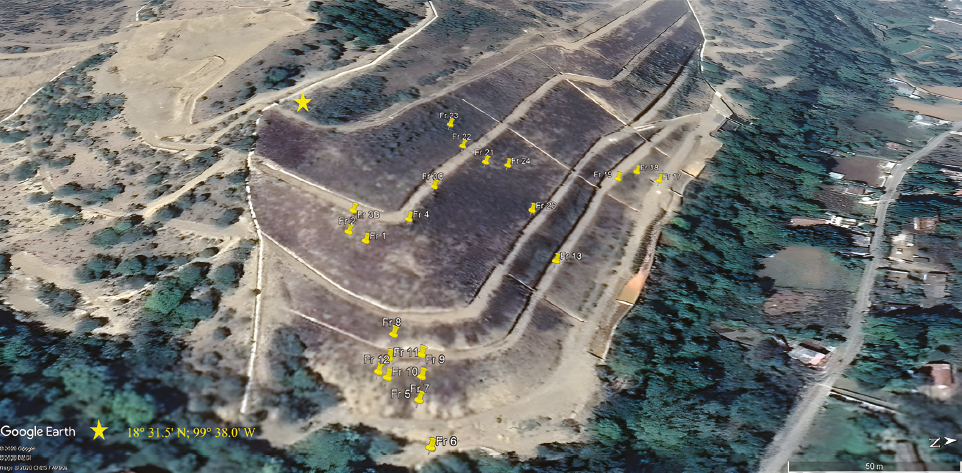
Figure 2
Distribution of the sampling points at the El Fraile I dam.
Distribution of the sampling points at the El Fraile I dam.
Mineralogy identification was carried out by microscopic observation of the samples spread on a petri dish. Sample preparation consisted of manually crushing ~250 g of the sample up to a particle size of clay using an agate mortar.
2.2. MAGNETIC METHODS
Half of the material of each bag was manually crushed using an agate mortar and sieved using a #10 plastic mesh (nominal aperture of 2 mm). Standard paleomagnetic acrylic cubes (8 cm3) were filled with the milled samples for magnetic analysis.
An assortment of standard magnetic techniques was employed to magnetically characterize the samples under study:
(i) Magnetic susceptibility measurements at low (κLF) and high (κHF) frequency using a Bartington MS2 susceptibilimeter. From these low- and high-frequency results, the percent frequency-dependent magnetic susceptibility was determined (Dearing et al., 1996).
-
Dearing et
al., 1996Frequency-dependent susceptibility measurements of environmental materialsGeophysical Journal International, 1996
(ii) Induction of a laboratory anhysteretic magnetization (ARM) through the superposition of a 100 mT AC magnetic field over a 50 μT DC magnetic field using an AGICO LDA 3 demagnetizes (iii) Stepwise acquisition of isothermal remanent magnetization (IRM) curves up to 1 T using an ASC Scientific IM-10 pulse magnetizer. Magnetization acquired at this last step was considered as saturation isothermal magnetization (SIRM). (vi) Backfield magnetization induction at 300 mT (IRM-0.3 T) for the S-300 ratio estimation employing the following formula (Thompson and Oldfield, 1986):
-
Thompson and Oldfield, 1986Environmental Magnetism, 1986
(v) Acquisition of magnetization vs temperature (M-T) curves using a variable field translation balance (VFTB) up to 600°C, at a heating/cooling rate of 20°C/min. In all cases, the remanent magnetizations were measured using an Agico JR-6 spinner magnetometer.
2.3. ELEMENTAL COMPOSITION
Pressed-pellet samples were prepared for geochemical analysis by mixing and homogenizing within the same agate mortar 3 g of the milled material with 0.5 g of wax-C micro powder (Hoechst). A 3-mm-diameter stainless-steel die and an Atlas (Specac) hydraulic press were employed for pressing up to 20 tons for two minutes the material deposited into the die.
The samples' chemical composition (both major and trace elements) was obtained through energy dispersive (ED) X-ray fluorescence using a Xenemetrix 50-kV-tube X-Calibur ED-XRF spectrometer.
2.4. PHYSICOCHEMICAL ANALYSIS
Five grams of the milled material were dissolved into 50 ml of distilled water and stirred for half an hour for physicochemical analyses. An HI 2020 multi-parametric kit was used for the physical-chemical properties: pH and electrical conductivity (EC) determination.
All analyses were carried out at the Laboratorio Universitario de Geofísica Ambiental (LUGA) facilities, Instituto de Geofísica Unidad Michoacán.
3. Results
3.1. PHYSICAL AND MAGNETIC RESULTS
The El Fraile I dam's surface shows a series of contrasting and intercalated red, ochre-reddish, green, ochre-greenish, and green-yellowish layers (Figure 3). This sequence presents an alternation of partially well-consolidated sand layers of coarse, medium, and fine grain sizes. Table 1 summarizes the textural and mineralogical characteristics of the analyzed samples.
Thumbnail
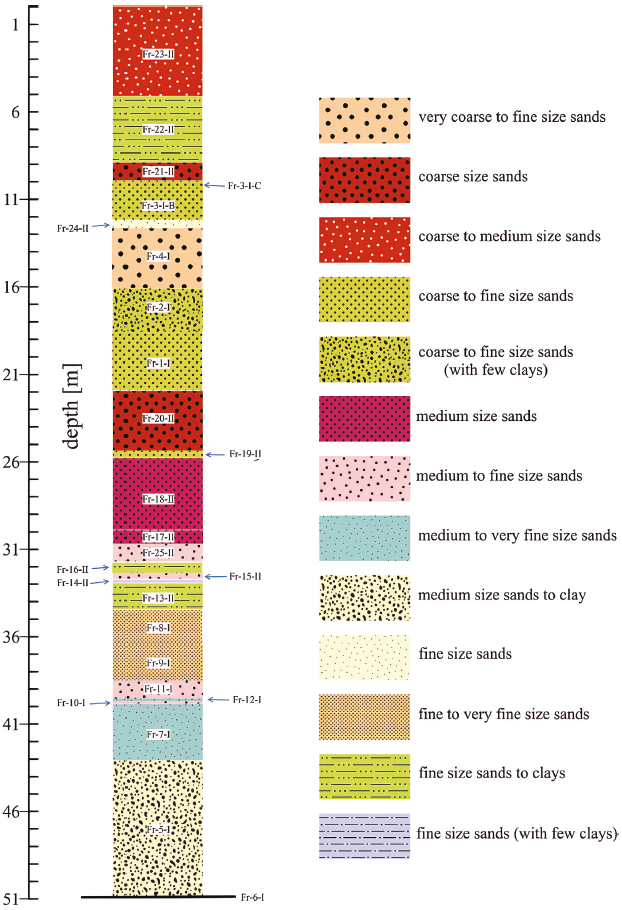
Figure 3
El Fraile I stratigraphic column.
El Fraile I stratigraphic column.
Table 1
Textural and mineralogical characteristics. Py: pyrite; Qz: quartz; Hm: hematite; Mt: magnetite; Ca: calcium; Gy: gypsum.
Textural and mineralogical characteristics. Py: pyrite; Qz: quartz; Hm: hematite; Mt: magnetite; Ca: calcium; Gy: gypsum.
| Depth |
Sample | Color | Size | Consolidation |
Mineralogy | Structure |
|---|---|---|---|---|---|---|
| 0.0 | Fr 23-11 | Reddish | eoarse to medium size sands | consolidated | Qz + Hm + Mt | |
| 5.2 | Fr 22-11 | Yellow greenish | fine size sands to elays | slight consolidated | Qz + Hm + Mt | |
| 8.9 | Fr 21-11 | Ochre-reddish | eoarse size sands | well consolidated | Qz + Hm + Mt + Gy | |
| 10.0 | Fr 3-IC | Green yellowish | eoarse to fine size sands | partially consolidated | Qz + Hm + Mt | |
| 10.3 | Fr 3-IB | Green yellowish | eoarse to fine size sands | |||
| 12.2 | Fr 24-11 | Greenish | fine sands | partially consolidated | Qz + Hm + Mt | |
| 12.7 | Fr4-I | Green yellowish | very eoarse to fine size sands | partially consolidated | Qz + Mt | |
| 16.1 | Fr2-I | Green yellowish | eoarse to fine size sands (few elays) | partially consolidated | Qz + Mt | peak shape structures |
| 18.5 | Fr 1-1 | Red Ochre | eoarse to fine size sands | partially consolidated | Qz + Hm + Mt + Ca | |
| 21.9 | Fr 20-11 | Red Ochre | eoarse size sands | consolidated | Qz + Hm + Mt + Ca + Gy | peak shape structures |
| 25.4 | Fr 19-11 | Red greenish | eoarse to fine size sands | well consolidated | Qz + Hm + Mt + Ca + Gy | |
| 25.7 | Fr 18-11 | Reddish | medium size sands | well consolidated | Qz + Hm + Ca + Gy | fine lamellae |
| 30.0 | Fr 17-11 | Reddish | medium size sands | well consolidated | Qz + Hm + Mt + Ca | fine lamellae |
| 30.6 | Fr 25-11 | Ochre-reddish | medium to fine size sands | consolidated | Qz + Hm + Mt + Ca + Gy | |
| 31.8 | Fr 16-11 | Greenish | fine size sands to elays | partially consolidated | Qz + Hm + Mt | peak shape structures |
| 32.3 | Fr 15-11 | Ochre-reddish | medium size sands to elays | consolidated | Qz + Hm + Gy | |
| 32.7 | Fr 14-11 | Red | medium size sands - elays | well consolidated | Qz + Hm + Ca + Gy | peak shape structures |
| 33.0 | Fr 13-11 | Green Ochre | fine sands to elays | consolidated | Qz + Hm + Ca | peak shape structures |
| 34.5 | Fr8-I | Red | fine to very fine size sands | well consolidated | Qz + Hm + Mt + Ca | |
| 36.5 | Fr9-I | Ochre | fine to very fine size sands | consolidated | Qz + Hm + Ca + Gy | |
| 38.5 | Fr 11-1 | Light brown reddish | medium size sands - elays | consolidated | Qz + Hm + Mt + Ca + Gy | peak shape structures |
| 39.6 | Fr 12-1 | Ochre-reddish | medium to very fine size sands | petrified | Qz + Mt + Py + Ca + Gy | |
| 39.7 | Fr 10-1 | Ochre-reddish | medium to fine size sands | petrified | Qz + Hm + Ca + Gy | |
| 39.9 | Fr 7-1 | Green yellowish | medium to very fine size sands | well consolidated | Qz + Hm + Ca + Gy | peak shape structures |
| 43.1 | Fr 5-1 | Yellow reddish | medium size sands - elays | partially consolidated | Qz + Hm + Ca + Gy | peak shape structures |
| 50.9 | Fr 6_I | Red | medium to fine size sands | well consolidated | Qz + Hm + Ca + Gy | peak shape structures |
IRM acquisition curves show that (in most cases) low fields between 200-300 mT can produce IRM values close to 90 % of saturation (Figure 4a, 4b), pointing to low coercivity minerals as remanence carriers. In some other cases, IRM acquisition curves display a slight increase at higher fields, possibly related to a small contribution of a high coercivity mineral, likely hematite (Figure 4c).
Thumbnail
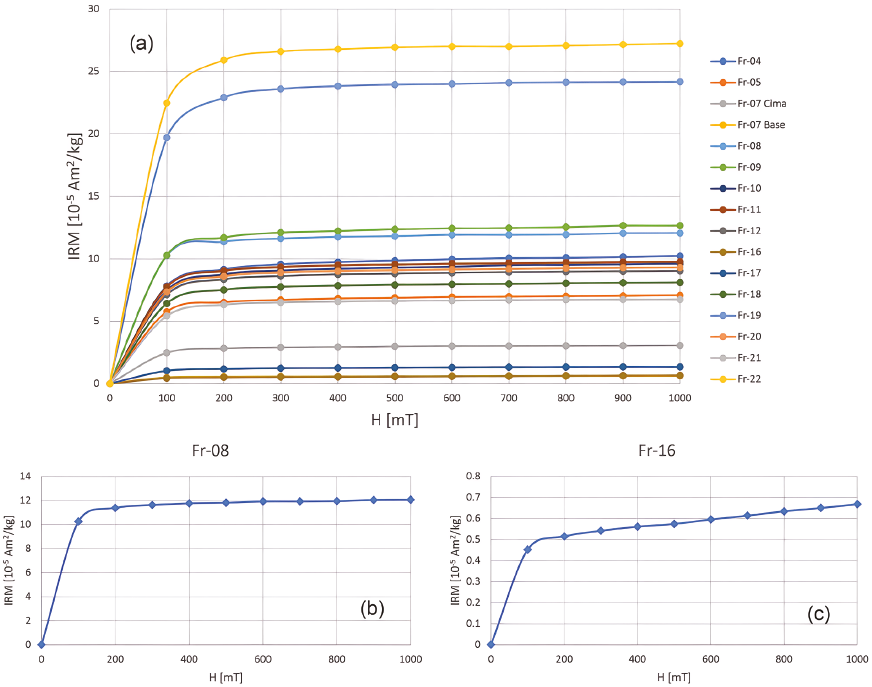
Figure 4
Representative IRM plots for the El Fraile I dam (a). Example of a saturated (b) and unsaturated (c) IRM plot.
Representative IRM plots for the El Fraile I dam (a). Example of a saturated (b) and unsaturated (c) IRM plot.
From the M-T curves, it is evident that magnetite or low Ti titanomagnetite (Tc ~ 575°C) is the main responsible for the magnetization. In the specific case of sample Fr-2-I (Figure 5b), a notorious Hopkinson peak is observed, which indicates the magnetic carrier is pure magnetite. Also observed are intermediate temperature (Tc < 500°C) magnetic phases, which are not present at the cooling branch (Figure 5a, 5c). Quite irreversible M-T curves are obtained in almost all samples analyzed, which suggests the formation of new magnetic mineralogy.
Thumbnail
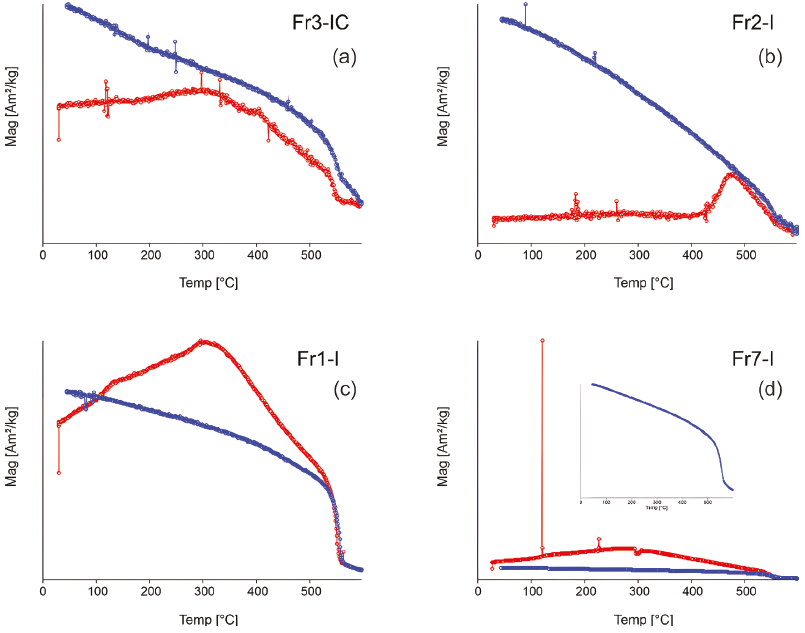
Figure 5
Representative M-T curves of the samples from the El Fraile I dam, collected at (a) 10.0, (b) 16.0, (c) 18.5, and (d) 39.9 m depths. The inset in (d) shows that the plot is similar to that displayed in (c). Red/blue branch corresponds to the heating/cooling process.
Representative M-T curves of the samples from the El Fraile I dam, collected at (a) 10.0, (b) 16.0, (c) 18.5, and (d) 39.9 m depths. The inset in (d) shows that the plot is similar to that displayed in (c). Red/blue branch corresponds to the heating/cooling process.
Magnetic susceptibility shows an average value of 1 × 10⁻³ through the entire vertical profile (~ 50-m-depth), with a moderate peak value at 8.9 m, and other three more pronounced peaks at intermediate depths of 25.4 m, 30.6 m, and 32.3 m (Figure 6a). The aforementioned peak values are associated with reddish-ochre color layers.
Thumbnail
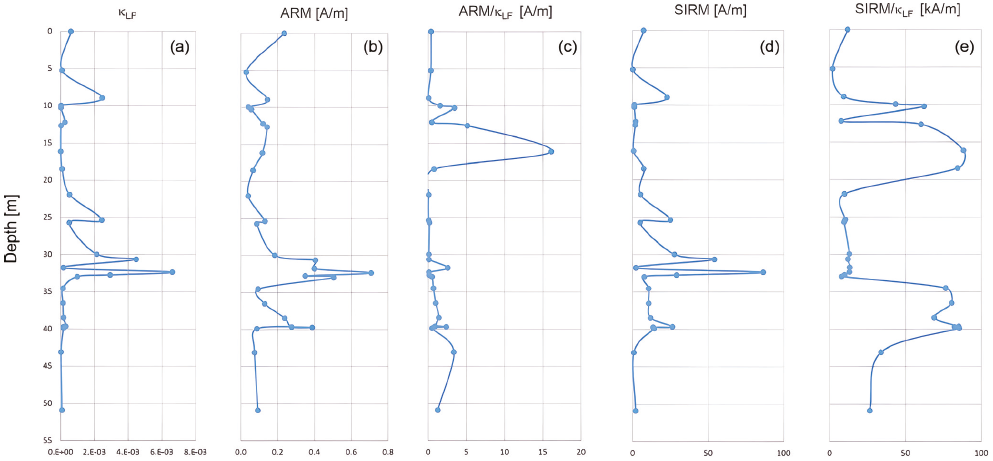
Figure 6
Concentration, grain-size, and composition dependent rock-magnetic parameters in the vertical ground profile of the El Fraile I dam.
Concentration, grain-size, and composition dependent rock-magnetic parameters in the vertical ground profile of the El Fraile I dam.
ARM acquisition curves show a similar trend to that followed by κ, except in the intervals from 10 to 22 and 35 to 40 m depth (Figure 6b). ARM/κLF curves show a marked peak at 16.1 m depth, which is not present at the ARM plot (Figure 6c). A general fining of the magnetic grain-size will show an increase in this ratio (Vigliotti et al., 2008).
-
Vigliotti et
al., 2008Palaeomagnetic and rock magnetic analysis of Holocene deposits from the Adriatic Sea: detecting and dating short-term fluctuations in sediment supplyThe Holocene, 2008
A very similar tendency to that of κ is followed by the SIRM plot (Figure 6d). The above-mentioned (moderate and more pronounced) peak values observed in the κ plot are also present in the SIRM log, but not in the SIRM/κLF plot, indicating a concentration- rather than a composition-variation origin of these out-of-trend values. On the contrary, two noticeable peaks at the intervals 10.0 to 18.5 and 34.5 to 39.9 m depth are seen in the SIRM/κLF plot (Figure 6e), which suggests a composition- rather than a concentration-variation origin of these out-of-trend values. These peak values could also be interpreted as variations in the grain size of the magnetite (Thompson et al., 1980; Evans and Heller, 2003).
-
Thompson et al.,
1980Environmental Applications of Magnetic MeasurementsScience, 1980
-
Evans and Heller,
2003Environmental magnetism - Principles and Applications of Enviromagnetics, 2003
κFD % shows more considerable variations, up to 7% (Figure 7b), especially at the upper part of the dam. These high κFD % values suggest a significant contribution of (fine particle-size) superparamagnetic ferrimagnetic minerals -in good agreement with the stratigraphic column-, especially at the dam's upper part (12.2-18.5 m-depth), and with the peak value (16.1 m depth) present in the ARM/κLF plot. The middle part is characterized by close to zero values.
Thumbnail
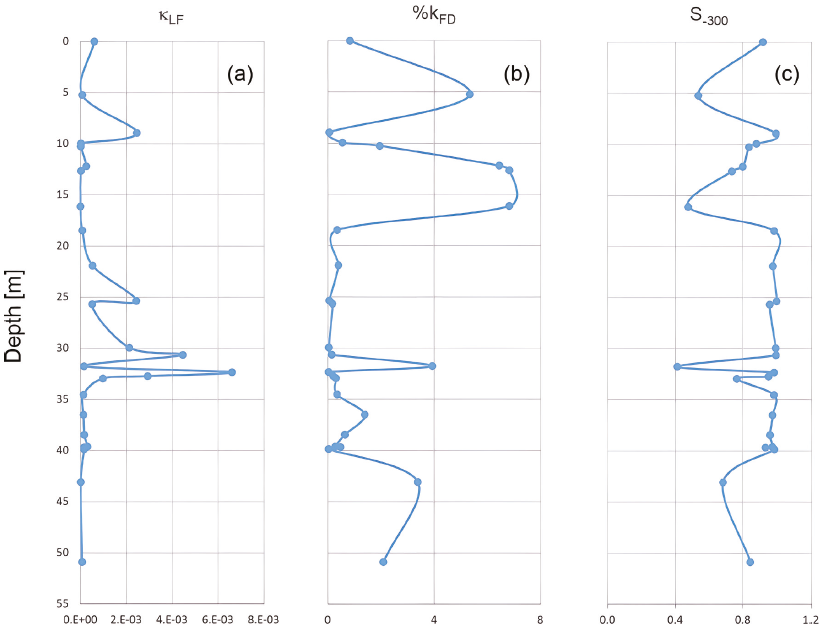
Figure 7
(a) Volume magnetic susceptibility κLF (b) κFD %, and (c) S-300 ratio in the vertical ground profile of the El Fraile I dam.
(a) Volume magnetic susceptibility κLF (b) κFD %, and (c) S-300 ratio in the vertical ground profile of the El Fraile I dam.
Large variations (0.92-0.48) of the S-300 ratio are observed at the upper part of the El Fraile I dam (Figure 7c), particularly at the interval 12.2-18.5 m-depth, suggesting variable and significant hematite contribution. The middle part shows a more consistent behavior with an average value of 0.92%, except at 31.8 m depth. Worth noting is that maxima in the κFD % plot are associated with minima at the corresponding S-300 plot.
3.2. PHYSICOCHEMICAL RESULTS
Thumbnail
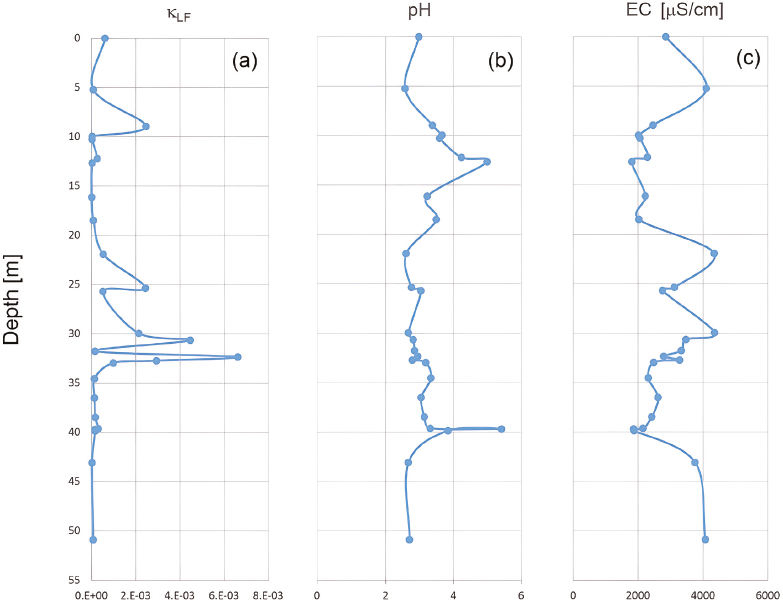
Figure 8
Corresponding physicochemical parameters (pH and EC) in the vertical ground profile of the El Fraile I dam. Figure 5a is again reproduced for comparison purposes
Corresponding physicochemical parameters (pH and EC) in the vertical ground profile of the El Fraile I dam. Figure 5a is again reproduced for comparison purposes
While pH is the measurement of a specific ion (i.e., hydrogen) within a sample, EC is a non-specific measurement of the concentration of both positively and negatively charged ions within it. As shown in Figure 8c, EC shows a mirrored trend to that of pH. This opposite behavior could be likely explained by considering that the presence of any hydrogen ions present in a substance will affect the pH level and, most probably, also influence conductivity levels. Nevertheless, hydrogen ions make up only a small part of the ion concentration measured by a conductivity meter.
3.3. GEOCHEMISTRY RESULTS
Heavy metal elemental composition variations correlate, in general, with that of κLF; peak/trough values in half of the elements correspond to κLF peak/trough values, except for V, Ni, and Zn. Those of Pb, Ni, and Zn show significant variations. On the contrary, within the lowermost κ stable trend (34.5-50.9 m-depth), all elemental compositions show a uniformly increasing or decreasing trend, except Ni, which remains almost constant (Figure 9b-g). Worth noting is the high total Fe values, between 10 and 20 wt./%, throughout the entire vertical profile.
Thumbnail
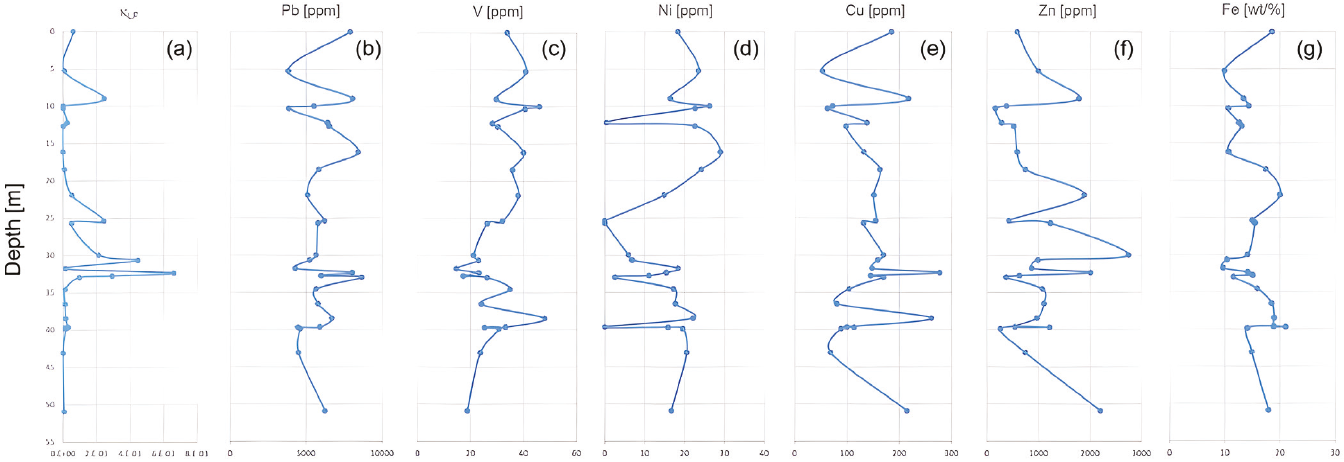
Figure 9
Associated heavy metal concentrations through the El Fraile I profile. Figure 5a is again reproduced for comparison purposes.
Associated heavy metal concentrations through the El Fraile I profile. Figure 5a is again reproduced for comparison purposes.
Following Talavera-Mendoza et al. (2005), metal concentrations of tailings are compared against regional background concentrations (RBC) of crop soils to estimate enrichment ratios of tailings relative to regional pristine soils. Through this comparison (Table 2), it is evident that the El Fraile I tailings are highly enriched in all reported elements -mainly in Pb and Zn-, except in V A summary of the elemental composition and the corresponding statistical description of κLF and PTEs concentration in the El Fraile I tailing samples is presented in Table 2.
-
Talavera-Mendoza et
al. (2005)Mineralogy and geochemistry of sulfide-bearing tailings from silver mines in the Taxco, Mexico area to evaluate their potential environmental impactGeofísica Internacional, 2005
Table 2
Elemental composition and statistical description of κLF and PTEs concentration in the El Fraile tailing samples. Concentration values in mg/kg, except for Fe (wt./%). RBC: Regional background concentration; MPL: Maximum permissible levels according to SEMARNAT (2007); AEF: Average enrichment factor; N.A.: Not available.
Elemental composition and statistical description of κLF and PTEs concentration in the El Fraile tailing samples. Concentration values in mg/kg, except for Fe (wt./%). RBC: Regional background concentration; MPL: Maximum permissible levels according to SEMARNAT (2007); AEF: Average enrichment factor; N.A.: Not available.
| Depth [m] | Sample | κlf [unitless] | Pb | V | Ni | Cu | Zn | Fe |
|---|---|---|---|---|---|---|---|---|
| 0.0 | Fr 23-11 | 6.13E-04 | 7892.6 | 33.8 | 18.4 | 185.1 | 585.9 | 18.5 |
| 5.2 | Fr 22-11 | 8.12E-05 | 3824.1 | 40.8 | 23.5 | 52.9 | 999.0 | 9.9 |
| 8.9 | Fr21-II | 2.46E-03 | 8041.1 | 29.7 | 16.4 | 217.3 | 1786.0 | 13.4 |
| 10.0 | Fr 3-1 C | 2.61E-05 | 5514.3 | 46.0 | 26.3 | 72.8 | 377.4 | 14.3 |
| 10.3 | Fr 3-1 B | 1.67E-05 | 3876.8 | 40.6 | 22.6 | 62.8 | 163.6 | 10.6 |
| 12.2 | Fr 24-11 | 2.54E-04 | 6414.0 | 28.3 | 0.5 | 138.0 | 283.8 | 12.5 |
| 12.7 | Fr4-I | 2.79E-05 | 6509.5 | 30.3 | 22.6 | 98.3 | 520.0 | 13.1 |
| 16.1 | Fr2-I | 7.30E-06 | 8423.2 | 40.0 | 29.0 | 132.3 | 586.0 | 10.7 |
| 18.5 | Fr 1-1 | 8.77E-05 | 5828.5 | 35.8 | 24.2 | 163.1 | 744.5 | 17.4 |
| 21.9 | Fr 20-11 | 5.33E-04 | 5094.6 | 38.0 | 14.9 | 151.2 | 1888.1 | 20.0 |
| 25.4 | Fr 19-11 | 2.44E-03 | 6214.8 | 32.0 | 0.0 | 155.0 | 427.5 | 15.0 |
| 25.7 | Fr 18-11 | 5.15E-04 | 5788.1 | 26.3 | 0.0 | 131.8 | 1231.5 | 15.4 |
| 30.0 | Fr 17-11 | 2.13E-03 | 5655.8 | 21.1 | 5.9 | 169.4 | 2744.7 | 14.1 |
| 30.6 | Fr 25-11 | 4.47E-03 | 5233.5 | 23.0 | 6.9 | 158.8 | 985.3 | 10.4 |
| 31.8 | Fr 16-11 | 1.56E-04 | 4294.8 | 14.7 | 18.3 | 148.1 | 866.6 | 9.7 |
| 32.3 | Fr 15-11 | 6.61E-03 | 8022.0 | 23.1 | 15.4 | 277.2 | 2008.3 | 14.1 |
| 32.7 | Fr 14-11 | 2.94E-03 | 5990.1 | 17.3 | 11.0 | 145.3 | 626.5 | 15.0 |
| 33.0 | Fr 13-11 | 9.85E-04 | 8642.8 | 26.2 | 2.5 | 169.5 | 370.7 | 11.6 |
| 34.5 | Fr8-I | 1.38E-04 | 5660.9 | 34.9 | 17.2 | 103.7 | 1074.6 | 15.9 |
| 36.5 | Fr9-I | 1.32E-04 | 5772.7 | 24.1 | 17.7 | 80.8 | 1103.2 | 18.5 |
| 38.5 | Fr 11-1 | 1.72E-04 | 6693.3 | 47.9 | 22.1 | 261.2 | 967.1 | 18.9 |
| 39.6 | Fr 12-1 | 3.09E-04 | 5906.7 | 33.2 | 0.0 | 99.8 | 544.8 | 18.8 |
| 39.7 | Fr 10-1 | 1.64E-04 | 4479.6 | 25.3 | 15.8 | 113.4 | 1214.2 | 21.0 |
| 39.9 | Fr 7-1 | 1.67E-04 | 4607.7 | 30.7 | 19.6 | 88.5 | 261.5 | 14.1 |
| 43.1 | Fr 5-1 | 2.23E-05 | 4502.9 | 23.7 | 20.5 | 68.7 | 741.2 | 14.9 |
| 50.9 | Fr6-I | 7.39E-05 | 6237.7 | 18.7 | 16.7 | 214.4 | 2196.7 | 17.9 |
| # Samples | 26 | 26 | 26 | 26 | 26 | 26 | 26 | |
| Average | 9.8E-04 | 5966.2 | 30.2 | 14.9 | 140.7 | 973.0 | 14.8 | |
| Standard deviation | 1.6E-03 | 1361.3 | 8.7 | 8.8 | 58.3 | 661.4 | 3.3 | |
| CoefF. of variation [%] | 1.7E+00 | 22.8 | 28.7 | 59.1 | 41.4 | 68.0 | 22.1 | |
| Minimum | 7.3E-06 | 3824.1 | 14.7 | 0.0 | 52.9 | 163.6 | 9.7 | |
| Maximum | 6.6E-03 | 8642.8 | 47.9 | 29.0 | 277.2 | 2744.7 | 21.0 | |
| Range | 6.6E-03 | 4818.7 | 33.2 | 29.0 | 224.3 | 2581.1 | 11.3 | |
| Standardized bias | 4.73 | 0.92 | 0.54 | -1.16 | 1.31 | 2.39 | 0.26 | |
| RBC | N.A. | 26 | 40 | N.A. | 25 | 64 | 2.7 | |
| MPL | N.A. | 400 | 78 | 1600 | N.A. | N.A. | N.A. | |
| AEF | N.A. | 93 | 0.7 | N.A. | 2.8 | 50.1 | 5.9 | |
-
SEMARNAT (2007)Norma Oficial Mexicana que establece los criterios para determinar las concentraciones de remediación de suelos contaminados por arsénico, bario, berilio, cadmio, cromo hexavalente, mercurio, níquel, plata, plomo, selenio, talio y/o vanadio (NOM-147-SEMARNAT/SSA1-2004)Diario Oficial de la Federación, 2007
4. Discussion
Both low- and high-coercivity minerals are present in the El Fraile I dam as remanence carriers, as shown by the IRM curves (Figure 4).
As evidenced from the M-T curves, magnetite, or low Ti titanomagnetite is the main responsible for the magnetization, although intermediate temperature magnetic phases are also present. Quite irreversible M-T curves are obtained in almost all samples analyzed, which suggests the formation of new magnetic mineralogy (Figure 5).
A general fining of the magnetic grain size at the first third part (top up to 20 m depth) is evidenced by the ARM/κLF plot (Figure 6c).
Magnetic susceptibility (and SIRM, as well) vertical survey stands out different layers of variable ferrimagnetic mineral concentration or composition, in good agreement with the stratigraphic column. However, the concentration-independence character of the SIRM/κLF points to grain size or mineralogical differences rather than concentration variations as the cause of the observed trends (Figure 6d).
As in the case of the ARM/κLF plot, a general fining of the magnetic grain size is evidenced by the κFD % plot and the S-300 ratio values for the same section (first upper part of the sequence) (Figure 6e).
The results above mentioned highlight the usefulness of the magnetic methods as a proxy for stratigraphy and mineral concentration of a depositional sequence.
The old dam's long evolution period could be suggested by the variable and significantly low value of the S-300 ratio (high oxidation degree of the magnetic mineralogy) and the mostly acid pH character throughout the whole dam.
As noted above, peak values in half of the elements correspond to κLF peak values throughout the whole deposit, although at the lowermost κ stable trend (34.5-50.9 m-depth), all elemental compositions show a uniformly increasing or decreasing trend.
Because of the scarce number of rock-magnetic investigations on this kind of anthropogenic origin systems, no regional background concentration (RBC) for κ is available for this investigation, precluding the estimation of an average enrichment factor (AEF). Nonetheless, considering the complex metal speciation within the layers (sulfides and/or sulfosalts), an estimation of an AEF would be likely nonsense.
As seen in Table 2, Pb, Cu, and Zn are the elements with a major variability within the profile (range of 4818.7, 224.3, and 2581.1, respectively). Pb and Zn are the elements with a significantly average enrichment factor (AEF).
From Table 3, the strong positive correlation between κLF and SIRM (cc = 0.9425) suggests either that a single magnetic mineral is responsible for carrying the SIRM, causing the κLF in the samples, or that the dominant minerals were in constant proportions throughout the different layers (Thompson et al., 1975).
-
Thompson et al.,
1975Magnetic susceptibility of lake sedimentsLimnology and Oceanography, 1975
Table 3
Correlation matrix. Concentration values in mg/kg, except for Fe [wt./%]. Cell's colors reflect the correlation factor value between the corresponding parameters; Green means a total correlation (1.000), while red a total inverse correlation (-1.000). Intermediate colors meaning lower than ± 1.000.
Correlation matrix. Concentration values in mg/kg, except for Fe [wt./%]. Cell's colors reflect the correlation factor value between the corresponding parameters; Green means a total correlation (1.000), while red a total inverse correlation (-1.000). Intermediate colors meaning lower than ± 1.000.
| Depth |
κLF | κLF % | ARM |
SRIM [A/m] |
S-300 |
SRIM/κLF |
ARM/κLF |
SRIM/ARM |
pH | EC |
Pb | V | Ni | Cu | Zn | Fe | |
|---|---|---|---|---|---|---|---|---|---|---|---|---|---|---|---|---|---|
| Depth [m] | 1.0000 | ||||||||||||||||
| XLF | 0.0769 | 1.0000 | |||||||||||||||
| κLF | -0.3376 | -0.3830 | 1.0000 | ||||||||||||||
| ARM | 0.3059 | 0.6712 | -0.2544 | 1.0000 | |||||||||||||
| SRIM | 0.2319 | 0.9425 | -0.4522 | 0.7094 | 1.0000 | ||||||||||||
| S-300 | 0.1999 | 0.3672 | -0.7986 | 0.0512 | 0.4597 | 1.0000 | |||||||||||
| SRIM/κLF | 0.2423 | -0.4589 | 0.0384 | -0.2207 | -0.2103 | 0.0791 | 1.0000 | ||||||||||
| ARM/κLF | -0.1397 | -0.2875 | 0.6205 | -0.1424 | -0.2952 | -0.6024 | 0.4306 | 1.0000 | |||||||||
| SRIM/ARM | 0.1682 | 0.5239 | -0.6544 | 0.0486 | 0.5690 | 0.7254 | -0.0383 | -0.4342 | 1.0000 | ||||||||
| pH | -0.1211 | -0.2908 | 0.2360 | 0.0024 | -0.1909 | 0.0363 | 0.4872 | 0.1883 | -0.2190 | 1.0000 | |||||||
| EC | 0.1594 | 0.2294 | -0.0384 | -0.0350 | 0.0973 | -0.1156 | -0.6507 | -0.2550 | 0.1072 | -0.7435 | 1.0000 | ||||||
| Pb | -0.1547 | 0.3238 | -0.0251 | 0.3596 | 0.2581 | 0.0994 | -0.1250 | 0.2158 | 0.0482 | -0.0409 | -0.2175 | 1.0000 | |||||
| V | -0.4855 | -0.3743 | 0.0776 | -0.4722 | -0.3223 | 0.0203 | 0.3594 | 0.2262 | -0.0877 | 0.1243 | -0.3483 | 0.0183 | 1.0000 | ||||
| Ni | -0.2398 | -0.3250 | 0.3186 | -0.2905 | -0.3079 | -0.3692 | 0.4365 | 0.4782 | -0 3393 | 0.1333 | -0.1774 | -0.1320 | 0.4250 | 1.0000 | |||
| Cu | 0.1535 | 0.5548 | -0.3172 | 0.5213 | 0.5159 | 0.2908 | -0.3201 | -0.1844 | 0.2743 | -0.2438 | 0.1601 | 0.6288 | -0.1746 | -0.1669 | 1.0000 | ||
| Zn | 0.2641 | 0.3637 | -0.2779 | 0.1315 | 0.3529 | 0.2587 | -0.2973 | -0.2328 | 0.3279 | -0.3278 | 0.5951 | 0.0784 | -0.3396 | -0.0839 | 0.4985 | 1.0000 | |
| Fe | 0.3515 | -0.1845 | -0.4635 | -0.0813 | -0.0247 | 0.5874 | 0.3238 | -0.2806 | 0.2066 | 0.1311 | -0.0464 | 0.0250 | 0.0858 | -0.0587 | 0.1909 | 0.2612 | 1.0000 |
The general fining of the magnetic grain size observed in Figure 6c is corroborated by the strong positive correlation coefficient (cc = 0.6205) between κFD % and ARM/κLF.
As expected, a strong negative correlation exists between pH and EC.
Also observed from Table 3 is a moderate negative correlation (cc = -0.4635) between kfd% and Fe. As mentioned by Kanu et al. (2017), "The significant negative correlation between Fe and k fd % further confirmed that Fe is of anthropogenic origin." As well, from Table 3, kLF ARM, and SIRM could be used as a proxy for V, according to the negative correlation coefficients obtained (-0.3743, -0.4722, and -0.3223, respectively). Similarly, most magnetic parameters seem to be good enough proxies for the evaluation of Ni, Cu, and Zn. A strong direct correlation between Pb and Cu contents is evident from the results presented in the matrix correlation (Table 3). Because of its long evolution period, health hazards are mainly due to the high Pb, Cu, and Zn concentrations.
-
Kanu et al. (2017)Investigating the potential of using environmental magnetism techniques as pollution proxy in urban road deposited sedimentInternational Journal of Environmental Science and Technology, 2017
As mentioned in the introduction, the El Fraile I impoundment is located 5 km SW of Taxco de Alarcón, and one could be tempted to think that the pollution problem is confined to the dam's surroundings. However, there is an adjacent problem directly linked to particulate matter (PM), the material accumulated in the dams; street dust (SD) pollution. SD is mainly composed of particles derived from anthropic processes (Dearing et al., 1996). As stated in Morales et al. (2020), "SD consists of a heterogeneous assortment of materials; some originated from natural processes...", but also from "Anthropic activities..., which is later released to the environment.".
-
Dearing et al., 1996Frequency-dependent susceptibility measurements of environmental materialsGeophysical Journal International, 1996
-
Morales et al.
(2020)Heavy metal content estimation in the Mexico City Street dust: an inter-method comparison and Pb levels assessment during the last decadeSN Applied Sciences, 2020
Fine particles of anthropic origin, particulate matter 10 pm in diameter or less (the so-called PM10 particles), are hosted by the SD, which contain magnetic minerals and traces of heavy metals (Cr, Cu, Pb, Zn, etc.) (Bautista et al., 2018). Due to their particular size and shape, PM10 particles can be inhaled by humans, which is why SD is considered a significant source of breathable air pollution (Amato et al., 2014).
-
Bautista et al., 2018Evidence of small ferrimagnetic concentrations in mice (Mus musculus) livers and kidneys exposed to the urban dust: a reconnaissance studyGeofísica Internacional, 2018
-
Amato
et al., 2014Urban air quality: the challenge of traffic non-exhaust emissionsJournal of Hazardous Materials, 2014
5. Conclusions
The results presented agree with those of previous studies. However, the systematic sampling distribution employed in this investigation enables us to obtain a broader view of the concentration and distribution within these deposits.
Considering that tailings of abandoned mining districts in Mexico are nowadays occupied and serve as settlements for various inhabitant groups (Hernández-Bernal et al., 2016), the study of the distribution and concentration of PTEs contained in mining wastes is currently an issue of significant relevance, as properly noted by Talavera-Mendoza et al. (2006). Unfortunately, as properly mentioned by Morales et al. (2023), "...waste impoundments are, at least in Mexico, unattended entities..." and "...neither a government nor a particular company would invest time, effort, and economic resources to investigate the dam's internal structure". This fact highlights the usefulness of magnetic susceptibility, and associated magnetic parameters, as a proxy for the investigation of waste dams.
-
Hernández-Bernal et al.,
2016Combined rock-magnetic and geochemical characterization of Angangueo mining district, central MexicoEnvironmental Earth Sciences, 2016
-
Talavera-Mendoza et al.
(2006)Geochemistry of leachates from the El Fraile I sulfide tailings piles in Taxco, Guerrero, southern MexicoEnvironmental Geochemistry and Health, 2006
-
Morales et al. (2023)Magnetic Susceptibility Prospecting and Geochemical Characterization of Taxco's Mining Waste Dam Guerrero I (Mexico)Quaternary, 2023
Simple (and non-destructive) sample preparation, and fast rock-magnetic and elemental concentration estimations, together with a suitable systematic sampling distribution, make XRF measurements an advantageous proxy method for a quick and cost-effective evaluation of contamination by heavy metals.
List of abbreviations
IRM: isothermal remanent magnetization.
IRM-0.3T: backfield magnetization at 300 mT.
PTEs: potentially toxic elements.
SIRM: saturation isothermal remanent magnetization.
TMD: Taxco Mining District.
Wt./%: weight percent.
κFD%: percent frequency-dependent magnetic susceptibility.
ΚHF: magnetic susceptibility measurements at high frequency.
ΚLF: magnetic susceptibility measurements at low frequency.
EC: electrical conductivity.
Availability of data and materials
The datasets used and/or analyzed during the current study are available from the corresponding author upon reasonable request.
Contributions of authors
MS and JM contributed to conceptualization. NP and JM contributed to the methodology. JM carried out the fieldwork. JM and NP performed formal analysis. JM contributed to writing-original draft preparation. All authors contributed to writing-review, and editing. MS acknowledges the support of UNAM-PAPIIT Project IA102413.
Financing
No funding was received.
Conflicts of interest
The author(s) declare(s) that they have no competing interests.
Handling editor
Claudia Gogorza
Acknowledgements
We thank María Felicidad Bogaló and an anonymous reviewer for their constructive comments and suggestions, which definitively improved the scientific content and the manuscript presentation. Undergraduate student Julio Gómez Rivera is acknowledged for his participation in the fieldwork and laboratory measurements.
References
- Aguilera, A., Morales, J.J., Goguitchaichvili, A., García-Oliva, F., Armendariz-Arnez, C., Quintana, P., Bautista, F., 2020, Spatial distribution of magnetic material in urban road dust classified by land use and type of road in San Luis Potosí, Mexico: Air Quality, Atmosphere & Health, 13, 951-963. https://doi.org/10.1007/s11869-020-00851-5. Links
- Amato, F., Cassee, F.R., van der Gon, H.A.C.D., Gehrig, R., Gustafsson, M., Hafner, W., Harrison, R.M., Jozwicka, M., Kelly, F.J., Moreno, T., Prevot, A.S., Schaap, M., Sunyer, J., Querol, X., 2014, Urban air quality: the challenge of traffic non-exhaust emissions: Journal of Hazardous Materials, 275, 31-36. https://doi.org/10.1016/j.jhazmat.2014.04.053. Links
- Armienta M.A., Talavera O., Morton O., Barrera M., 2003, Geochemistry of Metals from Mine Tailings in Taxco, Mexico: Bulletin of Environmental Contamination and Toxicology, 71, 387-393. https://doi.org/10.1007/s00128-003-0176-0. Links
- Bautista, F., Gonsebatt, M.E., Cejudo, R., Goguitchaichvili, A., Delgado, M.C., Morales, J.J., 2018, Evidence of small ferrimagnetic concentrations in mice (Mus musculus) livers and kidneys exposed to the urban dust: a reconnaissance study: Geofísica Internacional, 57(1), 79-86. https://doi.org/10.22201/igeof.00167169p.2018.57.1.1824. Links
- Corona-Chávez, P, Uribe Salas, J.A., Razo Pérez, N., Martínez Medina, M., Maldonado Villanueva, R., Ramos Arroyo, YR., Robles Camacho, J., 2010, The impact of mining in the regional ecosystem: the Mining District of El Oro and Tlalpujahua, Mexico: De Re Metallica, 15, 21-34. Links
- Dearing, J.A., Dann, R.J.L., Hay, K., Lees, J.A., Loveland, P.J., Maher, B.A., O'Grady, K., 1996, Frequency-dependent susceptibility measurements of environmental materials: Geophysical Journal International, 124(1), 228-240. https://doi.org/10.1111/j.1365-246X.1996.tb06366.x. Links
- Dótor-Almazán, A., Armienta-Hernández, M.A., Talavera-Mendoza, O., Ruiz, J., 2017, Geochemical behavior of Cu and sulfur isotopes in the tropical mining region of Taxco, Guerrero (southern Mexico): Chemical Geology, 471, 1-12. https://doi.org/10.1016/j.chemgeo.2017.09.005. Links
- Ďurža, O., 1999, Heavy metals contamination and magnetic susceptibility in soils around metallurgical plant: Physics and Chemistry of the Earth, Part A: Solid Earth and Geodesy, 24(6), 541-543. https://doi.org/10.1016/S1464-1895(99)00069-1. Links
- Evans M.E, Heller F., 2003, Environmental magnetism - Principles and Applications of Enviromagnetics: San Diego, California, Academic Press, 299 p. Links
- Hernández-Bernal, M.S., Morales, J., Corona-Chávez, P., Gogichaishvili, A., Bautista, F., 2016, Combined rock-magnetic and geochemical characterization of Angangueo mining district, central Mexico: Environmental Earth Sciences, 75, 1287. https://doi.org/10.1007/s12665-016-6097-0. Links
- Kanu, M.O., Basavaiah, N., Meludu, O.C., Oniku, A.S., 2017, Investigating the potential of using environmental magnetism techniques as pollution proxy in urban road deposited sediment: International Journal of Environmental Science and Technology, 14, 2745-2758. https://doi.org/10.1007/s13762-017-1356-5. Links
- Maldonado, B., Rehren, T., 2009, Early copper smelting at Itziparátzico, Mexico: Journal of Archaeological Science, 36(9), 1998-2006. https://doi.org/10.1016/j.jas.2009.05.019. Links
- Matasova, G.G., Kazansky, A.Y., Bortnikova, S.B., Airijants, A.A., 2005, The use of magnetic methods in an environmental study of áreas polluted with non-magnetic wastes of the mining industry (Salair region, Western Siberia, Russia): Geochemistry: Exploration, Environment, Analysis, 5, 75-89. https://doi.org/10.1144/1467-7873/03-058. Links
- Méndez, M., Armienta, M., 2012, Distribución de Fe, Zn, Pb, Cu, Cd y As originada por residuos mineros y aguas residuales en un transecto del Río Taxco en Guerrero, México: Revista Mexicana de Ciencias Geológicas, 29(2), 450-462. Links
- Morales, J., Hernández-Bernal, M.S., Corona-Chávez, P., Gogichaishvili, A., Bautista, F., 2016, Further evidence for magnetic susceptibility as a proxy for the evaluation of heavy metals in mining wastes: case study of Tlalpujahua and El Oro Mining Districts: Environmental Earth Sciences , 75, 309, https://doi.org/10.1007/s12665-015-5187-8. Links
- Morales, J., Aguilera, A., Bautista, F., Cejudo, R., Goguitchaichvili, A., Hernández-Bernal, M.S., 2020, Heavy metal content estimation in the Mexico City Street dust: an inter-method comparison and Pb levels assessment during the last decade: SN Applied Sciences, 2, 1841. https://doi.org/10.1007/s42452-020-03647-5. Links
- Morales, J., Hernández Bernal, M.S., Pérez Rodríguez, N., Goguitchaichvili, A., 2023, Magnetic Susceptibility Prospecting and Geochemical Characterization of Taxco's Mining Waste Dam Guerrero I (Mexico): Quaternary, 6(3), 40. https://doi.org/10.3390/quat6030040. Links
- Pérez, I., Romero, F.M., Zamora, O., Gutiérrez-Ruiz, M.E., 2014, Magnetic susceptibility and electrical conductivity as a proxy for evaluating soil contaminated with arsenic, cadmium and lead in a metallurgical area in the San Luis Potosi State, Mexico: Environmental Earth Sciences , 72, 1521-1531. https://doi.org/10.1007/s12665-014-3057-4. Links
- Petrovsky, E., Kapicka, A., Zapletal, K., Sebestova, E., Spanila, T., Dekkers, M.J., Rochette, P., 1998, Correlation between magnetic parameters and chemical composition of lake sediments from Northern Bohemia- preliminary study: Physics and Chemistry of the Earth, 23(9-10), 1123-1126. https://doi.org/10.1016/S0079-1946(98)00139-6. Links
- Petrovsky, E., Kapicka, A., Jordanova, N., Boruvka, L., 2001, Magnetic properties of alluvial soils contaminated with lead, zinc and cadmium: Journal of Applied Geophysics, 48(2), 127-136. https://doi.org/10.1016/S0926-9851(01)00085-4. Links
- Pollard, H.P., 1987, The Political Economy of Prehispanic Tarascan Metallurgy: American Antiquity, 52(4), 741-752. https://doi.org/10.2307/281382. Links
- Ramos-Arroyo, Y.R., Prol-Ledesma, R.M., Siebe-Grabach, C., 2004, Características geológicas y mineralógicas e historia de extracción del Distrito de Guanajuato, México. Posibles escenarios geoquímicos para los residuos mineros: Revista Mexicana de Ciencias Geológicas , 21(2), 268-284. Links
- Shu, J., Dearing, J.A., Morse, A.P., Yu, L.Z., Yuan, N., 2001, Determining the sources of atmospheric particles in Shanghai, China, from magnetic and geochemical properties: Atmospheric Environment, 35(15), 2615-2625. https://doi.org/10.1016/S1352-2310(00)00454-4. Links
- Secretaría de Economía, 2024, Minería (en línea): México, Gobierno de México, disponible en < Secretaría de Economía, 2024, Minería (en línea): México, Gobierno de México, disponible en https://www.gob.mx/se/acciones-y-programas/mineria >, consultado 22 de febrero de 2024. Links
- Secretaría de Medio Ambiente y Recursos Naturales (SEMARNAT), 2007, Norma Oficial Mexicana que establece los criterios para determinar las concentraciones de remediación de suelos contaminados por arsénico, bario, berilio, cadmio, cromo hexavalente, mercurio, níquel, plata, plomo, selenio, talio y/o vanadio (NOM-147-SEMARNAT/SSA1-2004): México, D.F., Diario Oficial de la Federación, 2 de marzo de 2007, 62 p., disponible en < , disponible en https://www.gob.mx/profepa/documentos/norma-oficial-mexicana-nom-147-semarnat-ssa1-2004 >. Links
- Talavera Mendoza, O., Yta, M., Moreno Tovar, R., Dótor Almazán, A., Flores Mundo, N., Duarte Gutiérrez, C., 2005, Mineralogy and geochemistry of sulfide-bearing tailings from silver mines in the Taxco, Mexico area to evaluate their potential environmental impact: Geofísica Internacional , 44(1), 49-64. https://doi.org/10.22201/igeof.00167169p.2005.44.1.552. Links
- Talavera-Mendoza, O., Armienta, M., García, J., Flores, N., 2006, Geochemistry of leachates from the El Fraile I sulfide tailings piles in Taxco, Guerrero, southern Mexico: Environmental Geochemistry and Health, 28, 243-255. https://doi.org/10.1007/s10653-005-9037-6. Links
- Talavera-Mendoza, O., Ruiz, J., Díaz-Villaseñor, E., Ramírez-Guzmán, A., Cortés, A., Salgado-Souto, S.A., Dótor-Almazán, A., Rivera-Bustos, R., 2016, Water-rock-tailings interactions and sources of sulfur and metals in the subtropical mining region of Taxco, Guerrero (southern Mexico): a multi-isotopic approach: Applied Geochemistry, 66, 73-81. https://doi.org/10.1016/j.apgeochem.2015.12.002. Links
- Thompson, R., Battarbee, R., O'Sullivan, EE., Oldfield, F., 1975, Magnetic susceptibility of lake sediments. Limnology and Oceanography, 20(5), 687-698. Links
- Thompson, R., Stober, J.C., Turner, G.M., Oldfield, F., Bloemendal, J., Dearing, J.A., Rummery, T.A., 1980, Environmental Applications of Magnetic Measurements: Science 207(4430), 481-486. https://doi.org/10.1126/science.207.4430.481. Links
- Thompson, R., Oldfield, F., 1986, Environmental Magnetism: London: Allen & Unwin, 237 p. http://dx.doi.org/10.1007/978-94-011-8036-8. Links
- Vigliotti, L., Verosub, K.L., Cattaneo, A., Trincardi, F., Asioli, A., Piva, A., 2008, Palaeomagnetic and rock magnetic analysis of Holocene deposits from the Adriatic Sea: detecting and dating short-term fluctuations in sediment supply: The Holocene, 18(1), 141-152. http://dx.doi.org/10.1177/0959683607085605. Links