Special Section Monogenetic volcanism, environment and society
The 2020 and 2021 Seismic Swarms in the Tancítaro-Paricutín Area (Uruapan-Michoacán, México) Evidence Magma Intrusion in an Area with High Density of Monogenetic Cones
Caballero-Jiménez, Gema V.1
 http://orcid.org/0000-0001-9273-8771
Zarazúa-Carbajal, Ma. Cristina2
http://orcid.org/0000-0001-7438-5175
Mendoza-Rosas, Ana Teresa3
http://orcid.org/0000-0001-5925-4791
Cruz-Reyna, Servando De La4
http://orcid.org/0000-0003-1403-0318
http://orcid.org/0000-0001-9273-8771Zarazúa-Carbajal, Ma. Cristina2
http://orcid.org/0000-0001-7438-5175Mendoza-Rosas, Ana Teresa3
http://orcid.org/0000-0001-5925-4791Cruz-Reyna, Servando De La4
http://orcid.org/0000-0003-1403-0318
-
Publication dates-
May 23, 2025
Apr-Jun , 2024
- Article in PDF
- Article in XML
- Automatic translation
- Send this article by e-mail
- Share this article +
Abstract
The Michoacán-Guanajuato Volcanic Field (MGVF) in central-western Mexico, with more than 1,000 monogenetic volcanoes, has been well known since 1943 when an eruption formed the Paricutín volcano, 11 km to the NW of the summit of Tancítaro stratovolcano. In the highly fractured zone around Tancítaro, referred to as the Paricutín-Tancítaro region (PTR), two major seismic swarms have been recorded, the first between January 5 and February 22, 2020, and the second between May 30 and July 22, 2021. The Mexican National Seismological Service (SSN) reported a total of 4,956 earthquakes with coda magnitudes between 2.6 and 4.2. With the aim to determine the causes of the swarms and the potential hazard they may pose on the region, we first analyze their spatial distributions by relocating all of the events using the Double Difference method and testing different 1-D velocity models to select the one with the lowest residual errors. Secondly, we analyze the temporal distributions finding that their temporal occurrence fits a Mogi’s type 3 volcanic seismic swarm. We conclude that each swarm is due to stresses induced by dike-fed intrusions of moderate volumes of magma in a pre-existing temporal magma reservoir, probably a sill.
Key words::
Paricutín-Tancítaro, earthquake swarm, monogenetic volcano, distributed volcanism hazards, magma intrusion
1. Introduction
The Trans-Mexican Volcanic Belt (TMVB) is associated with the subduction of the Cocos and Rivera plates beneath the North American plate (Figure 1). Along TMVB, calderas, stratovol-canoes, and monogenetic fields characterize the landscape. The Michoacán-Guanajuato monogenetic field (MGVF) is located in the central-western portion of the TMVB and represents one of the world's largest fields covering an area of about 40,000 km2 and hosting more than 1,000 volcanic vents. MGVF includes 901 scoria cones, 43 domes, 13 young shield volcanoes with surmounting cones, 22 maars or tuff rings, and 61 lava flows with hidden vents (Hasenaka and Carmichael, 1985b).
-
Hasenaka and Carmichael, 1985The cinder cones of Michoacán-Guanajuato, Central México: their age, volume and distribution, and magma discharge rateJournal of Volcanology and Geothermal Research, 1985
Thumbnail
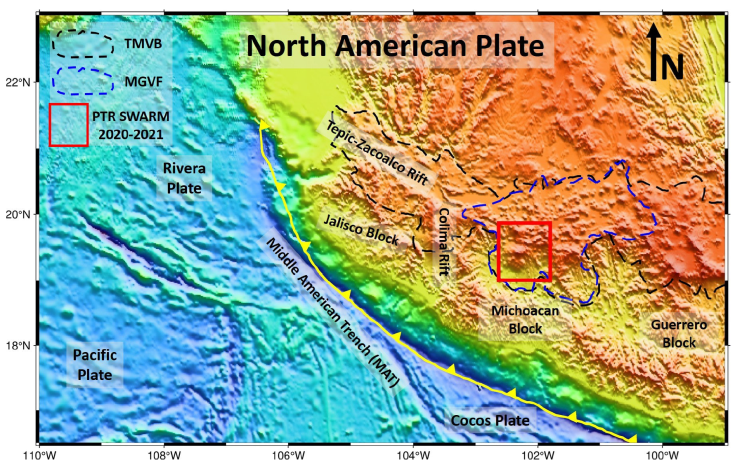
Figure 1
Tectonic map. MAT, Middle American Trench; TMVB, Trans-Mexican Volcanic Belt (black dashed line), MGVF Michoacán-Guanajuato volcanic field (blue dashed line).
Tectonic map. MAT, Middle American Trench; TMVB, Trans-Mexican Volcanic Belt (black dashed line), MGVF Michoacán-Guanajuato volcanic field (blue dashed line).
Two scoria cones were formed in recent times: Jorullo (1759-1774) and Paricutín (1943-1952) (Luhr and Simkin, 1993; Becerril et al., 2021). Eruptions from these cones caused significant economic damage, mostly by lava flows flooding arable lands and burying two villages (Alonso-Núñez and Marín-Tello, 2009; Rees, 1970). This type of scoria cone-forming eruptions tends to be long-lived, ejecting relatively large volumes of magma, at relatively low rates, for extended periods. For example, the Jorullo volcano eruption lasted fifteen years (Rasoazanamparany et al., 2016) ejecting about 1.25 km3 of magma (Yokoyama and De la Cruz-Reyna, 1990). Guilbaud et al. (2011) conclude that the Jorullo eruption is the latest of 26 monogenetic events that occurred during the past 1 Ma in a relatively small area (333 km2) of the southern part of the MGVF, producing ca. 10 km3 of dominantly andesitic magma. Similarly, 80 km NW of Jorullo, the Paricutín eruption ejected 1.3 km3 of magma (Yokoyama and De la Cruz-Reyna, 1990). In both cases the eruptions were preceded by felt local seismicity having the characteristics of seismic swarms, i.e. moderate magnitude (M<5) and frequent earthquakes usually not following Omori’s law (lack of a clear mainshock-aftershock behavior).
-
Luhr and Simkin, 1993Paricutin. The volcano born in a Mexican cornfield, 1993
-
Becerril et al., 2021The historical case of Paricutin volcano (Michoacán, México): challenges of simulating lava flows on a gentle slope during a long-lasting eruptionNatural Hazards, 2021
-
Alonso-Núñez and Marín-Tello, 2009Impacto social y económico de la erupción del volcán Jorullo, Michoacán, 1759Tzintzun, 2009
-
Rees, 1970Paricutin revisited: A review of man´s attempts to adapt to ecological changes resulting from volcanic catastropheGeoforum, 1970
-
Rasoazanamparany et al., 2016Temporal and compositional evolution of Jorullo volcano, Mexico: implications for magmatic processes associated with a monogenetic eruptionChemical Geology, 2016
-
Yokoyama and De la Cruz-Reyna, 1990Precursory eathquakes of the 1943 eruption of Paricutin volcano, Michoacan, MexicoJournal of Volcanology and Geothermal Research, 1990
-
Guilbaud et al. (2011)Geology, geochronology, and tectonic setting of the Jorullo Volcano region, Michoacán, MéxicoJournal of Volcanology and Geothermal Research, 2011
-
Yokoyama and De la Cruz-Reyna, 1990Precursory eathquakes of the 1943 eruption of Paricutin volcano, Michoacan, MexicoJournal of Volcanology and Geothermal Research, 1990
Seismic swarms may occur in different geological environments. They may be caused by tectonic processes, magma and/or fluid intrusions, or by karstic phenomena related to pore pressure variations. Hydrothermal activity and glacier instabilities may also produce a swarm-like seismicity. Several of these sources may lead to potentially hazardous outcomes of the source phenomena causing the seismicity. When a seismic swarm characterized by a significant increase in the occurrence rate of earthquakes develops in a region in which more than one of the above sources is present, a challenge is posed to identify its causes and possible consequences.
In the Paricutín area, a clear precedent is represented by the seismicity recorded 45 days before the volcano's birth, with some of the events reaching Ms 4.5 (Yokoyama and De la Cruz-Reyna, 1990). The Paricutín eruption began on 20 February 1943 and lasted for 9 years with lava flows flooding an area of about 25 km2. Then, after 54 years of relative quietness in the region, a seismic swarm was recorded in 1997 between Tancítaro, a large (3840 m a.s.l.) currently inactive Pleistocene stratovolcano, and Paricutín located 11 km NE of the Tancítaro summit. The 1997 swarm was characterized by 230 events with duration magnitude between 1.5 and 3.5, at depths between 10 and 18 km, with at least 5 events exceeding magnitude 3.9. At that time, that swarm was attributed to the regional tectonic seismicity related to the San Juanico-Buenavista Fault (Pacheco et al., 1999). Later, similar earthquake swarms were reported in 1999, 2000, and 2006, the latter with more than 730 events with duration magnitude between 2.4 and 3.7. Unlike the 1997 seismicity, these more recent swarms were associated with magma intrusions near Tancítaro (Pinzón et al., 2017) and, in particular, with the emplacement of a dike in the shallow crust, at a depth around 4-5 km, that extended as a sill-like short horizontal migration (Gardine et al. 2011). More recently, between 5 January 2020, and 22 July 2021, the largest seismic swarms ever recorded in the region producing a maximum Md of 4.2 (Figure 2) caused considerable concern in the authorities and population. Here, we discuss and interpret the causes and possible consequences of the swarms in light of their time evolution and detailed relocation of the events using different velocity models.
-
Yokoyama and De la Cruz-Reyna, 1990Precursory eathquakes of the 1943 eruption of Paricutin volcano, Michoacan, MexicoJournal of Volcanology and Geothermal Research, 1990
-
Pacheco et al., 1999Tectonic implication of the earthquake swarm of 1997 in the Michoacan Triangle, MexicoJournal of South American Earth Science, 1999
-
Pinzón et al., 2017Magma intrusion near Volcan Tancítaro: Evidence from seismic analysisPhysics of the Earth and Planetary Interiors, 2017
-
Gardine et al. 2011Dike emplacement near Paricutín volcano, México in 2006Bull. Volcanol, 2011
Thumbnail
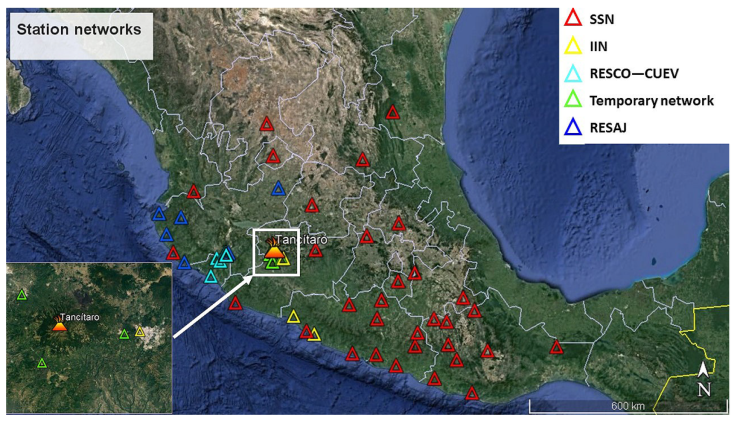
Figure 2
Stations used by SSN to locate the swarm earthquakes.
Stations used by SSN to locate the swarm earthquakes.
2. Geology and Tectonics of the Area
Carbon 14, K-Ar ages as well as geomorphic age estimates define a late Pliocene to Holocene age for the TMVB cinder cones (Hasenaka and Carmichael, 1985 a,b). The tectonics of the area is complex and some authors suggest that the crust in the southern part of the TMVB is divided into different blocks moving independently among them and with respect to the North American plate. Those movements are evidenced through complex systems of active faults (Luhr et al., 1985; Pacheco et al., 1999). Some relate to alignments of monogenetic cinder cones with a N35°E strike parallel to the direction of plate convergence, while other cones align approximately N60W, roughly parallel to the Middle America Trench (MAT) (Connor, 1987; Connor, 1990; Hasenaka and Carmichael, 1985b). Some small volcanoes (mostly cinder cones) show local alignments striking E-W in the northern part of the volcanic field, ENE-WSW in the middle part, and NE-SW in the south (Hasenaka and Carmichael, 1985a).
-
Hasenaka and Carmichael, 1985 aA compilation of location, size, and geomorphological parameters of volcanoes in the Michoacan-Guanajuato volcanic field, MexicoGeofísica Internacional, 1985
-
bThe cinder cones of Michoacán-Guanajuato, Central México: their age, volume and distribution, and magma discharge rateJournal of Volcanology and Geothermal Research, 1985
-
Luhr et al., 1985Active rifting in southwestern Mexico: Manifestations of an incipient eastward spreading-ridge jumpGeology, 1985
-
Pacheco et al., 1999Tectonic implication of the earthquake swarm of 1997 in the Michoacan Triangle, MexicoJournal of South American Earth Science, 1999
-
Connor, 1987Structure of the Michoacán-Guanajuato volcanic field, MexicoJournal of Volcanology and Geothermal Research, 1987
-
Connor, 1990Cinder cone clustering in the TransMexican Volcanic Belt: implications for structural and petrologic modelsJournal of Geophysical Research: Solid Earth, 1990
-
Hasenaka and Carmichael, 1985bThe cinder cones of Michoacán-Guanajuato, Central México: their age, volume and distribution, and magma discharge rateJournal of Volcanology and Geothermal Research, 1985
-
Hasenaka and Carmichael, 1985aA compilation of location, size, and geomorphological parameters of volcanoes in the Michoacan-Guanajuato volcanic field, MexicoGeofísica Internacional, 1985
Most volcanoes are located between 200 and 440 km from the MAT, with nearly 75% between 200 and 300 km and with the highest cone density at 250 km. Small volcanoes tend to form clusters, but the probably older medium-sized volcanoes, more abundant and degraded than the small ones in the northern part of the volcanic field, do not show clustering (Hasenaka et al., 1994). Small monogenetic volcanoes are located between medium-sized volcanic centers, either on their lower flanks or in the surrounding alluvial plains (Ban et al; 1992). The volcanism migrated southwards from the northern part of the MGVF around 1 Ma and in the last 40,000 yr, and the average magma output rate in the field has been about 0.8 km3/1,000 years (Hasenaka and Carmichael, 1985a; Hasenaka and Carmichael, 1985b).
-
Hasenaka et al., 1994Contrasting volcanism in the Michoacán-Guanajuato Volcanic Field, central Mexico: Shield volcanoes vs. cinder conesGeofísica Internacional, 1994
-
Ban et al; 1992K-Ar ages of lavas from shield volcanoes in the Michoacan-Guanajuato volcanic field, MexicoGeofísica Internacional, 1992
-
Hasenaka and Carmichael, 1985aA compilation of location, size, and geomorphological parameters of volcanoes in the Michoacan-Guanajuato volcanic field, MexicoGeofísica Internacional, 1985
-
Hasenaka and Carmichael, 1985bThe cinder cones of Michoacán-Guanajuato, Central México: their age, volume and distribution, and magma discharge rateJournal of Volcanology and Geothermal Research, 1985
In the notch between the limits of the North American plate and some of the crustal blocks, the Michoacán Triangle occurs. This is a region of normal faulting without a preferred orientation and with a predominance of small monogenetic volcanoes, and absence of large volcanoes. These features suggest a high degree of crustal fragmentation and extension (Johnson and Harrison, 1989; 1990). This region is limited by three large fault zones, the Chapala-Tula fault zone to the north, the San Juanico-Buenavista fault zone to the south, and the Guerrero block to the east. Adjacent to the central part of the San Juanico-Buenavista lies the Tancítaro stratovolcano, the abovementioned large (~100 km3) andesitic composite volcano. 40Ar/39Ar ages indicate that Tancítaro became active at ≥793±22 ka and that the most recent effusive activity occurred at 237± 34 ka (Ownby et al., 2007).
-
Johnson and Harrison, 1989Tectonic and volcanism in Central Mexico: a Landsat Thematic Mapper PerspectiveRemote Sens. Environ., 1989
-
1990Neotectonics in Central MexicoPhys. Earth and Planet. Int., 1990
Around Tancítaro and extending between 19° and 20° and -102.0° and -102.7° is the Paricutín-Tancítaro region (PTR), a complex, highly fractured and tectonically active region including part of the Michoacán Triangle hosting the highest volcanic vent concentration in MGVF.
3. The 2020-2021 seismic swarms in the Tancítaro-Paricutín Area.
Between 5 January 2020 and 5 November 2021, the National Seismological Service of Mexico (SSN) reported 4,956 earth-quakes with duration magnitude between 2.6 and 4.2 and depths between 2 and 63 km. These events occurred in a region located between 102°30’ W to 101°54’ W and 19°12’ N to 19°40’ N. Ninety-six percent of that seismicity was recorded in two main periods: From 5 January to 22 February 2020 and from 30 May to 22 July 2021. With maximum magnitude of Md 4.2, in each swarm. Hereafter, we shall refer to those seismic swarm episodes as the PTRS-1 and the PTRS-2, respectively.
To locate these earthquakes, the National Seismological Service used data from several stations of its national broadband seismometer network (SSN), from accelerometers of the UNAM Institute of Engineering network (IIN), from Jalisco Seismic and Accelerometric Network (RESAJ), and from stations of the Colima volcano seismic network (RESCO-CUEV) (Figure 2). More seismic stations were gradually added as they were temporarily positioned near the seismic zone. Therefore, not all of the events were located with the same number of stations, and the number of stations used for each location depended upon the magnitude of each event. We remark that the temporary stations operated by SSN and the Institute of Engineering (Temporary Network) only recorded events of the PTRS-1 swarm between February 8 and December 15, 2020. The SSN original hypocentral locations are displayed in Figure 3.
Thumbnail
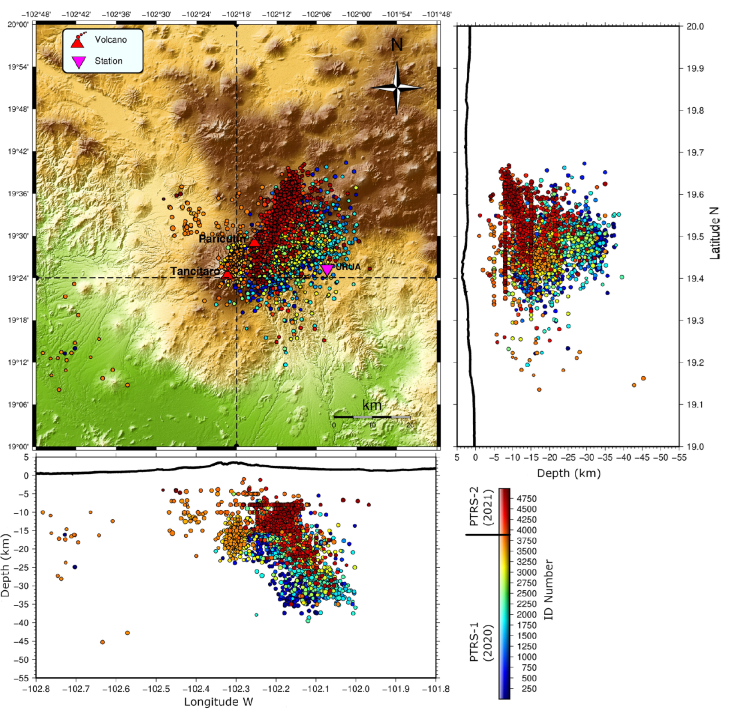
Figure 3
SSN hypocenter distribution of the PTR earthquake swarms recorded in 2020 and 2021.
SSN hypocenter distribution of the PTR earthquake swarms recorded in 2020 and 2021.
3.1 Relocated seismicity
From the catalog data, we have relocated the events with HypoDD (double-difference earthquake location algorithm; Waldhauser and Ellsworth, 2000), which minimizes the travel-time residuals between pairs of events recorded at common stations. The algorithm adjusts the difference of vectors between the hypocenters canceling the common errors, mainly those related to the crustal velocity structure in the earthquakes’ sites. When there is a dense distribution of seismicity and the distance between events is much smaller than the distance to seismic stations, hundreds or thousands of earthquakes can be linked through a chain of close neighbors and it is then possible to obtain higher-resolution hypocenter locations over longer distances (Waldhauser and Ellsworth, 2000).
-
Waldhauser and Ellsworth, 2000A double-difference earthquake location algorithm: method and application to the northern Hayward faultBull Seismol Soc Am, 2000
-
Waldhauser and Ellsworth, 2000A double-difference earthquake location algorithm: method and application to the northern Hayward faultBull Seismol Soc Am, 2000
-
Espíndola (2009) model. This 8-layer model was obtained by receiver functions using teleseismic recordings to determine the crustal characteristics and to obtain shear-wave velocity models under the recording stations to improve focal determinations.
-
Pacheco et al. (1999) model. This 6-layer model was adapted from Fuentes (1997), who determined an average crustal structure from a surface wave dispersion analysis. Pacheco et al. (1999) also included a 1.5 km thick, 2.5 km/s, low-velocity layer to model the pronounced arrivals of P and S waves and to account for the low-velocity of the volcanic deposits.
-
Gardine et al. (2011) model. The authors developed this 8-layer velocity model using travel time tomographic inversions generalized for all of western Mexico (Gardine 2010).
-
Espíndola (2009)Modelos de velocidad cortical en México, utilizando funciones de receptor en las estaciones de la red nacional de banda ancha, 2009
-
Pacheco et al. (1999)Tectonic implication of the earthquake swarm of 1997 in the Michoacan Triangle, MexicoJournal of South American Earth Science, 1999
-
Fuentes (1997)Determinación de la Estructura Cortical en el Sur de México Utilizando Dispersión de Ondas Superficiales, 1997
-
Pacheco et al. (1999)Tectonic implication of the earthquake swarm of 1997 in the Michoacan Triangle, MexicoJournal of South American Earth Science, 1999
-
Gardine et al. (2011)Dike emplacement near Paricutín volcano, México in 2006Bull. Volcanol, 2011
-
Gardine 2010Tracing the movement and storage of magma in the crust through seismology: examples from Alaska and western Mexico, 2010
Table 1
Tested velocity models. (From Pacheco et al., 1999, Gardine et al., 2011 and Espíndola, 2009).
Tested velocity models. (From Pacheco et al., 1999, Gardine et al., 2011 and Espíndola, 2009).
| Pacheco et al. | Espíndola | Gardine et al. | |||
|---|---|---|---|---|---|
| Depth | P velocity (km/s) | Depth | P velocity (km/s) | Depth | P velocity (km/s) |
| 1.5 | 2.5 | 0 | 3.34 | 0 | 5.26 |
| 3 | 5 | 2 | 5.82 | 3 | 5.56 |
| 6 | 5.5 | 4 | 6.7 | 6 | 5.87 |
| 13 | 5.7 | 9 | 6.73 | 9 | 6.07 |
| 37 | 6.3 | 15 | 7 | 12 | 6.41 |
| ∞ | 7.4 | 21 | 7.61 | 15 | 6.71 |
| 33 | 8 | 18 | 7.01 | ||
| 400 | 8.5 | 30 | 7.41 | ||
-
Pacheco et al., 1999Tectonic implication of the earthquake swarm of 1997 in the Michoacan Triangle, MexicoJournal of South American Earth Science, 1999
-
Gardine et al., 2011Dike emplacement near Paricutín volcano, México in 2006Bull. Volcanol, 2011
-
Espíndola, 2009Modelos de velocidad cortical en México, utilizando funciones de receptor en las estaciones de la red nacional de banda ancha, 2009
Thumbnail
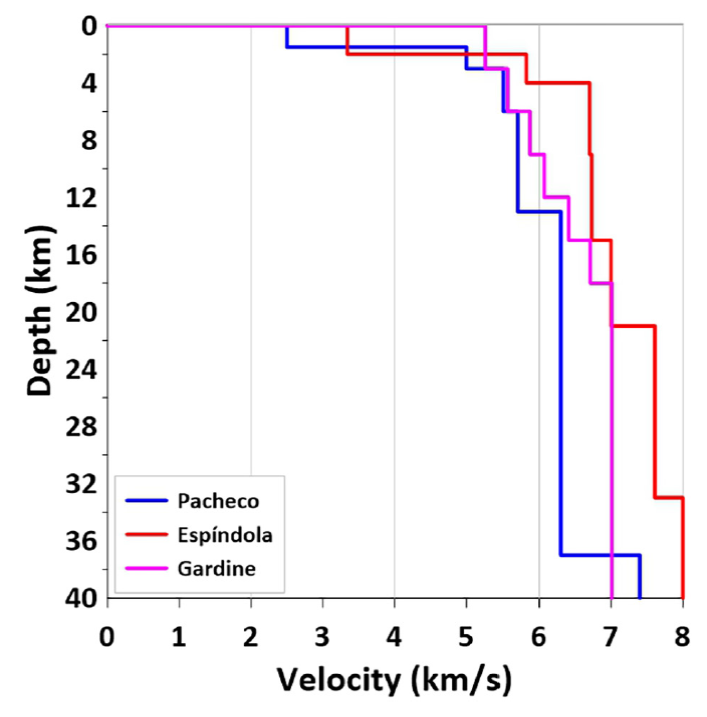
Figure 4
Tested velocity models.
Tested velocity models.
The models have Vp/Vs ratios of 1.78 for Espíndola (2009) and Pacheco et al. (1999), and 1.76 for Gardine et al. (2011).
-
Espíndola (2009)Modelos de velocidad cortical en México, utilizando funciones de receptor en las estaciones de la red nacional de banda ancha, 2009
-
Pacheco et al. (1999)Tectonic implication of the earthquake swarm of 1997 in the Michoacan Triangle, MexicoJournal of South American Earth Science, 1999
-
Gardine et al. (2011)Dike emplacement near Paricutín volcano, México in 2006Bull. Volcanol, 2011
To select the most proper model, ten events with magnitudes 4.1 or higher were manually located, nine of these occurred during the 2020 PTRS-1 swarm and one was recorded during the 2021 PTRS-2 swarm. Once the 10 events were located the errors associated with their respective locations were compared with the errors provided by SSN (Figure 5). Based on the manual relocation results for the selected ten largest events, the velocity model with the lowest location errors was that of Gardine et al. (2011).
-
Gardine et al. (2011)Dike emplacement near Paricutín volcano, México in 2006Bull. Volcanol, 2011
Thumbnail
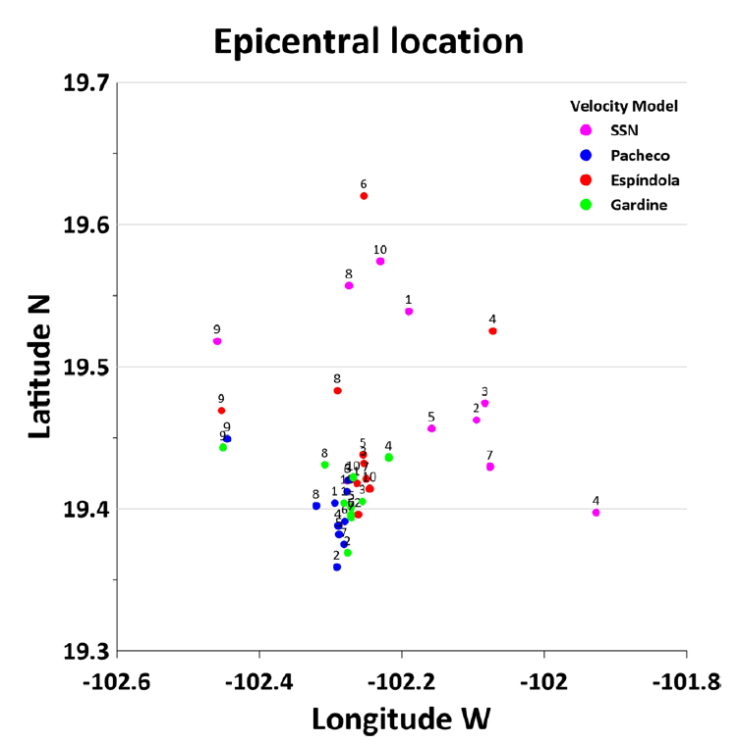
Figure 5
Epicentral localizations using different velocity models.
Epicentral localizations using different velocity models.
To explore whether the location errors could be further reduced to improve the hypocentral locations, small velocity variations were tested on the upper two layers of the Gardine et al. (2011) model. The variations were made by decreasing each velocity by 0.5 km/s, first individually, and then in pairs looking for the lowest errors and more constrained locations with respect to the previous locations made for this analysis. The best results, yielding slightly lower errors and less dispersed locations, have been obtained by adjusting only the first layer of the Gardine et al. (2011) model to 3.26 km/s (Figure 6), which will be referred as “Gardine-mod” model hereafter (Figure 7). Also in Figure 7 the RC velocity model used by Legrand et al. (2023) is graphed.
-
Gardine et al. (2011)Dike emplacement near Paricutín volcano, México in 2006Bull. Volcanol, 2011
-
Legrand et al. (2023)Repeated seismic swarms near Paricutin volcano: precursors to the birth of a new monogenetic volcano in the Michoacán-Guanajuato volcanic field, México?Bulletin of Volcanology, 2023
Thumbnail
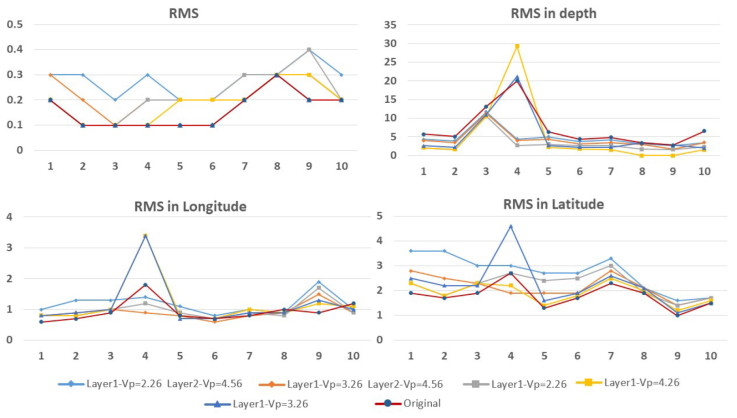
Figure 6
Errors associated with locations using different velocity variations and combinations.
Errors associated with locations using different velocity variations and combinations.
Thumbnail
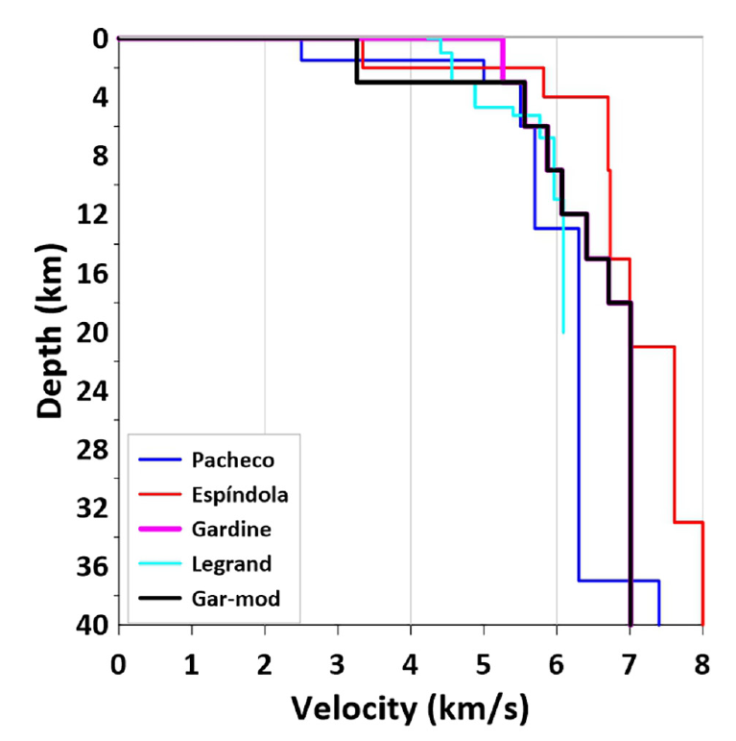
Figure 7
Tested velocity models and Gardine-mod model used in the swarm earthquakes relocation with HypoDD.
Tested velocity models and Gardine-mod model used in the swarm earthquakes relocation with HypoDD.
Of the 4,956 swarm earthquakes, 4,310 were relocated.
4. Time evolution of the Swarm Seismicity
For the 2020 PTRS-1 swarm, SSN located a total of 3,688 earthquakes between January 5 and February 22 with a mean occurrence rate of approximately 68 events/day. The seismicity began with a relatively low rate since only 18 events were recorded during the first 18 days, but as time passed, the rate increased and the number of events gradually increased reaching a peak of 265 localized events on February 4. After that day, the seismicity progressively decreased returning to the background values (Figure 8).
Thumbnail
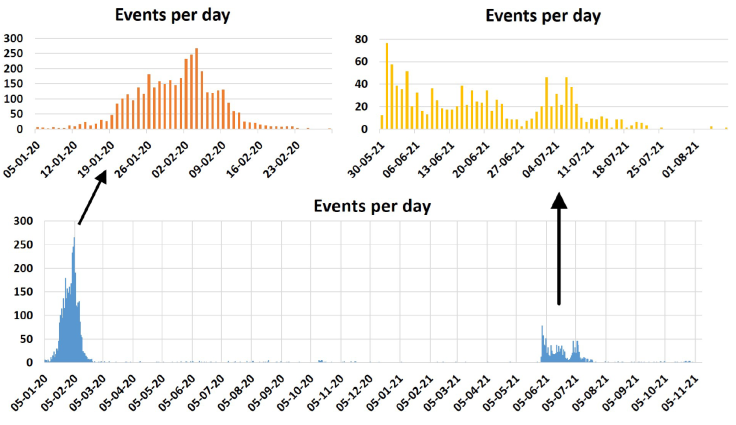
Figure 8
Number of events per day of swarms recorded in 2020 and 2021.
Number of events per day of swarms recorded in 2020 and 2021.
For the PTRS-2 swarm occurred between May 30 and July 22, 2021, SSN located 1,114 earthquakes. The rate of occurrence of these events was lower than that of the PTRS-1 swarm (Figure 8) with 181 events between May 30 and June 3 and peaking on May 31 with 76 earthquakes.
The frequency plots illustrated in Figure 8 hint that the PTRS-1 swarm shows a very characteristic bell-shaped type 3 Mogi earthquake sequence pattern (Mogi 1963a,b). This pattern is distinctive of highly fractured regions under concentrated stress such as magma intrusions. The PTRS-2 swarm is less clear with some mixed characteristics of the Mogi’s type 2 and 3 and with a peak near the swarm onset followed by a slow, irregular decay, a feature more frequently observed in fractured regions under more distributed stresses (Mogi 1963a,b).
-
Mogi 1963aSome discussions on aftershocks, foreshocks and earthquake swarms-the fracture of a semi-finite body caused by an inner stress origin and its relation to the earthquake phenomenaBull. Earthq. Res. Inst., 1963
-
bExperimental study on the mechanism of the earthquake occurrences of volcanic originBulletin of Volcanology, 1963
-
Mogi 1963aSome discussions on aftershocks, foreshocks and earthquake swarms-the fracture of a semi-finite body caused by an inner stress origin and its relation to the earthquake phenomenaBull. Earthq. Res. Inst., 1963
-
bExperimental study on the mechanism of the earthquake occurrences of volcanic originBulletin of Volcanology, 1963
5. Analysis of the Hypocenter Distribution
Using the Gardine-mod 1-D velocity model (Figure 7), we relocated 3230 and 1010 earthquakes from the PTRS-1 and PTRS-2 swarms, respectively. In PTRS-1, the epicenters were distributed towards the east-northeast of Tancítaro and Paricutín, over an approximate extension of 30 × 40 km, and the hypocenters are vertically distributed around a plane dipping at approximately 45 ° to the NE, in the depth range 5 to 35 km below sea level (Figure 9a).
Thumbnail
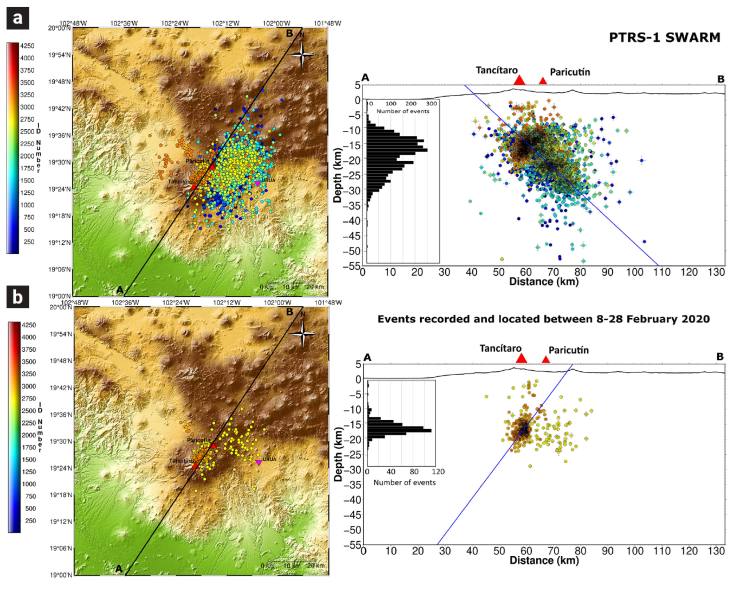
Figure 9
Hypocenter distributions: a) of the PTRS-1 swarm, b) of selected events recorded between February 8 and 28, 2020. Sections along the profile AB.
Hypocenter distributions: a) of the PTRS-1 swarm, b) of selected events recorded between February 8 and 28, 2020. Sections along the profile AB.
Starting on 8 February 2020, the earthquakes appear to migrate toward Tancítaro and concentrate below the Stratovolcano for the duration of the swarm. However, that date coincides with the day three temporary seismic stations began operating within 20 km from the Tancítaro volcano. Figure 10a-d shows how new stations were incorporated between 8 February and December 2020, reducing the average distance to the Tancítaro volcano and causing a slight increase in the number of stations used to localize the events. This hints that the apparent migration may be an artifact resulting from a higher location precision caused by the addition of nearer stations (Figure 10e-g). We relocated the events, removing data from the nearby stations to verify if there was a significant apparent migration of events caused by the additional stations. The addition of nearby stations reduced the dispersion of the events, especially on the latitude. Consequently, the distance between the swarm epicentral center and its borders was reduced by a factor of ca. 0.12. Furthermore, this concentration of events coincides with the locations reported by Legrand et al. (2023) and Perton et al. (2024) using an independent temporary network. This coincidence supports the belief that a significant spatial migration of the swarms towards the SW did not take place, at least not during February, when the most intense swarm activity was detected. The epicentral locations (from 8 February) extend over an area of about 50 km2, and in the vertical profile, concentrate under the Tancítaro at depths between 9 and 20 km (Figure 9b, orange hypocenters).
-
Legrand et al. (2023)Repeated seismic swarms near Paricutin volcano: precursors to the birth of a new monogenetic volcano in the Michoacán-Guanajuato volcanic field, México?Bulletin of Volcanology, 2023
-
Perton et al. (2024)Magma migration below Tancítaro and Paricutin volcanoes revealed by seismologyGeophysical Journal International, 2024
Thumbnail
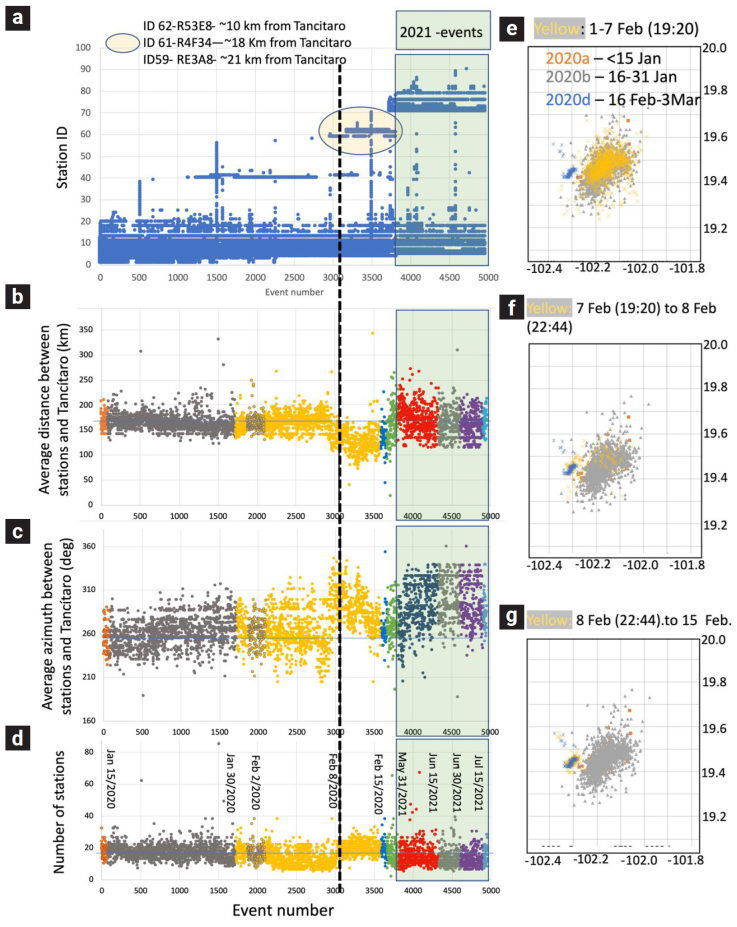
Figure 10
Event apparent migration resulting from changes in the number and distribution of seismic stations used for locations. In a) to d), seismic events are identified by a number according to occurrence order. Event 3056, the first event registered on 8 February 2020, is marked by a dotted line, and events that occurred in 2021 are highlighted and encompassed with a green area. a) Displays the ID of active seismic stations during each seismic event. b) Displays the average distance between all active seismic stations and the Tancitaro volcano during each seismic event. c) Displays the average azimuth of the location of seismic stations with respect to Tancítaro volcano. d) Displays the number of active stations during each seismic event. e)-g) Illustrate the effect of the introduction of nearby stations on February 8, 2020, on the location of the seismic events by comparing the locations around that day to those obtained before February 1 (gray and orange) and after February 16 (blue). e) Location of events before February 7, 2020 (yellow). f) Location of events on February 7, 2020, between 19:20 and 22:40 (yellow). g) Location of events between February 8 and February 15, 2020 (yellow).
Event apparent migration resulting from changes in the number and distribution of seismic stations used for locations. In a) to d), seismic events are identified by a number according to occurrence order. Event 3056, the first event registered on 8 February 2020, is marked by a dotted line, and events that occurred in 2021 are highlighted and encompassed with a green area. a) Displays the ID of active seismic stations during each seismic event. b) Displays the average distance between all active seismic stations and the Tancitaro volcano during each seismic event. c) Displays the average azimuth of the location of seismic stations with respect to Tancítaro volcano. d) Displays the number of active stations during each seismic event. e)-g) Illustrate the effect of the introduction of nearby stations on February 8, 2020, on the location of the seismic events by comparing the locations around that day to those obtained before February 1 (gray and orange) and after February 16 (blue). e) Location of events before February 7, 2020 (yellow). f) Location of events on February 7, 2020, between 19:20 and 22:40 (yellow). g) Location of events between February 8 and February 15, 2020 (yellow).
The first earthquakes of the PTRS-2 swarm were located below Tancítaro, further developing with an NE trend towards and beyond Paricutín with the hypocenters distributed in two main depth ranges: between 5 and 19 km and between 19 and 32 km (Figure 11). Most events (66%) concentrate in the shal-lower depth range and appear to migrate low angle fault plane towards the NE. We attribute the dispersion of the epicenters to the lack of nearby stations for localization (Figure 10b). By contrast, the apparent migration towards the Paricutín may be caused by the larger number of stations located at the NW of Tancítaro volcano (Figure 10c).
Thumbnail
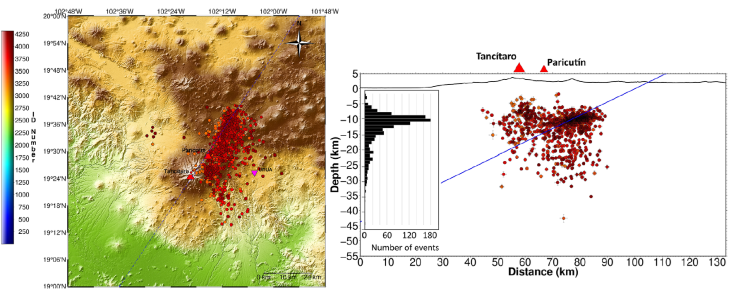
Figure 11
Location of the events that occurred during the PTRS-2 swarm, recorded in 2021.
Location of the events that occurred during the PTRS-2 swarm, recorded in 2021.
6. Discussion
The Gardine-mod velocity model and the hypocenter location analysis based on the number and distance to temporary seismometers allow us to obtain well-constrained locations. In particular, the events recorded when three stations within 20 km of Tancítaro volcano were operating (February-December 2020) conveyed results supporting the conclusions of Legrand et al. (2023) about a constrained extent of the first swarm seismicity, evidencing the location of a magma intrusion under the NE flank of Tancítaro, similar to previous cases reported between 1999 and 2006.
-
Legrand et al. (2023)Repeated seismic swarms near Paricutin volcano: precursors to the birth of a new monogenetic volcano in the Michoacán-Guanajuato volcanic field, México?Bulletin of Volcanology, 2023
Here, we provide additional evidence supporting the magmatic origin of the concentrated stress source causing the swarm through the analysis of the temporal evolution of the swarm earthquakes since, as mentioned above, both PTRS-1 and PTRS-2 comply with the empirical criteria of Mogi (1963a,b). Aside from the roughly bell-shaped histograms of the earthquake counts as a function of time in Figure 8, these are: the total number of events in each swarm should exceed 10, and n m /√t > 2, this is the maximum daily number of earthquakes n m divided by the square root of the duration t of the swarm (in days) exceeding a value of 2. They are 30 and 9.5 for PTRS-1 and PTRS-2, respectively, and the number of events exceeds 10 by two orders of magnitude).
-
Mogi (1963aSome discussions on aftershocks, foreshocks and earthquake swarms-the fracture of a semi-finite body caused by an inner stress origin and its relation to the earthquake phenomenaBull. Earthq. Res. Inst., 1963
-
b)Experimental study on the mechanism of the earthquake occurrences of volcanic originBulletin of Volcanology, 1963
Therefore, assuming that the swarms are caused by magma intrusion-induced stresses in a highly heterogenous medium, and using the magnitudes reported by the SSN for the swarm events, we estimated the intruded volumes using the relationship between cumulative seismic moment and intruded volume of White and McCausland (2016, 2019), and estimate the cumulative seismic moment from the body-wave magnitudes m b with the best-fit relationship of Das et al. (2019),
-
White and McCausland (2016Volcano-tectonic earthquakes: A new tool for estimating intrusive volumes and forecasting eruptionsJournal of Volcanology and Geothermal Research, 2016
-
2019)A process-based model of pre-eruption seismicity patterns and its use for eruption forecasting at dormant stratovolcanoesJournal of Volcanology and Geothermal Research, 2019
-
Das et al. (2019)A seismic moment magnitude scaleBulletin of the Seismological Society of America, 2019
e1
log
M
0
=
1.36
m
b
+
10.24
(1)
We obtained about 96×106m3 of magma for PTRS-1 (calculated cumulative seismic moment of 5.45×10¹⁸Nw-m of 3230 earthquakes recorded between 5 January and 28 February 2020) and about 45×106m3 for PTRS-2 (cumulative seismic moment of 1.85×10¹⁸Nw-m for the earthquakes of the second swarm recorded between 30 May and 22 July 2021). These results are independent of the location of the hypocenters.
The adequacy of volume estimation from cumulative seismic moment relies on the diffusive behavior of the induced seismicity. Indeed, the spatio-temporal evolution of the PTRS-1 epicenters (Figure 12a) shows a diffusive behavior, as described by Eq. 8 from Shapiro et al. (1998), which relates the distance r from the intrusion to an event that occurred at time t as
-
Shapiro et al. (1998)Estimating the permeability from fluid-injection induced seismic emissionPoromechanics, 1998
-
Shapiro et al. (1998)Estimating the permeability from fluid-injection induced seismic emissionPoromechanics, 1998
Thumbnail
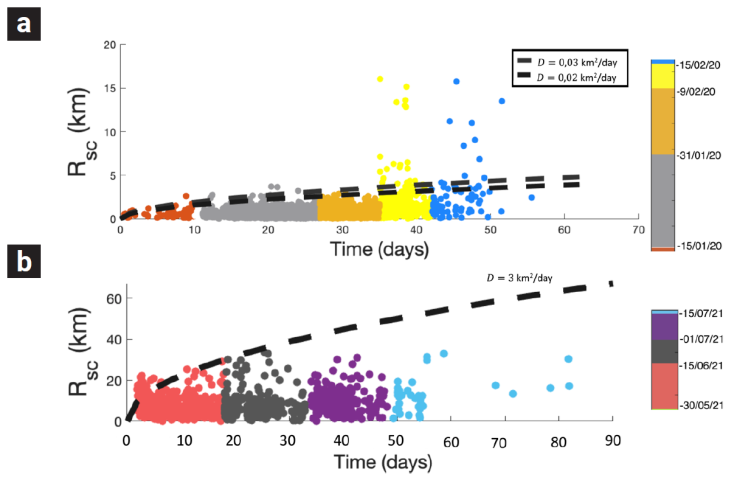
Figure 12
Distance from epicenters to the center of the swarm as a function of time. a) Events from PTRS-1. Radial distance from events before 9 February (when closer stations were added) have been corrected by a factor of 0.12, as described in section 5. b) Events from PTRS-2. Dotted lines are plots of the equation r = 4 π D t (Shapiro et al. 1998) for different diffusivity values.
Distance from epicenters to the center of the swarm as a function of time. a) Events from PTRS-1. Radial distance from events before 9 February (when closer stations were added) have been corrected by a factor of 0.12, as described in section 5. b) Events from PTRS-2. Dotted lines are plots of the equation r = 4 π D t (Shapiro et al. 1998) for different diffusivity values.
The use of the White and McCausland relationship in this case may be questioned since it was obtained primarily with data from “distal” (within 30 km from the volcano) earthquakes preceding eruptions in dormant polygenetic volcanoes. Not-withstanding, we consider that it is also applicable to seismic activity caused by new magma intruding into brittle crust or in pre-existing dikes or sills filled with cooling magma from previous intrusions. In fact, the relationship was in part formulated from deformation and cumulative seismic moment observations made during experimental water injections in deep holes (McGarr, 2014), confirming that it may be applied to any similar configuration.
-
McGarr, 2014Maximum magnitude earthquakes induced by fluid injectionJ. Geophys. Res. Solid Earth, 2014
When the swarm seismicity precedes the eruption of polygenetic volcanoes, the volumes of magma intrusions calculated with the cumulative seismic moment-volume relationship are much smaller than the erupted volumes (White and McCausland, 2016). This also seems to be valid when eruptions open new vents. To test this, we estimated the cumulative seismic moment of the seismic swarm preceding the 2021 eruption of Tajogaite on La Palma (Canary Islands, Spain), which opened a volcanic vent complex on the western flank of the Cumbre Vieja rift, an N-S extended volcanic ridge, producing extensive lava flows and building scoria cones (Martí et al., 2022). Using the public data of the IGN (Instituto Geográfico Nacional de España, Catálogo de terremotos, https://doi.org/10.7419/162.03.2022), we calculated the volume of the magma intrusion using the cumulative seismic moments of the events locally recorded between 17 June 2021 and 19 September 2021 (the eruption day), obtaining an intruded magma volume of 2.6×10⁶m3 , which is of the same order as the estimation of Suarez et al., (2023) of 4.6×10⁶ m3 and as the 5.62×10⁶m3 estimated from pre-eruptive DInsar analysis of the pre-eruptive ground deformations (De Luca et al., 2022), but significantly less than the erupted volume ~2x10⁸m3 (Dayton et al., 2023). As del Fresno et al. (2023) discussed, in the case of La Palma monogenetic basaltic volcanism, the pre-eruptive seismic activity only reflects the final and shallow intrusion. However, most magma erupted from a deeper source (25-40 km). Thus, the volume intruded during the pre-eruptive activity is a minor part of the real amount of magma under the volcanic area. Then, the seismicity-inferred volume of a magmatic intrusion may be used as a lower threshold of the total intruded volume. In the case of our approximation for La Palma-2021 eruption, it was lower by a factor of two.
-
White and McCausland, 2016Volcano-tectonic earthquakes: A new tool for estimating intrusive volumes and forecasting eruptionsJournal of Volcanology and Geothermal Research, 2016
-
Martí et al., 2022How long-term hazard assessment may help to anticipate volcanic eruptions: The case of La Palma eruption 2021 (Canary Islands)Journal of Volcanology and Geothermal Research, 2022
-
Suarez et al., (2023)Unveiling the pre-eruptive seismic series of the La Palma 2021 eruption: Insights through a fully automated analysisJournal of Volcanology and Geothermal Research, 2023
-
De Luca et al., 2022Pre- and co-eruptive analysis of the September 2021 eruption at Cumbre Vieja volcano (La Palma, Canary Islands) through DInSAR measurements and analytical modelingGeophysical Research Letters, 2022
-
Dayton et al., 2023Deep magma storage during the 2021 La Palma eruptionScience advances, 2023
-
Fresno et al. (2023)Magmatic plumbing and dynamic evolution of the 2021 La Palma eruptionNature Communications, 2023
On the other hand, we obtained the strain release by Eq. 20 from De la Cruz-Reyna and Reyes-Dávila (2001) to describe the behavior of the PTRS-1 and PTRS-2 swarms. We divided the PTRS-1 into periods A and B. Period A corresponds to the events registered between January 5 and February 8, 2020 (Fig 13a). Period B corresponds to the events recorded in the period February 9 - 23, 2020 (Fig 13b). For period A of PTRS-1 and PTRS-2, we calculated the cumulative strain release of the epicenters every 2.5 km. For period B of PTRS-1, we calculated the cumulative strain values every 1 km because the epicenter distribution is constricted by the closer stations.
-
De la Cruz-Reyna and Reyes-Dávila (2001)A model to describe precursory material-failure phenomena: applications to short-term forecasting at Colima volcano, MexicoBull. Volcanol, 2001
Thumbnail
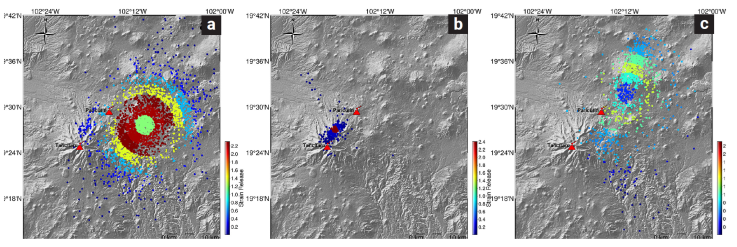
Figure 13
Strain release for PTRS-1 and PTRS-2. a) strain release between January 5, 2020 to February 8, 2020. b) strain release between February 9 - 23, 2020, and c) strain release during PTRS-2.
Strain release for PTRS-1 and PTRS-2. a) strain release between January 5, 2020 to February 8, 2020. b) strain release between February 9 - 23, 2020, and c) strain release during PTRS-2.
We interpret all of the above arguments as a piece of evidence that, in most cases, the swarm-causing magma-intrusion-induced stresses extend over sizable areas when the intrusion reaches a pre-existing magma reservoir, namely a large magma chamber in the case of polygenetic volcanoes, or a temporary elongated reservoir like a dike or a sill in the case of monogenetic eruptions. Even intrusions significantly smaller than the stored magma may generate pressure fluctuations that can activate fractures around any type of reservoir. This is consistent with the model of Albert et al. (2016) based on the felt seismicity of historic monogenetic eruptions and magma petrological analysis of eruptions in the Canary Islands (Albert et al., 2015). They propose a magma ascent model in different stages: 1. Ascent of small magma batches intruding into the crust, accumulating at depths between 5 to 10 km and forming a temporal magma reservoir. This process can develop over years or months before an eruption. 2. The accumulated magma may mix, degas and crystallize. 3. When a new magma batch intrudes into the pre-existing temporary reservoir, mixing with the older magma can modify its rheology and density, allowing it to ascend and erupt. This last process is usually faster, developing over a timescale of days to weeks. This model entails the notion that for monogenetic eruptions to occur, a series of seismic swarms or ‘failed eruptions’ (De la Cruz-Reyna and Yokoyama, 2011) may arise before magma can reach the surface (Albert et al., 2016).
-
Albert et al. (2016)Years to weeks of seismic unrest and magmatic intrusions precede monogenetic eruptionsGeology, 2016
-
Albert et al., 2015Timing of magmatic processes and unrest associated with mafic historical monogenetic eruptions in Tenerife IslandJournal of Petrology, 2015
-
De la Cruz-Reyna and Yokoyama, 2011A geophysical characterization of monogenetic volcanismGeofísica Internacional, 2011
-
Albert et al., 2016Years to weeks of seismic unrest and magmatic intrusions precede monogenetic eruptionsGeology, 2016
In summary, our modified velocity model Gardine-mod permitted reducing the event location errors, helping to improve the delimitation of the swarm hypocentral region and to set more reliable boundaries on the region where the magmatic intrusion occurred. Secondly, the variation in the location of hypocenters of the PTRS-1 as a function of the distance of seismometers to the location of the hypocenters strongly supports what is stated by Legrand et al. (2023), that the primary source of error generally stems from the velocity model plus the number and spatial distribution of the seismometers. As a consequence, the events between 8 February and 15 December 2020 are more accurately located, when three stations placed within 20 km of Tancítaro volcano were operating.
-
Legrand et al. (2023)Repeated seismic swarms near Paricutin volcano: precursors to the birth of a new monogenetic volcano in the Michoacán-Guanajuato volcanic field, México?Bulletin of Volcanology, 2023
In particular, hypocentral locations obtained for events recorded between 8 and 28 February 2020 overlap those reported by Legrand et al. (2023) for the swarms that occurred on 2 February 2020, confirming that most of the seismic swarm concentrated in the region at -102.29 E, 19.43 W, and at depths between 9 and 20 km below sea level, and that the neighboring seismicity was distributed in an elliptical shaped volume with the semi-major and semi-minor axis of approx. 5 km (~0.05 deg) and 3 km (~0.03 deg), respectively, and about 10 km thick.
-
Legrand et al. (2023)Repeated seismic swarms near Paricutin volcano: precursors to the birth of a new monogenetic volcano in the Michoacán-Guanajuato volcanic field, México?Bulletin of Volcanology, 2023
Most of the PTRS-2 is distributed over an area to the NNE of the PTRS-1 towards the Paricutín volcano. However, this also may be an effect of the incorporation of seismic stations in the N and NW of Tancítaro volcano in January 2021. It is thus highly probable that the PTRS-2 was also located at, or very near, the location of the previous swarm.
7. Conclusions
We conclude that the PTRS-1 and PTRS-2 were probably caused by new magma intrusions of about 96 million cubic meters in 2020 and about 45 million cubic meters in 2021 into a pre-existing temporal magma reservoir at a depth below about 9 km, according to the model by Perton et al. (2024), and seemingly not yet large enough to trigger an eruption. The magma was probably fed through a dike or a system of spatially closed dikes and ascended until it encountered a horizontally extended older, cooled magma body, probably a sill that we speculate may be related to the system that fed the Paricutín eruption. The fresh magma injections pressurized the older magma deposit and nearby aquifers, and when the pressure pulses efficiently propagated through those fluid or viscoelastic media intersected tectonically pre-stressed faults, induced the seismicity (White and McCausland, 2016) . The proportion between the pre-existent tectonic stress and the magma pressure-induced stresses probably controls the shape of the number of shocks per day histogram with a predominance of pressure-induced stresses in 2020 and an increased influence of more distributed tectonic stresses in 2021.
-
Perton et al. (2024)Magma migration below Tancítaro and Paricutin volcanoes revealed by seismologyGeophysical Journal International, 2024
-
White and McCausland, 2016Volcano-tectonic earthquakes: A new tool for estimating intrusive volumes and forecasting eruptionsJournal of Volcanology and Geothermal Research, 2016
It is not possible to predict the size and time of a possible future magma intrusion and whether it may trigger an eruption, forming a new monogenetic volcano. The experience in polygenetic volcanoes, and more recently, the case of La Palma volcano, shows that the volume of magma intrusion triggering an eruption is a small fraction of the erupted magma. Therefore, even a moderate (in number and magnitude) earthquake swarm could represent a significant volcanic hazard for the region, with an added seismic hazard component for the case of swarms increasing in intensity with time. This calls for the densification of the volcanic monitoring infrastructure in the region, including more permanent telemetric seismic stations and continuous geodetic and geochemical studies. Early detection and diagnosis of developing seismicity would provide decision-makers with sufficient decision factors and time to develop efficient preventive actions.
8. Acknowledgments
The authors would like to express their gratitude to the National Seismological Service (SSN México) for providing the seismic data. The authors are indebted to the Editors and to both reviewers whose comments greatly helped to improve this contribution.
9. References
- Albert, H., Costa, F., and Marti, J. (2015). Timing of magmatic processes and unrest associated with mafic historical monogenetic eruptions in Tenerife Island. Journal of Petrology, v. 56, p. 1945-1966. doi: https://doi.org/10.1093/petrology/egv058 Links
- Albert, H., Costa, F., and Marti, J. (2016). Years to weeks of seismic unrest and magmatic intrusions precede monogenetic eruptions. Geology, v. 44; no. 3, p. 211-214. doi: https://doi.org/10.1130/G37239.1 Links
- Alonso-Núñez, M.C., Marín-Tello, M.I. (2009). Impacto social y económico de la erupción del volcán Jorullo, Michoacán, 1759. Tzintzun, 49: 53-78. Links
- Ban, M., Hasenaka, T., Delgado-Granados, H., and Takaoka, N. (1992). K-Ar ages of lavas from shield volcanoes in the Michoacan-Guanajuato volcanic field, Mexico. Geofísica Internacional, 31(4), 467-473. doi: https://doi.org/10.22201/igeof.00167169p.1992.31.4.1367 Links
- Becerril, L., Larrea, P., Salinas, S., Mossoux, S., Ferrés, D., Widom, E., Siebe, C., Martí, J. (2021). The historical case of Paricutin volcano (Michoacán, México): challenges of simulating lava flows on a gentle slope during a long-lasting eruption. Natural Hazards 107, pp. 809-829. Links
- Connor, C. B. (1987). Structure of the Michoacán-Guanajuato volcanic field, Mexico. Journal of Volcanology and Geothermal Research, 33(1-3), 191-200. doi: https://doi.org/10.1016/0377-0273(87)90061-8 Links
- Connor, C. B. (1990). Cinder cone clustering in the TransMexican Volcanic Belt: implications for structural and petrologic models. Journal of Geophysical Research: Solid Earth, 95(B12), 19395-19405. Links
- Das, R., Sharma, M. L., Wason, H. R., Choudhury, D., & Gonzalez, G. (2019). A seismic moment magnitude scale. Bulletin of the Seismological Society of America, 109(4), 1542-1555. Doi: https://doi.org/10.1785/0120180338 Links
- Dayton, K., Gazel, E., Wieser, P., Troll, V. R., Carracedo, J. C., La Madrid, H., ... and Pérez-Torrado, F. J. (2023). Deep magma storage during the 2021 La Palma eruption. Science advances, 9(6), eade7641. Links
- Del Fresno, C., Cesca, S., Klügel, A., Domínguez Cerdeña, I., Díaz-Suárez, E.A., Dahm, T., García-Cañada, L., Meletlidis, S., Milkereit, C., Valenzuela-Malebrán, C. and López-Díaz, R. (2023). Magmatic plumbing and dynamic evolution of the 2021 La Palma eruption. Nature Communications, 14(1), p.358. Links
- De la Cruz-Reyna, S., and Reyes-Dávila, G. (2001). A model to describe precursory material-failure phenomena: applications to short-term forecasting at Colima volcano, Mexico. Bull. Volcanol, 63:297-308. doi: https://doi.org/10.1007/s004450100152 Links
- De la Cruz-Reyna, S., and Yokoyama, I. (2011). A geophysical characterization of monogenetic volcanism. Geofísica Internacional, 50(4), 465-484. doi: https://doi.org/10.22201/igeof.00167169p.2011.50.4.157 Links
- De Luca, C., Valerio, E., Giudicepietro, F., Macedonio, G., Casu, F., & Lanari, R. (2022). Pre- and co-eruptive analysis of the September 2021 eruption at Cumbre Vieja volcano (La Palma, Canary Islands) through DInSAR measurements and analytical modeling. Geophysical Research Letters, 49, e2021GL097293. Links
- Espíndola, V. H. (2009). Modelos de velocidad cortical en México, utilizando funciones de receptor en las estaciones de la red nacional de banda ancha. Tesis de Doctorado (Ph.D. tesis) UNAM. Links
- Fuentes, C. (1997). Determinación de la Estructura Cortical en el Sur de México Utilizando Dispersión de Ondas Superficiales. Tesis de Maestría (MSc tesis), UNAM, México D.F. Links
- Gardine, M. (2010). Tracing the movement and storage of magma in the crust through seismology: examples from Alaska and western Mexico. Dissertation, University of Alaska Fairbanks. Links
- Gardine, M., West, M. E., Cox, T. (2011). Dike emplacement near Paricutín volcano, México in 2006. Bull. Volcanol, 73:123-132. Links
- Guilbaud, M. N., Siebe, C., Layer, P., Salinas, S., Castro-Govea, R., Garduño-Monroy, V. H., and Le Corvec, N. (2011). Geology, geochronology, and tectonic setting of the Jorullo Volcano region, Michoacán, México. Journal of Volcanology and Geothermal Research, 201(1-4), 97-112. Doi: https://doi.org/10.1016/j.jvolgeores.2010.09.005 Links
- Hasenaka, T., Carmichael, I. (1985a). A compilation of location, size, and geomorphological parameters of volcanoes in the Michoacan-Guanajuato volcanic field, Mexico. Geofísica Internacional, 24, pp. 577-608. doi: https://doi.org/10.22201/igeof.00167169p.1985.24.4.2179 Links
- Hasenaka, T., Carmichael, I. (1985b). The cinder cones of Michoacán-Guanajuato, Central México: their age, volume and distribution, and magma discharge rate. Journal of Volcanology and Geothermal Research, 25: 105-124. https://doi.org/10.1016/0377-0273(85)90007-1 Links
- Hasenaka, T., Ban, M., and Delgado Granados, H. (1994). Contrasting volcanism in the Michoacán-Guanajuato Volcanic Field, central Mexico: Shield volcanoes vs. cinder cones. Geofísica Internacional, 33(1), 125-138. doi: https://doi.org/10.22201/igeof.00167169p.1994.33.1.544 Links
- Johnson, C.A., Harrison, C.G.A. (1989). Tectonic and volcanism in Central Mexico: a Landsat Thematic Mapper Perspective. Remote Sens. Environ. 28, 273-286. doi: https://doi.org/10.1016/0034-4257(89)90119-3 Links
- Johnson, C.A., Harrison, C.G.A. (1990). Neotectonics in Central Mexico. Phys. Earth and Planet. Int. 64, 187-210. doi: https://doi.org/10.1016/0031-9201(90)90037-X Links
- Legrand, D., Perton, M., Macías, J. L., Siebe, C., Pacheco, J., Chacón, F., Lermo, J., Quintanar, L., Cisneros, G. (2023). Repeated seismic swarms near Paricutin volcano: precursors to the birth of a new monogenetic volcano in the Michoacán-Guanajuato volcanic field, México?. Bulletin of Volcanology, 85(5), 30. doi: https://doi.org/10.1007/s00445-023-01645-0 Links
- Luhr, J., Nelson, F., Allan, J., Carmichael, I. (1985). Active rifting in southwestern Mexico: Manifestations of an incipient eastward spreading-ridge jump. Geology, 1985; 13 (1): 54-57. doi: https://doi.org/10.1130/0091-7613(1985)13<54:ARISMM>2.0.CO;2 Links
- Luhr J., Simkin T. (1993). Paricutin. The volcano born in a Mexican cornfield. Geoscience Press & the Smithsonian Institution, Phoenix, Arizona. 427 pp. Links
- Martí, J., Becerril, L., and Rodríguez, A. (2022). How long-term hazard assessment may help to anticipate volcanic eruptions: The case of La Palma eruption 2021 (Canary Islands). Journal of Volcanology and Geothermal Research, 431, 107669. doi: https://doi.org/10.1016/j.jvolgeores.2022.107669 Links
- McGarr, A. (2014). Maximum magnitude earthquakes induced by fluid injection. J. Geophys. Res. Solid Earth 119 (2), 1008-1019. Links
- Mogi, K. (1963a). Some discussions on aftershocks, foreshocks and earthquake swarms-the fracture of a semi-finite body caused by an inner stress origin and its relation to the earthquake phenomena. Bull. Earthq. Res. Inst., 41, 615-658. Links
- Mogi, K. (1963b). Experimental study on the mechanism of the earthquake occurrences of volcanic origin. Bulletin of Volcanology, 26, 197-208.v Links
- Pacheco, J. F., Valdés-González, C., Delgado, H., Singh, S. k., Zuñiga, R. F., Mortera-Gutiérrez, C. A., Santoyo, M. A., Domínguez, J., Barrón, R. (1999). Tectonic implication of the earthquake swarm of 1997 in the Michoacan Triangle, Mexico. Journal of South American Earth Science, 12, 567-577. doi: https://doi.org/10.1016/S0895-9811(99)00040-1 Links
- Perton, M., Legrand, D., Macías, J. L., Cisneros, G., Yañez-Sandoval, R. (2024). Magma migration below Tancítaro and Paricutin volcanoes revealed by seismology. Geophysical Journal International, 236(3), 1699-1715. doi: https://doi.org/10.1093/gji/ggae015 Links
- Pinzón, J.I., Núñez-Cornú, F.J., Rowe, C.A. (2017). Magma intrusion near Volcan Tancítaro: Evidence from seismic analysis. Physics of the Earth and Planetary Interiors, 262, 66-79. https://doi.org/10.1016/j.pepi.2016.11.004 Links
- Rasoazanamparany, C., Widom, E., Siebe, C., Guilbaud, M. N., Spicuzza, M. J., Valley, J. W., ... & Salinas, S. (2016). Temporal and compositional evolution of Jorullo volcano, Mexico: implications for magmatic processes associated with a monogenetic eruption. Chemical Geology, 434, 62-80. doi: https://doi.org/10.1016/j.chemgeo.2016.04.004 Links
- Rees, J. D. (1970). Paricutin revisited: A review of man´s attempts to adapt to ecological changes resulting from volcanic catastrophe. Geoforum, 1(4), 7-25. doi: https://doi.org/10.1016/0016-7185(70)90055-2 Links
- Shapiro, Sergei A., J.J. Royer, and Pascal Audigane. (1998). Estimating the permeability from fluid-injection induced seismic emission. Poromechanics. CRC Press, 301-305. Links
- Suarez, E.D., Domínguez-Cerdeña, I., Villaseñor, A., Aparicio, S.S.M., del Fresno, C. and García-Cañada, L. (2023). Unveiling the pre-eruptive seismic series of the La Palma 2021 eruption: Insights through a fully automated analysis. Journal of Volcanology and Geothermal Research, 444, p.107946. doi: https://doi.org/10.1016/j.jvolgeores.2023.107946 Links
- Waldhauser, F., Ellsworth, W. (2000). A double-difference earthquake location algorithm: method and application to the northern Hayward fault. Bull Seismol Soc Am 90, 1353-1368. Doi: https://doi.org/10.1785/0120000006 Links
- White, R., McCausland, W. (2016). Volcano-tectonic earthquakes: A new tool for estimating intrusive volumes and forecasting eruptions. Journal of Volcanology and Geothermal Research, 309. pp. 139-155. doi: https://doi.org/10.1016/j.jvolgeores.2015.10.020 Links
- White, R. A., and McCausland, W. A. (2019). A process-based model of pre-eruption seismicity patterns and its use for eruption forecasting at dormant stratovolcanoes. Journal of Volcanology and Geothermal Research, 382, 267-297. doi: https://doi.org/10.1016/j.jvol-geores.2019.03.004 Links
- Yokoyama, I., De la Cruz-Reyna, S. (1990). Precursory eathquakes of the 1943 eruption of Paricutin volcano, Michoacan, Mexico. Journal of Volcanology and Geothermal Research, 44, 265-281. doi: https://doi.org/10.1016/0377-0273(90)90021-7 Links
Data references
- Instituto Geográfico Nacional de España (2023). Catálogo de terremotos. España: Centro Nacional de Información Geográfica. https://www.ign.es/web/sis-catalogo-terremotos Links
- Universidad de Colima (2022). Red Sísmica Telemétrica del Estado de Colima perteneciente al Centro Universitario de Estudios Vulcanológicos. México: Universidad de Colima. https://portal.ucol.mx/cueiv/infraestructura.htm Links
- Universidad Nacional Autónoma de México (2023). Servicio Sismológico Nacional, México: UNAM, Instituto de Geofísica, SSN. URL: http://www.ssn.unam.mx Links
- Universidad Nacional Autónoma de México (2023). URAII-UNAM: La red acelerográfica del Instituto de Ingeniería. México: UNAM, Instituto de Ingeniería. https://aplicaciones.iingen.unam.mx/AcelerogramasRSM/RedAcelerografica.aspx Links