Articles
Flood hazard assessment using AHP in Corum, Turkey
Ozturk, Derya1
 http://orcid.org/0000-0002-0684-3127
Yilmaz, Ilknur2
http://orcid.org/0000-0002-7425-5052
Kirbas, Ufuk3
http://orcid.org/0000-0002-2389-425X
http://orcid.org/0000-0002-0684-3127Yilmaz, Ilknur2
http://orcid.org/0000-0002-7425-5052Kirbas, Ufuk3
http://orcid.org/0000-0002-2389-425X
-
Publication dates-
June 26, 2025
Mar-Apr , 2021
- Article in PDF
- Article in XML
- Automatic translation
- Send this article by e-mail
- Share this article +
Abstract
In this study, the flood hazard of Corum province, Turkey, was investigated using the Analytic Hierarchy Process (AHP), which is one of the most popular Multi-criteria Decision Analysis (MCDA) methods, based on Geographic Information System (GIS). As a result of the AHP process, Corum province was categorized into five flood hazard classes: very high, high, medium, low, and very low. It was determined that 3 % of the total area is under a very high flood hazard, and 25 % is considered a high flood hazard. To assess the validity of the flood hazard map, the results were compared with the historical flood inventory. Our hazard map was compatible with the historical flood inventory, and our hazard map can now be used to estimate the areas that are threatened by possible floods. When the existing structural measures are overlapped with the hazard map in Corum, it is understood that a large part of the structural measures carried out to date have focused on the areas of very high and high flood hazard in the flood hazard map. Future structural measures and detailed studies should now address other areas identified as under threat in the flood hazard map. Our results suggest that the hazard assessment based on MCDA is suitable for flood hazard mapping.
Keywords::
Flood, hazard map, analytic hierarchy process, multi-criteria decision analysis, geographic information system, Corum
Introduction
Floods are natural, regular phenomena, and they occur when water flow exceeds the capacity of the stream cross-section as a result of excessive rain and/or snowmelt (Murck & Skinner, 2016; Loucks & Van Beek, 2017). In addition to climatic effects, other factors that make a region susceptible to flood include the topographic structure, soil and ground condition, land-use policies, and drainage network (Zevenbergen et al., 2010; Jha, Bloch, & Lamond, 2012).
-
Murck & Skinner, 2016Visualizing geology, 2016
-
Loucks & Van Beek, 2017Water resource systems planning and management: An introduction to methods, models, and applications, 2017
-
Zevenbergen et al., 2010Urban flood management, 2010
-
Jha, Bloch, & Lamond, 2012Cities and flooding a guide to integrated urban flood risk management for the 21st century, 2012
The increase of urbanization along rivers and floodplains, land-use change, invasive industrialization, and climate change have been identified as key factors that alter the hydrological balance and to increase flood hazard (Zhu, Lund, Jenkins, Marques, & Ritzema, 2007; Huong & Pathirana, 2013; Kundzewicz & Stoffel, 2016).
-
Zhu, Lund, Jenkins, Marques, & Ritzema, 2007Climate change, urbanization, and optimal long-term floodplain protectionWater Resources Research, 2007
-
Huong & Pathirana, 2013Urbanization and climate change impacts on future urban flooding in Can Tho city, VietnamHydrology and Earth System Sciences, 2013
-
Kundzewicz & Stoffel, 2016Anatomy of flood riskFlood risk in the Upper Vistula Basin, 2016
There are many non-structural and structural measures that can be applied to help prevent or reduce floods, but first, flood hazard maps should be produced (Price & Vojinovic, 2008; Jonkman, Gerritsen, & Marchand, 2012). All prevention and mitigation measures should be designed on the basis of this information (Zevenbergen et al., 2010). Flood hazard maps are classically presented by mapping the boundaries of historic floods that have been experienced before, and these areas are considered to be areas of potential flood hazard in the future (National Research Council, 1996; Babister, McLuckie, Retallick, Askew, & Toniato, 2016). This approach has been successful in terms of presenting the current situation inventory, but it is not sufficient to make forecasts for the future through only the current inventory (United Nations, 1976; National Research Council, 1983; Babister et al., 2016). An alternative approach is flood hazard prediction based on hydraulic and hydrological models. Hydraulic and hydrological models are mainly based on determining the level of water depending on the geometry and hydrologic/hydrological conditions of the stream channel, and the highest flow determined according to certain flood return periods (Moel & Aerts, 2008; Mai & De-Smedt, 2017). Hydraulic and hydrological models require large-scale, and high-resolution data, such as length-section and cross-section of the stream to obtain channel geometry (Simonovic, 2013; Ezz, 2018; Khalfallah & Saidi, 2018), and to obtain these data is generally time-consuming and costly (Stefanidis & Stathis, 2013). Also, the possible flood magnitude over a certain time period cannot be fully predicted, and therefore, the problem contains significant uncertainties. Due to the complex nature of the flood occurrence, potential floods need to be addressed not only according to previous flood and meteorological data, but also based on numerous evaluation criteria based on knowledge, expert opinions, views, foresight, and experiences (De-Brito & Evers, 2016).
-
Price & Vojinovic, 2008Urban flood disaster managementUrban Water Journal, 2008
-
Jonkman, Gerritsen, & Marchand, 2012Coastal stormHandbook of hazards and disaster risk reduction and management, 2012
-
Zevenbergen et al., 2010Urban flood management, 2010
-
National Research Council, 1996Alluvial fan flooding, 1996
-
Babister, McLuckie, Retallick, Askew, & Toniato, 2016Spatially defining flood riskRiver flow 2016, 2016
-
United Nations, 1976Guidelines for flood loss prevention and management in developing countries, 1976
-
National Research Council, 1983Improving the flood insurance study process, 1983
-
Babister et al., 2016Spatially defining flood riskRiver flow 2016, 2016
-
Moel & Aerts, 2008Flood risk mapping in Europe: A comparative evaluation of methods, availability and applications, 2008
-
Mai & De-Smedt, 2017A combined hydrological and hydraulic model for flood prediction in Vietnam applied to the Huong river basin as a test case studyWater, 2017
-
Simonovic, 2013Floods in a changing climate: Risk management, 2013
-
Ezz, 2018Integrating GIS and HEC-RAS to model Assiut plateau runoffThe Egyptian Journal of Remote Sensing and Space Science, 2018
-
Khalfallah & Saidi, 2018Spatiotemporal floodplain mapping and prediction using HEC-RAS-GIS tools: Case of the Mejerda river, TunisiaJournal of African Earth Sciences, 2018
-
Stefanidis & Stathis, 2013Assessment of flood hazard based on natural and anthropogenic factors using analytic hierarchy process (AHP)Natural Hazards, 2013
-
De-Brito & Evers, 2016Multi-criteria decision-making for flood risk management: A survey of the current state of the artNatural Hazards and Earth System Sciences, 2016
In recent years, flood hazard mapping studies based on Multi-criteria Decision Analysis (MCDA) are being increasingly used (Papaioannou, Vasiliades, & Loukas, 2015; De-Brito & Evers, 2016; Sakieh, 2017; Xiao, Yi, & Tang, 2017). In particular, the development of software that can be integrated with Geographical Information Systems (GIS) and/or the adaptation of the MCDA methods to GIS software, allows the spatial analyzes based on MCDA to be done rapidly. In this context, several MCDA methods have been integrated with GIS (Linkov & Moberg, 2011; Malczewski & Rinner, 2015; Zhu, 2016), such as the Simple Weighted Sum Method, Weighted Product Method, Analytic Hierarchy Process (AHP), Value/Utility Function Approach, TOPSIS, ELECTRE, and PROMETHEE (Malczewski, 1999a; Bao, Ruan, Shen, Hermans, & Janssens, 2012; Malczewski & Rinner 2015). Of these methods, AHP is one of the most widely used methods in the literature and has a common application area in flood studies (Sinha, Bapalu, Singh, & Rath, 2008; Fernandez & Lutz, 2010; Stefanidis & Stathis, 2013; Siddayao, Valdez, & Fernandez, 2014; Ouma & Tateishi, 2014; Nivolianitou, Synodinou, & Manca, 2015; Papaioannou et al., 2015; Lyu, Sun, Shen, & Arulrajah, 2018). AHP is based on the principle of carrying out a decision analysis using multiple factors, such as in other MCDA methods. However, unlike other methods, all factors are compared with each other to perform a pairwise comparison, and the consistency ratio (CR) is used to control the consistency of these pairwise comparison judgments (Saaty, 1980; Malczewski, 1999b).
-
Papaioannou, Vasiliades, & Loukas, 2015Multi-criteria analysis framework for potential flood prone areas mappingWater resources management, 2015
-
De-Brito & Evers, 2016Multi-criteria decision-making for flood risk management: A survey of the current state of the artNatural Hazards and Earth System Sciences, 2016
-
Sakieh, 2017Understanding the effect of spatial patterns on the vulnerability of urban areas to floodingInternational Journal of Disaster Risk Reduction, 2017
-
Xiao, Yi, & Tang, 2017Integrated flood hazard assessment based on spatial ordered weighted averaging method considering spatial heterogeneity of risk preferenceScience of the Total Environment, 2017
-
Linkov & Moberg, 2011Multi-criteria decision analysis: Environmental applications and case studies, 2011
-
Malczewski & Rinner, 2015Multicriteria decision analysis in geographic information science, 2015
-
Zhu, 2016GIS for environmental applications: A practical approach, 2016
-
Malczewski, 1999aSpatial multicriteria decision analysisDecision making and analysis: A geographic information sciences approach, 1999
-
Bao, Ruan, Shen, Hermans, & Janssens, 2012TOPSIS and its extensions: Applications for road safety performance evaluationComputational intelligence systems in industrial engineering: With recent theory and applications, 2012
-
Malczewski & Rinner 2015Multicriteria decision analysis in geographic information science, 2015
-
Sinha, Bapalu, Singh, & Rath, 2008Flood risk analysis in the Kosi river basin, north Bihar using multi-parametric approach of Analytical Hierarchy Process (AHP)Journal of the Indian Society of Remote Sensing, 2008
-
Fernandez & Lutz, 2010Urban flood hazard zoning in Tucumán Province, Argentina, using GIS and multicriteria decision analysisEngineering Geology, 2010
-
Stefanidis & Stathis, 2013Assessment of flood hazard based on natural and anthropogenic factors using analytic hierarchy process (AHP)Natural Hazards, 2013
-
Siddayao, Valdez, & Fernandez, 2014Analytic hierarchy process (AHP) in spatial modeling for floodplain risk assessmentInternational Journal of Machine Learning and Computing, 2014
-
Ouma & Tateishi, 2014Urban flood vulnerability and risk mapping using integrated multi-parametric AHP and GIS: Methodological overview and case study assessmentWater, 2014
-
Nivolianitou, Synodinou, & Manca, 2015Flood disaster management with the use of AHPInternational Journal of Multicriteria Decision Making, 2015
-
Papaioannou et al., 2015Multi-criteria analysis framework for potential flood prone areas mappingWater resources management, 2015
-
Lyu, Sun, Shen, & Arulrajah, 2018Flood risk assessment in metro systems of mega-cities using a GIS-based modeling approachScience of the Total Environment, 2018
-
Saaty, 1980The analytic hierarchy process, 1980
-
Malczewski, 1999bGIS and multicriteria decision analysis, 1999
Corum (Turkey) is a province with many rivers and has experienced important floods in the past. The flood hazard of Corum has been addressed by several scientific studies in recent years. Erdede and Öztürk (2016) determined the flood potential using morphometric indices derived from the Digital Elevation Model (DEM). Yüce and Ercan (2015), and Ercan, Yagci, Yilmaz, Yuce and Unsal (2019) did not focus directly on determining the flood hazard, but modeled the rainfall-runoff relationship, which is related to flood hazard. Kaya and Akdemir (2019) pointed out the urban morphology and residential sites where flood hazard is high. These studies do not examine the entire Corum, do not evaluate multiple factors contributing to flood occurrence, and do not produce a flood hazard map.
-
Erdede and Öztürk (2016)Evaluation of flood potential of Kizilirmak Basin using linear, areal and relief morphometric indices (Kızılırmak havzasının taşkın potansiyelinin çizgisel, alansal ve rölyef morfometrik indisler kullanılarak değerlendirilmesi), 2016
-
Yüce and Ercan (2015)Determination of rainfall-runoff relationship in Kızılırmak Basin (Kızılırmak havzası yağış-akış ilişkisinin belirlenmesi), 2015
-
Ercan, Yagci, Yilmaz, Yuce and Unsal (2019)Annual runoff modelling of Kizilirmak Basin by artificial intelligent techniquesFresenius Environmental Bulletin, 2019
-
Kaya and Akdemir (2019)Urban morphology of Corum (Çorum kent morfolojisi), 2019
Here we describe the flood hazard situation in Corum by preparing a flood hazard map using AHP and investigate the compatibility of existing flood protection measures with hazardous locations. The first stage of the study involved the creation of a flood hazard map and proving the effectiveness of the AHP method in flood hazard mapping by comparing the hazard map with the historical flood inventory. The second step of the study is based on the examination of the existing structural measures (upstream measures and downstream measures-shore protection structures) in hazardous areas.
Study area: Corum
Corum is located in the inner part of the Central Black Sea Region in Turkey (Figure 1). Corum, consisting of 14 districts, covers an area of 12 820 km² and the average elevation from the sea level is 801 m. Generally, the summers are hot and dry, and the winters are cold and rainy (Corum Governorship, 2017). The spring is short, and the autumn is long. The hottest months are July and August, and the coldest months are January and February. The annual average temperature is 10.8 °C, and the annual total precipitation is 432.2 mm (during the period from 1929 to 2019) (Turkish General Directorate of Meteorology, 2020). According to the data of the Turkish Statistical Institute, in 2019, the total population of Corum was almost half a million inhabitants (Turkish Statistical Institute, 2020).
-
Corum Governorship, 2017Environmental status report of Corum province for 2016 (Çorum ili 2016 yılı çevre durum raporu), 2017
-
Turkish General Directorate of Meteorology, 2020Official statistics (Resmi istatistikler), 2020
-
Turkish Statistical Institute, 2020Statistical indicators (İstatistik göstergeler), 2020
Thumbnail
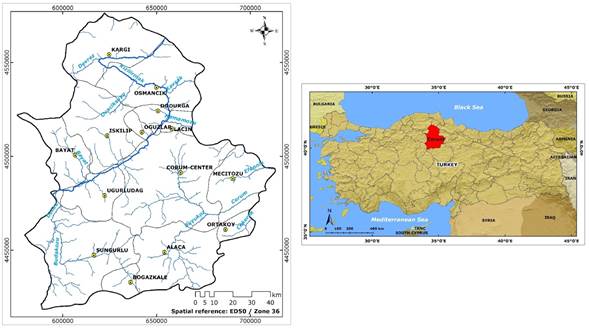
Figure 1
Study area: Corum, Turkey.
Study area: Corum, Turkey.
Corum province has an area of 8 500 km2 in the Kizilirmak Basin, and the other part is in the Yesilirmak Basin (Corum Governorship, 2017). The main streams of Corum province are Kizilirmak, Delice, Devrez, Ovaciksuyu, Bayat, Kavsak, Hamamozu, Budakozu, Corum, Buyukoz, Efennik, and Cekerek (Kaygın & Güven, 2013). Many floods have been experienced to date due to the fact that many streams are located in Corum, and many settlements have been built around these stream beds. Corum is expected to flood again in the future.
-
Corum Governorship, 2017Environmental status report of Corum province for 2016 (Çorum ili 2016 yılı çevre durum raporu), 2017
-
Kaygın & Güven, 2013SWOT analysis for Corum province (Çorum ili SWOT analizi), 2013
Despite the fact that there were many floods in Corum, only very limited data on the historical flood inventory could be obtained. This is because only the floods that caused very serious damage were recorded in the reports. Unfortunately, it has been observed that very few of the floods experienced are spatially represented by coordinates. The reports generally describe the floodplains as the general region description only (without coordinates, not as spatial data) and do not give a value regarding the magnitude of the flood. However, considering the amount of damage caused by floods from the reports, it was understood that floods were more frequent and caused more damage in Corum-Center, Sungurlu, and Osmancik compared to other districts (Turkish General Directorate of State Hydraulic Works, 1998; Turkish General Directorate of State Hydraulic Works, 2017).
-
Turkish General Directorate of State Hydraulic Works, 1998Flood yearbook of Turkey's river basins (Türkiye akarsu havzaları taşkın yıllığı), 1998
-
Turkish General Directorate of State Hydraulic Works, 2017Official archive, 2017
Data and methods
AHP was used in the determination of the flood hazard of Corum. AHP, developed by Saaty in the 1980s for complex decision problems, is based on the evaluations of multi-criteria and a problem is modeled in a hierarchical system at the level of main target, criteria, sub-criteria and options in this method (Saaty, 1980; Malczewski, 1999b). In AHP, weights are determined by pairwise comparison. In addition, according to the nature of the decision problem, pairwise comparisons can be used to obtain the relative importance values of options for a criterion. By using the criterion weights and the option values for each criterion (the importance of the options relative to each other), the AHP analysis value for each option is calculated as in Equation (1) (Saaty & Vargas, 2012):
-
Saaty, 1980The analytic hierarchy process, 1980
-
Malczewski, 1999bGIS and multicriteria decision analysis, 1999
-
Saaty & Vargas, 2012Models, methods, concepts & applications of the analytic hierarchy process, 2012
e1
A
A
H
P
=
∑
j
n
a
i
j
w
j
(1)
Where aij is the value of option i for criterion j (relative importance to other options), and wj is the weight of criterion j determined by pairwise comparison. The important point is that the weights of the criteria should be normalized to be the sum of 1, and that the criteria layers (pixels or vectors ―polygons, lines, points- with options) should have standardized values in the same value range (Malczewski, 1999b).
-
Malczewski, 1999bGIS and multicriteria decision analysis, 1999
In the first step of the study, the factors causing the flood were determined, and the decision hierarchy was established, then the weights of criteria and the sub-categories/grouped options were calculated using pairwise comparisons. For criteria with numerical values that have linearly increasing or decreasing significance levels, pairwise comparison was not required. To obtain the standard criteria layers required for all the criteria to be processed together, normalization was performed for all the criteria.
The flood hazard map obtained as a result of the AHP decision analysis, covering Corum with all districts, was separated into five levels of hazard and the locations of the existing structural measures of flood control were overlapped with this map to examine whether there are structural measures in the areas where flood hazard is important. The workflow showing the main steps of the study is shown in Figure 2.
Thumbnail
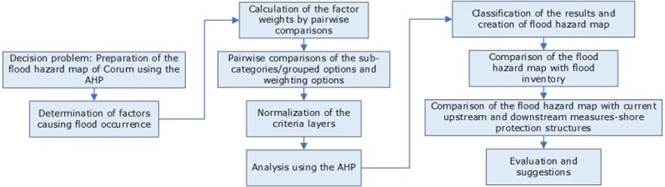
Figure 2
Workflow of the study.
Workflow of the study.
The data and technical specifications used for the preparation of the criteria layers and analyses in the study are shown in Table 1. Processing of the data and multi-criteria decision analysis, based on AHP, was performed using ArcGIS 10.0 software. The sub-basins and drainage networks were obtained from a DEM using ArcGIS and the Arc Hydro tool.
Table 1
Data and technical specifications.
Data and technical specifications.
| Data (date) | Scale/resolution | Source |
|---|---|---|
| Aster GDEM (2011) | 1 Arc-Second | USGS Earth Explorer |
| Precipitation (long-term average, up-to-date) | 1/100 000 | Turkish General Directorate of Meteorology |
| Geology (up-to-date) | 1/100 000, 1/500 000 | Turkish General Directorate of Mineral Research and Exploration |
| Flood protection structures (up-to-date) | 1/1 000, 1/5 000, 1/25 000 | Turkish General Directorate of State Hydraulic Works |
| Land use/cover (2012) | 100 m pixel size | European Environment Agency |
| Landsat OLI (2018) | 30 m pixel size | USGS Earth Explorer |
Determination of factors
The determination of the factors causing flood occurrence is important in terms of assessment of the flood hazard and is the first step in the production of flood hazard maps. For this reason, the factors must be determined in such a way as to fully characterize the problem. In the present study, the literature survey (Yalcin & Akyurek, 2004; Sinha et al., 2008; Fernandez & Lutz, 2010; Stefanidis & Stathis, 2013; Siddayao et al., 2014; Ouma & Tateishi, 2014; Xiao et al., 2017), the characteristics of the study area, and data accessibility and availability were taken into account, and the factors were determined as a) precipitation; b) land use/cover; c) Geology; d) elevation; e) Slope; f) aspect; g) distance to rivers; h) size of sub-basins, and i) shape of sub-basins.
-
Yalcin & Akyurek, 2004Analysis flood vulnerable areas with multicriteria evaluation, 2004
-
Sinha et al., 2008Flood risk analysis in the Kosi river basin, north Bihar using multi-parametric approach of Analytical Hierarchy Process (AHP)Journal of the Indian Society of Remote Sensing, 2008
-
Fernandez & Lutz, 2010Urban flood hazard zoning in Tucumán Province, Argentina, using GIS and multicriteria decision analysisEngineering Geology, 2010
-
Stefanidis & Stathis, 2013Assessment of flood hazard based on natural and anthropogenic factors using analytic hierarchy process (AHP)Natural Hazards, 2013
-
Siddayao et al., 2014Analytic hierarchy process (AHP) in spatial modeling for floodplain risk assessmentInternational Journal of Machine Learning and Computing, 2014
-
Ouma & Tateishi, 2014Urban flood vulnerability and risk mapping using integrated multi-parametric AHP and GIS: Methodological overview and case study assessmentWater, 2014
-
Xiao et al., 2017Integrated flood hazard assessment based on spatial ordered weighted averaging method considering spatial heterogeneity of risk preferenceScience of the Total Environment, 2017
Determination of criteria weights
Weights were determined using the pairwise comparison method, and the AHP preference scale in Table 2 was used in these comparisons. Based on this preference scale, all factors were compared in pairs in the range of 1-9. How important a factor is in comparison to the other was decided based on the literature survey, and the numerical value expressing this degree of importance was determined using Table 2. The pairwise comparison matrix of the factors is shown in Table 3.
Table 2
AHP preference scale (Saaty, 1980).
AHP preference scale (Saaty, 1980).
| Definition | AHP scale |
|---|---|
| Equal importance | 1 |
| Item 1 is slightly more important than item 2 | 3 |
| Item 1 is more important than item 2 | 5 |
| Item 1 is very strong important relative to item 2 | 7 |
| Item 1 is extremely important relative to item 2 | 9 |
| 2, 4, 6, 8 intermediate values | |
| 1/2, 1/3, 1/4, 1/5, 1/6, 1/7, 1/8, 1/9 reciprocal values |
-
Saaty, 1980The analytic hierarchy process, 1980
Table 3
Pairwise comparison matrix.
Pairwise comparison matrix.
| Criterion | C1 | C2 | C3 | C4 | C5 | C6 | C7 | C8 | C9 |
|---|---|---|---|---|---|---|---|---|---|
| C1 | 1 | 2 | 3 | 4 | 5 | 5 | 6 | 6 | 6 |
| C2 | 1/2 | 1 | 3 | 4 | 5 | 5 | 6 | 6 | 6 |
| C3 | 1/3 | 1/3 | 1 | 2 | 3 | 3 | 4 | 5 | 6 |
| C4 | 1/4 | 1/4 | 1/2 | 1 | 2 | 2 | 4 | 5 | 6 |
| C5 | 1/5 | 1/5 | 1/3 | 1/2 | 1 | 2 | 3 | 4 | 5 |
| C6 | 1/5 | 1/5 | 1/3 | 1/2 | 1/2 | 1 | 2 | 3 | 4 |
| C7 | 1/6 | 1/6 | 1/4 | 1/4 | 1/3 | 1/2 | 1 | 2 | 3 |
| C8 | 1/6 | 1/6 | 1/5 | 1/5 | 1/4 | 1/3 | 1/2 | 1 | 2 |
| C9 | 1/6 | 1/6 | 1/6 | 1/6 | 1/5 | 1/4 | 1/3 | 1/2 | 1 |
| C1: Precipitation, C2: Distance to rivers, C3: Slope, C4: Elevation, C5: Land use/cover, C6: Geology, C7: Aspect, C8: Size of sub-basins, C9: Shape of sub-basins. | |||||||||
To obtain the relative weights of the criteria, as a total weight of 1, column sums are taken in the pairwise comparison matrix, and each value is divided by the column sum. The relative weights are then calculated by averaging each line (Table 4).
Table 4
Weight calculation.
Weight calculation.
| Criterion | C1 | C2 | C3 | C4 | C5 | C6 | C7 | C8 | C9 | Weights |
|---|---|---|---|---|---|---|---|---|---|---|
| C1 | 0.335 | 0.446 | 0.342 | 0.317 | 0.289 | 0.262 | 0.224 | 0.185 | 0.154 | 0.284 |
| C2 | 0.168 | 0.223 | 0.342 | 0.317 | 0.289 | 0.262 | 0.224 | 0.185 | 0.154 | 0.240 |
| C3 | 0.112 | 0.074 | 0.114 | 0.159 | 0.174 | 0.157 | 0.149 | 0.154 | 0.154 | 0.138 |
| C4 | 0.084 | 0.056 | 0.057 | 0.079 | 0.116 | 0.105 | 0.149 | 0.154 | 0.154 | 0.106 |
| C5 | 0.067 | 0.045 | 0.038 | 0.040 | 0.058 | 0.105 | 0.112 | 0.123 | 0.128 | 0.079 |
| C6 | 0.067 | 0.045 | 0.038 | 0.040 | 0.029 | 0.052 | 0.075 | 0.092 | 0.103 | 0.060 |
| C7 | 0.056 | 0.037 | 0.028 | 0.020 | 0.019 | 0.026 | 0.037 | 0.062 | 0.077 | 0.040 |
| C8 | 0.056 | 0.037 | 0.023 | 0.016 | 0.014 | 0.017 | 0.019 | 0.031 | 0.051 | 0.029 |
| C9 | 0.056 | 0.037 | 0.019 | 0.013 | 0.012 | 0.013 | 0.012 | 0.015 | 0.026 | 0.023 |
| Total | 1.000 | 1.000 | 1.000 | 1.000 | 1.000 | 1.000 | 1.000 | 1.000 | 1.000 | 1.000 |
The consistency ratio was calculated to determine the consistency of the pairwise comparison judgments. For this purpose, weights and each line of the pairwise comparison matrix are multiplied and added. These values are then divided by weights. By taking the average of these values, the average value of the consistency vector, λ, is calculated. Then the consistency index, CI, is calculated according to Equation (2). In this equation, n is the number of criteria. The consistency ratio, CR, is calculated by dividing the CI by the RI Randomness Index (Table 5), which varies depending on the number of factors to be compared, as indicated in Equation (3) (Malczewski, 1999b). In this study, the number of criteria is 9, so the RI is 1.45, according to the Randomness Index in Table 5. The consistency ratio was calculated as 0.05, which is smaller than the 0.10 limit value suggested bySaaty (1980), so the pairwise comparison judgments are consistent (Table 6):
-
Malczewski, 1999bGIS and multicriteria decision analysis, 1999
-
Saaty (1980)The analytic hierarchy process, 1980
e2
C
I
=
λ
-
n
n
-
1
(2)
e3
C
R
=
C
I
R
I
(3)
Table 5
Randomness Index (Malczewski, 1999b).
Randomness Index (Malczewski, 1999b).
| n | 1 | 2 | 3 | 4 | 5 | 6 | 7 | 8 | 9 | 10 | 11 | 12 | 13 | 14 | 15 |
|---|---|---|---|---|---|---|---|---|---|---|---|---|---|---|---|
| RI | 0.00 | 0.00 | 0.58 | 0.90 | 1.12 | 1.24 | 1.32 | 1.41 | 1.45 | 1.49 | 1.51 | 1.48 | 1.56 | 1.57 | 1.59 |
-
Malczewski, 1999bGIS and multicriteria decision analysis, 1999
Table 6
Calculation of consistency.
Calculation of consistency.
| Step 1 | Step 2 |
|---|---|
| 1x0.284+2x0.240+3x0.138+4x0.106+5x0.079+5x0.060 +6x0.040+6x0.029+6x0.023=2.849 | 10.032 |
| 1/2x0.284+1x0.240+3x0.138+4x0.106+5x0.079+5x0.060 +6x0.040+6x0.029+6x0.023=2.467 | 10.279 |
| 1/3x0.284+1/3x0.240+1x0.138+2x0.106+3x0.079+3x0.060 +4x0.040+5x0.029+6x0.023=1.385 | 10.034 |
| 1/4x0.284+1/4x0.240+1/2x0.138+1x0.106+2x0.079+2x0.060 +4x0.040+5x0.029+6x0.023=1.027 | 9.689 |
| 1/5x0.284+1/5x0.240+1/3x0.138+1/2x0.106+1x0.079+2x0.060 +3x0.040+4x0.029+5x0.023=0.754 | 9.542 |
| 1/5x0.284+1/5x0.240+1/3x0.138+1/2x0.106+1/2x0.079+1x0.060 +2x0.040+3x0.029+4x0.023=0.553 | 9.214 |
| 1/6x0.284+1/6x0.240+1/4x0.138+1/4x0.106+1/3x0.079+1/2x0.060 +1x0.040+2x0.029+3x0.023=0.372 | 9.292 |
| 1/6x0.284+1/6x0.240+1/5x0.138+1/5x0.106+1/4x0.079+1/3x0.060 +1/2x0.040+1x0.029+2x0.023=0.271 | 9.341 |
| 1/6x0.284+1/6x0.240+1/6x0.138+1/6x0.106+1/5x0.079+1/4x0.060 +1/3x0.040+1/2x0.029+1x0.023=0.210 | 9.114 |
|
λ = 9.615 CI = 0.077 CR = 0.05 |
|
Preparation and normalization of criteria layers
Criterion layers were prepared, and the options in each criterion layer were rated in terms of flood hazard. Normalization procedures were then performed to standardize all criteria layers at the same value range.
Preparation of criteria layers
All criteria layers were prepared in the framework of Corum province borders. All of the criterion layers were prepared as raster data of 100 m pixel size considering the scale and resolution of the data used. The data and methods used in the preparation of the criteria layers are summarized in Table 7.
Table 7
Data and methods used in the preparation of criteria layers.
Data and methods used in the preparation of criteria layers.
| Criteria layers | Data | Method |
|---|---|---|
| Precipitation | The long-term average annual precipitation from meteorological stations data | The spatial distribution of precipitation was determined using Inverse Distance Weighted (IDW) method |
| Land use/cover | CORINE 2012 | Current land use/cover was obtained by updating CORINE 2012 with visual interpretation of Landsat OLI data of 2018 |
| Geology | 1/100 000 scale and 1/500 000 scale geological maps | The geological map was categorized into three classes: new alluvium, old alluvium and other |
| Elevation | Aster GDEM | Aster GDEM data was converted to 100 m pixel size data, then sinks and peaks errors were eliminated from DEM using the “Fill Sinks” function in Arc Hydro, resulting in enhanced DEM data |
| Slope | Elevation | A slope layer was created using the enhanced DEM data |
| Aspect | Elevation | An aspect layer was created using the enhanced DEM data |
| Distance to rivers | Drainage network derived from Aster GDEM | Distance to rivers layer was created using the "Euclidean Distance" function of ArcGIS 10.0 software |
| Size of sub-basins | Aster GDEM | The sub-basins of the Kizilirmak and Yesilirmak basins in the study area were obtained using the drainage network and flow direction. For this purpose, the “Catchment Grid Delineation” function is used in Arc Hydro. Because this function produces the sub-basins in the grid form, sub-basin boundaries in grid form were converted into vector form and the area of each sub-basin was calculated |
| Shape of sub-basins | Aster GDEM | The length-to-width ratio of sub-basin was obtained by proportioning the distance in the direction of flow to distance perpendicular to this. According to this, the basins are categorized into three classes as circular, semi-circular and elongated basin by using determined threshold values |
Each criterion layer was evaluated in terms of flood hazard and scored at the sub-category level. For this purpose, land use/cover, geology, aspect, size of sub-basins, and shape of sub-basins were sub-categorized, and sub-categories were weighted by the method of pairwise comparison. From these layers, land use/cover, geology, aspect, and shape of sub-basins have class values with verbal terms, and since there are few sub-classes, pairwise comparisons have been made using these classes directly. However, since the total number of sub-basins is 27, it is difficult to evaluate size of sub-basins by pairwise comparison. Therefore, pairwise comparisons have been made for grouped values.
The weights obtained by pairwise comparisons of sub-categories/grouped options for land use/cover, geology, aspect, size of sub-basins, and the shape of sub-basins and the consistency ratio of pairwise comparisons are summarized in Table 8. As the consistency ratio was below 0.10 for all criteria, all judgments were consistent.
Table 8
The coefficients of the sub-categories/grouped options of criteria obtained by pairwise comparisons and consistency ratios of pairwise comparisons.
The coefficients of the sub-categories/grouped options of criteria obtained by pairwise comparisons and consistency ratios of pairwise comparisons.
| Criteria | Sub-categories/Grouped options of criteria | Weights |
|---|---|---|
| Land use/cover (CR=0.08) | Water bodies | 0.342 |
| Wetlands | 0.342 | |
| Artificial areas | 0.216 | |
| Agricultural areas | 0.073 | |
| Forest and semi-natural areas | 0.029 | |
| Geology (CR = 0.09) | New alluvium | 0.640 |
| Old alluvium | 0.306 | |
| Otder | 0.054 | |
| Aspect (CR = 0.01) | Flat | 0.289 |
| Nortd | 0.197 | |
| Nortdeast | 0.123 | |
| Nortdwest | 0.123 | |
| East | 0.075 | |
| West | 0.075 | |
| Soutdeast | 0.045 | |
| Soutdwest | 0.045 | |
| Soutd | 0.028 | |
| Size of sub-basins (km2) (CR = 0.02) | 3 000-3 500 | 0.350 |
| 2 500-3 000 | 0.237 | |
| 2 000-2 500 | 0.159 | |
| 1 500-2 000 | 0.106 | |
| 1 000-1 500 | 0.070 | |
| 500-1 000 | 0.046 | |
| 0-500 | 0.032 | |
| Shape of sub-basins (CR = 0.06) | Circular | 0.643 |
| Semi-circular | 0.283 | |
| Elongated | 0.074 |
The precipitation, elevation, slope, and distance to rivers were in the grid form, and each grid had different values. For this reason, instead of being grouped and scored by pairwise comparisons, the data were scaled in the range 0-1 using the “linear scale transformation”. Here, 1 is most prone to flooding, and 0 is the least prone. Areas near to rivers are more affected by floods, and accumulation occurs where low slopes occur and low elevations are exposed to water from high elevations. For this purpose, it is assumed that there is a linear change between the border to rivers and the farthest places (1 for the border to rivers and 0 for the farthest places from rivers). Similarly, the elevation data (with the lowest elevation value of 1 and the highest elevation value of 0) and the slope data (with the lowest slope of 1 and the highest slope of 0) are scaled to 0-1. Precipitation data were also scaled between 0 and 1 (maximum precipitation value of 1 and minimum precipitation value of 0).
Normalization of criteria layers
Normalization has been performed so that all criteria layers are within the same evaluation range. The sum of all sub-categories/grouped options values obtained by pairwise comparisons for land use/cover, geology, aspect, size of sub-basins, and shape of sub-basins layers is 1. These data should be in the same scale range to be processed with precipitation, elevation, slope, and distance to rivers layers. For this purpose, “linear scale transformation” was applied to the layers in which options were scored by pairwise comparisons and the values were adjusted into the range 0-1. Because precipitation, elevation, slope, and distance to rivers were generated in the range 0-1 in the previous process step, this process is unnecessary for these. The normalized criteria layers are in the 0-1 interval, and the higher level of flood hazard is represented by values close to 1, while the lower level is represented by values close to 0.
Application of decision analysis with AHP
Decision analysis was performed with AHP using criteria weights determined by pairwise comparison technique and normalized criteria layers, and a hazard map was created. This map was compared with Corum province flood inventory information, and the validity of the study was checked. Moreover, we examined the compatibility of the locations of existing and planned flood protection measures in Corum with the hazard map. The results of the analysis with AHP, the classification of the results, compatibility of the hazard map with flood inventory, and the examination of the existing and planned measures are discussed in detail in the Results and Discussion section.
Results and discussion
The value range of the AHP-generated hazard map was 0.38-0.92. Higher values indicate a greater level flood hazard. To provide a more interpretable visualization of the analysis results obtained by the AHP, an “equally interval classification” method was used in the ArcGIS 10.0 environment, and the flood hazard was classified into five groups: “1: Very high”; “2: High”; “3: Medium”; “4: Low”, and “5: Very low” (Figure 3). The classification results suggest that 3 % of the Corum area (385 km2) exhibited very high level flood hazard; 25 % (3 205 km2) showed high level flood hazard; 49 % (6 282 km2) medium; 21 % (2 692 km2) low, and 2 % (256 km2) very low.
Thumbnail
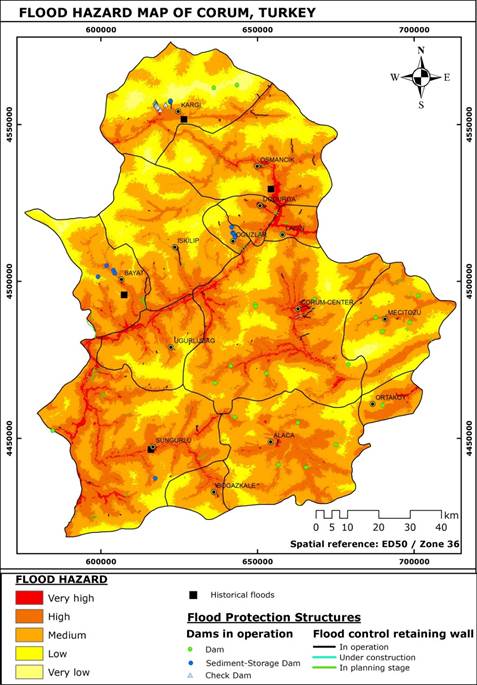
Figure 3
Flood hazard map.
Flood hazard map.
To test the accuracy of the flood hazard assessment obtained by AHP, the results of the analysis were compared with the flood inventory in Corum, and it was determined that the existing inventory and the hazard map are compatible (Figure 3). However, the main problem in this comparison was that only a limited number of historical floods had coordinated data. For this reason, the flood hazard map was also overlapped with the district boundaries of Corum, and the areal distribution of areas where flood hazard is important (flood hazard category is very high and high) for districts was obtained. As a result of this process, the higher values were in Sungurlu, Corum-Center, and Osmancik, respectively, and this situation was in line with Corum flood reports. Therefore, as a result of these comparisons, it is thought that the results of the analysis obtained will provide a realistic representation of the flood hazard areas.
To determine the land use/cover status of the very high and high level flood hazard areas, which can be considered as the most vulnerable zones in possible floods, the hazard maps and the land use/cover have been overlapped and the spatial usage information of the areas with very high and high level flood hazard have been obtained. According to this, it has been determined that about 43.64 km2 of the artificial area has a very high level flood hazard, and 87.61 km2 of the artificial area has a high level flood hazard in Corum (Table 9).
Table 9
Spatial use of very high and high flood hazard areas in Corum (km2).
Spatial use of very high and high flood hazard areas in Corum (km2).
| Artificial areas | Agricultural areas | Forest and semi-natural areas | |
|---|---|---|---|
| Very high hazard | 43.64 | 283.82 | 11.57 |
| High hazard | 87.61 | 2 418.93 | 717.42 |
A large number of flood protection structures have been built due to the experienced and possible floods in Corum. There are a total of 14 sediment-storage dams and 17 check dams. The total number of dams and small dams in operation is six and 15, respectively. A total of 206 projects for flood control retaining wall, erosion and sediment control structures have been carried out, of which 85 are in operation, 1 is under construction, and 120 are in the planning stage. The locations of the sediment-storage dams, flood control retaining wall, check dams, dams, and small dams overlapped with the hazard map are shown in Figure 3.
From Figure 3, it is seen that flood protection structures have been constructed or planned in many locations with very high level flood hazard in the existing hazard map. This proves that the hazard map presents problematic areas accurately. In this respect, in places where there is a very high and high flood hazard and flood protection measures have not been taken, it is necessary to prepare hazard maps based on hydraulic-hydrological modeling and accordingly to create flood protection projects must be made and these projects must be passed on to life as soon as possible. These measures are costly, need to be constructed primarily to start from settlements, areas with very high and high levels of hazard must be closely monitored, and measures must be completed in a timely manner. Along with this, the establishment of new settlements and zoning studies should be carried out with care in hazardous locations where no precautions are taken.
Based on our findings, MCDA and GIS integration can be used effectively in determining the flood hazard. The weights of criteria and sub-categories/grouped options were determined by pairwise comparison technique in accordance with the AHP method. MCDA is subjective and introduces a risk of bias. To reduce this potential bias, the consistency ratio of the pairwise comparisons was calculated, and it was checked that the consistency ratios were below the 0.10 threshold value suggested by Saaty (1980).
-
Saaty (1980)The analytic hierarchy process, 1980
The findings of this study were compared with the previous studies in Corum, and good agreement was obtained. Erdede and Öztürk (2016) stated that flood hazard is higher around the Strahler 7th-order stream segments in the Kizilirmak Basin. In our study, this region has been identified as having a very high flood hazard. In addition, it has been observed that the areas where flood hazard is important (very high and high level flood hazard areas) in Corum-Center are compatible with the areas indicated in Kaya and Akdemir (2019).
-
Erdede and Öztürk (2016)Evaluation of flood potential of Kizilirmak Basin using linear, areal and relief morphometric indices (Kızılırmak havzasının taşkın potansiyelinin çizgisel, alansal ve rölyef morfometrik indisler kullanılarak değerlendirilmesi), 2016
-
Kaya and Akdemir (2019)Urban morphology of Corum (Çorum kent morfolojisi), 2019
Conclusion
Here we evaluated the flood hazard of Corum province, and a flood hazard map was prepared. In the preparation of the flood hazard map, AHP, which is a MCDA method, was used, and the analysis was carried out by weighting the factors affecting floods. By this approach, it was determined that 3 % of Corum has a very high level flood hazard, and 25 % has a high level flood hazard. The hazard map produced here is compatible with historical floods, suggesting that the hazard map provides a realistic representation of the areas that are likely to be affected by possible future floods.
When the structural measures were compared to the flood hazard map in Corum province, a large part of the existing measures corresponds to the very high and high flood hazard areas. Therefore, it is important to carry out detailed investigations and take necessary measures for other areas where flood hazard is important.
Based on our findings, we propose that the hazard assessment based on the MCDA provides a realistic view, correctly handles the factors affecting flood, and can be useful to determine locations where a hazard assessment based on hydraulic-hydrological models (requires high-resolution and large-scale data and is time-consuming and costly, and therefore not applicable to every field) is required. In this context, we recommend that flood hazard assessment studies should be carried out primarily by MCDA on the general scale, and then by hydraulic-hydrological models based on the areas prioritized by the MCDA.
References
- Babister, M., McLuckie, D., Retallick, M., Askew, E., & Toniato, A. (2016). Spatially defining flood risk. In: Constantinescu, G., Garcia, M., & Hanes, D. (eds.). River flow 2016 (pp. 1982-1989). London, UK: Taylor & Francis Group. Links
- Bao, Q., Ruan, D., Shen, Y., Hermans, E., & Janssens, D. (2012). TOPSIS and its extensions: Applications for road safety performance evaluation. In: Kahraman, C. (ed.). Computational intelligence systems in industrial engineering: With recent theory and applications (pp. 109-130). Paris, France: Atlantis Press. Links
- Corum Governorship. (2017). Environmental status report of Corum province for 2016 (Çorum ili 2016 yılı çevre durum raporu). Corum, Turkey: Environmental Impact Assessment and Permit Branch Office (Çevresel Etki Değerlendirme ve İzin Şube Müdürlüğü) (in Turkish). Links
- De-Brito, M. M., & Evers, M. (2016). Multi-criteria decision-making for flood risk management: A survey of the current state of the art.Natural Hazards and Earth System Sciences, 16(4), 1019-1033. DOI: 10.5194/nhess-16-1019-2016 Links
- Ercan, B., Yagci, A. E., Yilmaz, A. S., Yuce, M. I., & Unsal, M. (2019). Annual runoff modelling of Kizilirmak Basin by artificial intelligent techniques. Fresenius Environmental Bulletin, 8(9), 6651-6660. Links
- Erdede, B., & Öztürk, D. (2016). Evaluation of flood potential of Kizilirmak Basin using linear, areal and relief morphometric indices (Kızılırmak havzasının taşkın potansiyelinin çizgisel, alansal ve rölyef morfometrik indisler kullanılarak değerlendirilmesi). 6thRemote Sensing-GIS Symposium (UZAL-CBS 2016), Adana, Turkey, 5-7 October 2016 (in Turkish). Links
- Ezz, H. (2018). Integrating GIS and HEC-RAS to model Assiut plateau runoff.The Egyptian Journal of Remote Sensing and Space Science, 21(3), 219-227. DOI: 10.1016/j.ejrs.2017.11.002 Links
- Fernandez, D. S., & Lutz, M. A. (2010). Urban flood hazard zoning in Tucumán Province, Argentina, using GIS and multicriteria decision analysis.Engineering Geology, 111(1-4), 90-98. DOI: 10.1016/j.enggeo.2009.12.006 Links
- Huong, H. T. L., & Pathirana, A. (2013). Urbanization and climate change impacts on future urban flooding in Can Tho city, Vietnam. Hydrology and Earth System Sciences, 17(1), 379-394, DOI: 10.5194/hess-17-379 Links
- Jha, A. K., Bloch, R., & Lamond, J. (2012). Cities and flooding a guide to integrated urban flood risk management for the 21st century. Washington, DC, USA: The World Bank. Links
- Jonkman, N. S., Gerritsen, H., & Marchand, M. (2012). Coastal storm. In: Wisner, B., Gaillard, J. C., & Kelman, I. (eds.). Handbook of hazards and disaster risk reduction and management. New York, USA: Taylor & Francis. Links
- Kaya, A. Y., & Akdemir, İ.O. (2019). Urban morphology of Corum (Çorum kent morfolojisi). İstanbul, Turkey: Hiperlink Yayınları (in Turkish). Links
- Kaygın, E., & Güven, B. (2013). SWOT analysis for Corum province (Çorum ili SWOT analizi). İstanbul, Turkey: Veritas Yayıncılık (in Turkish). Links
- Khalfallah, C. B., & Saidi, S. (2018). Spatiotemporal floodplain mapping and prediction using HEC-RAS-GIS tools: Case of the Mejerda river, Tunisia. Journal of African Earth Sciences, 142, 44-51, DOI: 10.1016/j.jafrearsci.2018.03.004 Links
- Kundzewicz, Z. W., & Stoffel, M. (2016). Anatomy of flood risk. In: Kundzewicz, Z., Stoffel, M., Niedźwiedź, T., & Wyżga, B. (eds.). Flood risk in the Upper Vistula Basin (pp. 39-52). Cham, Switzerland: Springer. Links
- Linkov, I., & Moberg, E. (2011).Multi-criteria decision analysis: Environmental applications and case studies. New York, USA: CRC Press. Links
- Loucks, D. P., & Van Beek, E. (2017).Water resource systems planning and management: An introduction to methods, models, and applications. Cham, Switzerland: Springer . Links
- Lyu, H. M., Sun, W. J., Shen, S. L., & Arulrajah, A. (2018). Flood risk assessment in metro systems of mega-cities using a GIS-based modeling approach.Science of the Total Environment, 626, 1012-1025. DOI: 10.1016/j.scitotenv.2018.01.138 Links
- Mai, D. T., & De-Smedt, F. (2017). A combined hydrological and hydraulic model for flood prediction in Vietnam applied to the Huong river basin as a test case study.Water, 9(11), 879. DOI:10.3390/w9110879 Links
- Malczewski, J. (1999a). Spatial multicriteria decision analysis. Thill, J. -C. (ed.). Decision making and analysis: A geographic information sciences approach (Part 1). New York, USA: Ashgate. Links
- Malczewski, J. (1999b). GIS and multicriteria decision analysis. New York, USA: John Wiley and Sons. Links
- Malczewski, J., & Rinner, C. (2015). Multicriteria decision analysis in geographic information science. New York, USA: Springer. Links
- Moel, H. & Aerts, J. C. J. H. (2008). Flood risk mapping in Europe: A comparative evaluation of methods, availability and applications. IV. International Symposium on Flood Defence, Toronto, Canada, May 6-8, 2008. Links
- Murck, B. W. & Skinner, B. J. (2016). Visualizing geology. New Jersey, USA: John Wiley & Sons. Links
- National Research Council. (1996).Alluvial fan flooding. Washington, DC, USA: National Academies Press. Links
- National Research Council. (1983). Improving the flood insurance study process. Washington, DC, USA: The National Academies Press. Links
- Nivolianitou, Z., Synodinou, B., & Manca, D. (2015). Flood disaster management with the use of AHP.International Journal of Multicriteria Decision Making, 5(1-2), 152-164. DOI: 10.1504/IJMCDM.2015.067943 Links
- Ouma, Y. O., & Tateishi, R. (2014). Urban flood vulnerability and risk mapping using integrated multi-parametric AHP and GIS: Methodological overview and case study assessment.Water, 6(6), 1515-1545. DOI: 10.3390/w6061515 Links
- Papaioannou, G., Vasiliades, L., & Loukas, A. (2015). Multi-criteria analysis framework for potential flood prone areas mapping.Water resources management, 29(2), 399-418. DOI: 10.1007/s11269-014-0817-6 Links
- Price, R. K., & Vojinovic, Z. (2008). Urban flood disaster management. Urban Water Journal, 5(3), 259-276, DOI: 10.1080/15730620802099721 Links
- Saaty, T. L. (1980). The analytic hierarchy process. New York, USA: McGraw-Hill Comp. Links
- Saaty, T. L., & Vargas, L. G. (2012).Models, methods, concepts & applications of the analytic hierarchy process(vol. 175). New York, USA: Springer Science & Business Media. Links
- Sakieh, Y. (2017). Understanding the effect of spatial patterns on the vulnerability of urban areas to flooding.International Journal of Disaster Risk Reduction, 25, 125-136. DOI: 10.1016/j.ijdrr.2017.09.004 Links
- Siddayao, G. P., Valdez, S. E., & Fernandez, P. L. (2014). Analytic hierarchy process (AHP) in spatial modeling for floodplain risk assessment. International Journal of Machine Learning and Computing, 4(5), 450-457. DOI: 10.7763/IJMLC.2014.V4.453 Links
- Simonovic, S. P. (2013). Floods in a changing climate: Risk management. Cambridge, UK: Cambridge University Press. Links
- Sinha, R., Bapalu, G. V., Singh, L. K., & Rath, B. (2008). Flood risk analysis in the Kosi river basin, north Bihar using multi-parametric approach of Analytical Hierarchy Process (AHP). Journal of the Indian Society of Remote Sensing, 36(4), 335-349. DOI: 10.1007/s12524-008-0034-y Links
- Stefanidis, S., & Stathis, D. (2013). Assessment of flood hazard based on natural and anthropogenic factors using analytic hierarchy process (AHP). Natural Hazards, 68(2), 569-585. DOI:10.1007/s11069-013-0639-5 Links
- Turkish General Directorate of Meteorology. (2020). Official statistics (Resmi istatistikler). Retrieved from https://www.mgm.gov.tr/veridegerlendirme/il-ve-ilceler-istatistik.aspx?m=CORUM, May 1, 2020 (in Turkish). Links
- Turkish General Directorate of State Hydraulic Works. (1998). Flood yearbook of Turkey's river basins (Türkiye akarsu havzaları taşkın yıllığı). Ankara, Turkey: DSİ Yayınları (in Turkish). Links
- Turkish General Directorate of State Hydraulic Works. (2017). Official archive. Corum, Turkey (in Turkish). Links
- Turkish Statistical Institute. (2020). Statistical indicators (İstatistik göstergeler). Retrieved from http://www.tuik.gov.tr/, May 2, 2020 (in Turkish). Links
- United Nations, Department of Economic and Social Affairs. (1976). Guidelines for flood loss prevention and management in developing countries. New York, USA: United Nations Publication. Links
- Xiao, Y., Yi, S., & Tang, Z. (2017). Integrated flood hazard assessment based on spatial ordered weighted averaging method considering spatial heterogeneity of risk preference.Science of the Total Environment, 599-600, 1034-1046. DOI: 10.1016/j.scitotenv.2017.04.218 0048-9697 Links
- Yalcin, G., & Akyurek, Z. (2004). Analysis flood vulnerable areas with multicriteria evaluation. XXth International Society for Photogrammetry and Remote Sensing Congress, Istanbul, Turkey, July 12-23, 2004. Links
- Yüce, M. İ. & Ercan, B. (2015). Determination of rainfall-runoff relationship in Kızılırmak Basin (Kızılırmak havzası yağış-akış ilişkisinin belirlenmesi). 4th Water Structures Symposium (4. Su Yapıları Sempozyumu), Antalya, Turkey, 19-21 November 2015, Proceedings, pp. 410-418 (in Turkish). Links
- Zevenbergen, C., Cashman, A., Evelpidou, N., Pasche, E., Garvin, S., & Ashley, R. (2010). Urban flood management. Boca Raton, USA: CRC Press. Links
- Zhu, T., Lund, J. R., Jenkins, M. W., Marques, G. F., & Ritzema, R. S. (2007). Climate change, urbanization, and optimal long-term floodplain protection. Water Resources Research, 43(W06421), 1-11, DOI: 10.1029/2004WR003516 Links
- Zhu, X. (2016).GIS for environmental applications: A practical approach. New York, USA: Routledge. Links