


Servicios Personalizados
Revista
Articulo
 Inglés (pdf)
  Artículo en XML
 Referencias del artículo
 Enviar artículo por email
Indicadores
 Citado por SciELO
 Accesos
Links relacionados
 Similares en SciELO
Compartir

 Permalink
Atmósfera
versión impresa ISSN 0187-6236
Atmósfera vol.25 no.1 Ciudad de México ene. 2012
The life cycle of extreme rainfall events over western Saudi Arabia simulated by a regional climate model: Case study of November 1996
M. Almazroui
Center of Excellence for Climate Change Research/Department of Meteorology,
King Abdulaziz University, PO Box 80234, Jeddah 21589, Saudi Arabia
e-mail: mansour@kau.edu.sa
Received March 19, 2011; accepted September 28, 2011
RESUMEN
Se utilizó un modelo climático regional (RCM, por sus siglas en inglés) para simular y entender el ciclo de vida de dos sistemas que produjeron fuertes períodos de lluvia sobre el occidente de Arabia Saudita en noviembre de 1996. El primer período de lluvia fuerte ocurrió del 13 al 20 de noviembre y el segundo del 25 al 27 de noviembre de 1996. Se comparan sus patrones espaciales con datos pluviómétricos, con el análisis conjunto de precipitación (CMAP, por sus siglas en inglés) del Climate Prediction Center (CPC) y con las observaciones reticuladas del Global Precipitation Climatology Project (GPCP). Se realizó una serie de 144 experimentos para diferentes tamaños de dominio y resolución así como para diferentes forzamientos de frontera y esquemas de parametrización convectiva con el fin de investigar la combinación óptima para simular los dos períodos. El RCM simula bien el desarrollo, la propagación y el ciclo de vida del primer período (8 días de duración) así como los del segundo (3 días de duración), durante noviembre de 1996. Un enfoque sobre la estación de Jeddah muestra que el RCM simula bien el máximo y la cantidad de lluvia para ambos períodos. Sin embargo el primer máximo está desfasado un día mientras que el segundo está subestimado.
ABSTRACT
A Regional Climate Model (RCM) is employed to simulate and understand the life cycle of the two systems that produced heavy rainfall spells over western Saudi Arabia in November 1996. The first spell of heavy rain occurred from 13 to 20 November, whereas the second occurred from 25 to 27 November 1996. Their spatial patterns are compared with rain-gauge data and also with the Climate Prediction Center (CPC) Merged Analysis of Precipitation (CMAP) and the Global Precipitation Climatology Project (GPCP) gridded observations. A series of 144 experiments are conducted for different domain sizes and resolution as well as different boundary forcings and convective parameterization schemes to investigate the optimum combination for the simulation of the two spells. The RCM simulates well the development, the propagation and the life cycle of the first spell (8-day long) as well as the second spell (3-day long) during November 1996. In particular, the simulation demonstrates how the two systems developed, merged with new cells, reached to maturity, and then decayed, as they moved eastward across the Red Sea, producing rain in the study region. A focus over Jeddah station reveals that the RCM simulated well the peak and amount of rainfall for both spells. However, the first peak is 1-day shifted, whilst the second peak is underestimated.
Keywords: Regional climate model (RCM), Saudi Arabia, rainfall event, life cycle.
1. Introduction
Natural disasters, such as floods, impact on many human activities including agriculture, water resources, power generation and industry. The level of vulnerability to natural disaster depends primarily on the regional climate and on climate variability, whether due to anthropogenic forces or natural processes. Trapp et al. (2007) studied regional variability in the environmental conditions suitable for driving the evolution of thunderstorms in the USA using the REGional Climate Model version 3 (RegCM3). They suggest that in the latter part of the 21st Century the number of days favorable for the development of severe thunderstorms will increase. The chief characteristic of a heavy rainfall event is likely to be flash flooding (Bettina et al., 1997), and thus, such an event (in any region) can be described as a natural hazard that causes major floods and severe destruction, often resulting in loss of lives. Therefore, understanding and being able to follow the evolution of a heavy rainfall event at the daily scale would be of considerable benefit to scientists in general and to the administrative authorities of a region in particular.
Flash floods are rare and violent occurrences that are characterized by a sudden and rapid rise in stream flow; their prediction presents an acute technical challenge. Flash floods are linked to intense thunderstorm events (associated with an extreme class of deep convective clouds), and are highly localized. Apart from producing dangerous lightning and torrential rainfall, such thunderstorms are responsible for high-impact weather, such as destructive surface wind, hail storms, and/or tornadoes (Trapp et al., 2007). In a dry and semi-arid region, such as Saudi Arabia (Abdullah and Al-Mazroui, 1998), severe thunderstorms may occur only a few times a year (Almazroui, 2011a) but when they happen, their socio-economic consequences can be devastating. For instance, on the coast of western Saudi Arabia, the city of Jeddah was recently struck by two severe thunderstorm events; the first was on the 25 November 2009 and second on the 26 January 2011. As the city of Jeddah is not equipped with the necessary infrastructure to deal with such significant levels of rainfall, severe destruction was caused by the ensuing flash floods, and monetary losses were estimated in millions of dollars. Also, the death toll from the first event was in excess of 120, while for the second event it was over 10 (Civil Defense 2011, Personal Communication).
Usually, mesoscale models are used for the forecasting of extreme weather events such as severe thunderstorms and heavy rainfall (Litta et al., 2007). However, accurate forecasting of extreme rainfall events remains a challenge for numerical modelers. For example, in the Mediterranean region, Romero et al. (1998) found that the simulations of excessive rainfall events by mesoscale models usually underestimate the rainfall peak. Furthermore, mesoscale models cannot be utilized for prediction beyond 3-5 days. Thus, a long-term forecasting model would be very helpful for preparing disaster plans.
Climate models, both at the global and regional scales, are the primary tools that aid in our understanding of the processes governing climate systems (Pal et al., 2007). Because of their ease of use and relatively higher resolution, as compared to Global Climate Models (GCMs), Regional Climate Models (RCMs) have proven to be more useful in providing regional climate details when nested within a lower-resolution GCM, or driven by re-analysis lateral boundary conditions, for regional climate studies (Liu et al., 1994; Dickinson et al., 1989; Giorgi and Bates, 1989). Global climatic conditions influence the local climate characteristics of a particular region, but the response of this local climate will differ from place to place because of the different circulation patterns of the region. Leung et al. (1999) used an RCM to simulate the heavy rainfall that occurred in China during the summer of 1991, which caused severe flooding in the Yangtze River. Shiao and Juang (2006) demonstrated that simulated large-scale circulation and rainfall distribution are more sensitive to the model domain size than to the model horizontal resolution. Similarly, Liu et al. (2009) used RegCM3 for the simulation of rainfall in China, and found that the model is very sensitive to the cumulus parameterization schemes. Recently, Almazroui (2011b) simulated two case studies using RegCM3 over Saudi Arabia, and found that the domain size and domain center are very sensitive in the simulation of heavy rainfall events in and around the city of Jeddah. Furthermore, the study also verifies the model performance through analyzing two more cases, which occurred in November 1996, using more parameterization options in the simulation. In summary, a successful simulation of a rainfall event by a climate model depends on many factors that need to be customized for a particular region.
The synoptic situation of the 8-day rainfall spell that occurred in Jeddah in November 1996 was described by Almazroui (2006). However, the organizational mechanism, life cycle and movement of such heavy rainfall events have not yet been investigated. The objective of the current study is to assess the capability of RegCM3 in simulating and providing the organizational mechanism of the rainfall systems that developed over western Saudi Arabia in November 1996.
2. Data used and methods
2.1 Model description
The Abdus Salam International Center for Theoretical Physics (ICTP), Earth Systems Physics (ESP) section developed the REGional Climate Model version 3 (RegCM3) (Pal et al., 2007). The dynamical core of the RegCM3 is based on the hydrostatic version of the NCAR/PSU (Pennsylvania State University) Mesoscale Model version 5 (MM5) (Grell et al., 1994). The RegCM3 grid and physics parameter values follow those of Pal et al. (2000). RegCM3 uses the radiation scheme of the NCAR CCM3, which is described in Kiehl et al. (1996). The surface physics are included using the Biosphere-Atmosphere Transfer Scheme (BATs), which is described in Dickinson et al. (1993). Similarly, the planetary boundary layer scheme, developed by Holtslag et al. (1990), is used in the model.
The RegCM3 convective precipitation parameterization scheme can be computed using one of the following schemes:
1) Modified-Kuo scheme (Anthes, 1977)
2) Grell scheme (Grell, 1993)
3) MIT-Emanuel scheme (Emanuel, 1991; Emanuel and Zivkovic-Rothman, 1999).
The Grell parameterization can be implemented using one of the following two closure assumptions:
Arakawa and Schubert closure (Arakawa and Schubert, 1974)
Fritsch and Chappell closure (Fritsch and Chappell, 1980)
The difference between the two closure assumptions is that the former relates the convective fluxes and rainfall to the tendencies in the state of the atmosphere, whereas the latter relates the convective fluxes to the degree of instability in the atmosphere. Both closure schemes used in the Grell parameterization achieve a statistical equilibrium between convection and the large-scale processes.
2.2 Experimental design
The lateral boundary conditions (LBCs) are used from the European Centre for Medium-Range Weather Forecasts (ECMWF) 40-year reanalysis datasets (2.5º × 2.5º grid, here-after referred to as ERA40), the NCEP reanalysis-1 datasets (2.5º × 2.5º grid, hereafter referred to as NCEP1), and the NCEP reanalysis-2 datasets (2.5º × 2.5º grid, hereafter referred to as NCEP2). The optimum interpolation sea surface temperature (OISST) 1º × 1º grid available on the weekly time scale (http://www.cdc.noaa.gov) is applied as the lower boundary over the ocean. The spatial distribution of rainfall simulated by RegCM3 is compared with the same obtained from the rain-gauge and the CMAP.
The experiments are performed in three phases. In the first phase, simulations are performed with 50 km horizontal grid resolution (60 × 60 grids), using the domain D1 centered on 21º N, 39º E (see Fig. 1). The model run starts at 0000 UTC on 01 August 1996 and is integrated continuously through 30 November 1996, using the three convective precipitation parameterization schemes (CPPSs): the Modified-Kuo scheme (hereafter referred to as KUO); the Grell scheme, and the MIT-Emanuel scheme (hereafter referred to as EMAN). The Grell scheme is used with both the Fritsch and Chappell (hereafter referred to as GFC) and the Arakawa Schubert (hereafter referred to as GAS) closure assumptions. The simulations began 4 months previously in order to allow a model spin-up time of at least three months before the occurrence date of the selected heavy rainfall event. In the second phase, the simulations are performed with 25, 30, 35, 40 and 45 km for the same domain D1. In the third phase, model runs are performed for the second domain D2 (108 × 92 grids) centered on 21º N, 39º E, for the third domain D3 (108 × 92 grids) centered on 20º N, 42º E, and for the fourth domain D4 (160 × 116 grids) centered on 20º N, 42º E. The effective domains are used after removing the buffer zone, and all simulation specifications are summarized in Table I.

2.3 Data used
In the current analysis, the rain-gauge data collected by the Presidency of Meteorology and Environment (PME) of Saudi Arabia for November 1996 are used. The Climate Prediction Center (CPC) Merged Analysis of Precipitation (CMAP, Xie and Arkin, 1997) and the Global Precipitation Climatology Project (GPCP, Adler et al., 2003) at a 2.5º × 2.5º resolution monthly mean rainfall data for November 1996 are used to obtain the spatial distribution of rainfall in the Jeddah area. CMAP is a global precipitation estimate, created by merging rain-gauge observations, satellite estimates of precipitation (IR and passive microwave) and precipitation fields generated by the National Centers for Environmental Prediction (NCEP)/National Center for Atmospheric Research (NCAR) re-analysis. GPCP is computed from microwave, infrared, and sounder data observed by the international constellation of precipitation-related satellites, and precipitation gauge analyses. The CMAP and GPCP data are obtained from ftp://ftp.ncep.noaa.gov and http://precip.gsfc.nasa.gov, respectively.
3. Results and discussion
3.1 Observed rainfall in November 1996
The spatial distribution of monthly accumulated rainfall (mm) obtained from the CMAP (left panel) and GPCP (right panel) data for November 1996 is displayed in Figure 2. A large amount of rainfall (more than 150 mm) occurred in the western part (Red Sea coast) of Saudi Arabia. The north-western region of the country also received a significant amount of rainfall, whereas the eastern region remained completely dry. This rainfall distribution is compared with the rain-gauge data, and is discussed next.
Figure 3 displays the monthly accumulated rain-gauge data in millimeters at different locations across Saudi Arabia for November 1996. The rain-gauge data confirms the occurrence of heavy rainfall over the central west coast of the country along the Red Sea. The simultaneous occurrence of significant amounts of rainfall in the north-western region of the country and the dryness in eastern parts are also apparent in the rain-gauge records. In this study, we intend to obtain the life cycle of the heavy rainfall events that developed over western Saudi Arabia in November 1996, and therefore, rainfall data analysis is required at the daily scale.
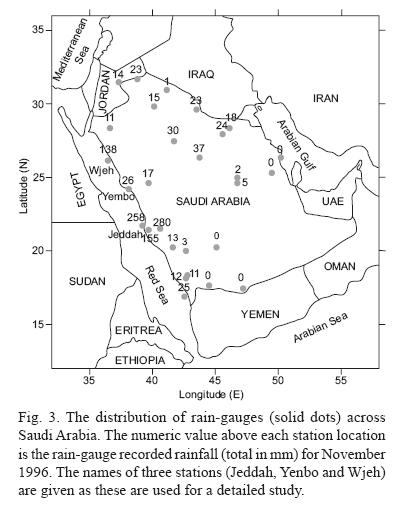
The rain-gauge records in November 1996 at Jeddah (21.71º N, 39.18º E), Yenbo (24.14º N, 38.06º E) and Wjeh (26.20º N, 36.47º E) reveal two spells. The first spell (8 consecutive days) was from 13-20 November, whilst the second spell (3 consecutive days) was from 25-27 November (Fig. 4). During the first spell, Jeddah station recorded more rainfall amounts than all other stations, with one peak on the 16 November (46 mm) and another on the 19 November (42 mm). During the second spell, Jeddah station again recorded the largest amount of rainfall, with a peak on the 25 November (55 mm). During both spells, Yenbo station recorded the lowest rainfall amount, not exceeding 26 mm for the whole month (see Fig. 3), whilst Wjeh station recorded the highest amount of rainfall on a single day (116.4 mm on 17 November). The accumulated rainfall is 258.11, 25.50 and 137.62 mm for, respectively, Jeddah, Yenbo and Wjeh stations in November 1996. Hence, it is clear that rainfall varies considerably with space and time in this region; during the first spell, Jeddah recorded its maximum on 16 November and Wjeh on 17 November, but in between these two stations, Yenbo recorded relatively low amounts of rain during this spell, and its maximum is only 9.8 mm (on 17 November). It is thus evident that two distinct spells occurred mostly in and around the Jeddah area, and therefore detailed investigations are made for this region only.

3.2 Simulation of rainfall events using RegCM3
3.2.1 RegCM3 LBC and CPPS
Figure 5 displays the monthly accumulated rainfall (mm) simulated by RegCM3 using ERA40 (left panels), NNRP1 (middle panels), and NNRP2 (right panels) with GFC (Figs. 5a-c), GAS (Figs. 5d-f), EMAN (Figs. 5g-i), and KUO (Figs. 5j-l) CPPS during November 1996. Irrespective of the LBCs, RegCM3 with GFC CPPS simulates well the rainfall in western Saudi Arabia. Although the rainfall amounts over the northern parts of Saudi Arabia are not insignificant, the greatest intensities are located in the western areas, i.e. over Jeddah and Wjeh (Fig. 3). This result indicates that the model is indeed capable of correctly simulating the monthly rainfall patterns over western Saudi Arabia. In this region, the structures of the rainfall distribution are similar regardless of the closure assumption used. Therefore, the change of closure assumption in Grell CPPS from GFC to GAS does not alter the simulation of rainfall over western Saudi Arabia. However, the intensity of rain over areas far away from the west coast is better simulated with the GFC option. In contrast, GAS CPPS produces heavy rain mostly over the center of the Red Sea, including its east coast, where Jeddah is located.
For the EMAN scheme, the model simulates the rainfall over western Saudi Arabia, however the intense rainfall core is slightly shifted to the north, compared to the CMAP and GPCP data (see Fig. 2). The simulation with the KUO scheme largely fails to reproduce the heavy rainfall in western Saudi Arabia, and the intense parts of the system are shifted slightly north-westward. In combination with the results discussed above, it is apparent that RegCM3 using any of the driving forcing with GFC and EMAN as the CPPS is able to simulate the rainfall distribution over western Saudi Arabia, whereas GAS and KUO fail. It is thus evident that RegCM3 using any of the driving forcings (i.e., ERA40, NNRP1 and NNRP2) along with the GFC scheme is the relatively better combination amongst all the considered options used in this study.
3.2.2 RegCM3 domain resolution
This section is a detailed investigation of the influence of domain resolution on the simulation of heavy rainfall events in western Saudi Arabia. Although Almazroui (2011b) examined the domain sensitivity for 50 and 25 km, in this current research we extend their test to more resolutions: 25, 30, 35, 40, 45 and 50 km.
Since the Jeddah station recorded well the peaks of the two rainfall spells during November 1996, the details of the domain sensitivity is performed for that selected station coordinates only. Figure 6 displays the monthly rainfall (mm) simulated by RegCM3 using NNRP2 with the GFC CPPS for different domain resolutions extracted at the Jeddah station coordinates. The simulated rainfall at Jeddah is compared with the rain-gauge (dashed line, Fig. 6) data. For the simulation using 25 km resolution, the model overestimates the rainfall amount (538.16 mm) compared to the rain-gauge value (258.11 mm), whereas the simulations using 40 and 35 km estimate it as 303.21 and 194.29 mm, respectively. The simulations for domains D2, D3 and D4 using different domain resolutions did not improve the rainfall estimation, and therefore they are not shown for brevity. It is also noted that RegCM3 using NNRP2 with the GFC CPPS and 25 km resolution simulates only 0.05 and 18.59 mm rain for the domains D2 and D3, respectively, and fails to reproduce the rain for the domain D4 (not shown). This means that a domain with high resolution does not produce any rain in a region if there is no rain in the low resolution run, at least in our case. It is also noted that the rainfall amount and domain resolution are very sensitive to LBCs and CPPSs, and therefore the combination shown in Figure 6 is for particular specifications and not generalized for any LBCs with any CPPSs.
Combining the results obtained above, it was decided to use RegCM3 with domain size of 2500 × 2500 km2 (60 × 60 grid at 40 km resolution) for simulating the heavy rainfall in western Saudi Arabia for our case study.
3.3 Life cycle of the rainfall system
The life cycle of the rainfall spells that occurred in November 1996 are studied using the model simulations for different suitable options.
Figure 7 displays the distribution of the daily rainfall (mm) simulated by RegCM3 using NNRP2 with GFC during the first spell. Absolutely no rainfall is simulated by RegCM3 in western Saudi Arabia on 13 November; however a convective cell is developed over eastern Sudan, very close to the west coast of the Red Sea (Fig. 7a). The cell moves eastward and develops further on 14 November. It crosses the Red Sea and it is in its mature stage on 16 November (Fig. 7d). After that, it extends spatially and reduces the size of the intense-rain core, indicating that the system is in a dissipating stage (Figs. 7e-f). The scattered distribution of these intense but dissipating cells produces heavy rainfall in the north-western areas on 17 and 18 November. A new cell develops and produces a large amount of rainfall over the Jeddah area on 19 November (Figs. 7f-g). The system moves south-eastward as it progresses into its decaying stage. Thus, it is clear that multiple cells develop from 13 to 20 November, reproducing the heavy rainfall in the Jeddah area (see Fig. 4). This system of cells develops, reaches its mature stage, releases copious quantities of rain and then decays and dissipates. All these processes continue for a number of days as for the previous simulation of the first spell by RegCM3. This is the unusual 8-day rainfall event that occurred in western Saudi Arabia. Similar life cycles are also obtained for ERA40 and NNRP1 for the same domain D1 (60 × 60 grid points) but these are not found for the D2, D3 and D4 domains (not shown). As discussed earlier, besides the GFC CPPS, EMAN also simulates well the monthly rainfall. Therefore, the details of the evolution of the first spell using the EMAN CPPS with different forcings are discussed next.
Similar to the above discussion, the simulation with the ERA40 LBC and the EMAN CPPS captures well the first spell (13-20 November 1996), as displayed in Fig. 8. It is worth mentioning that point-by-point matching of the simulated rain with station observations or gridded data is not yet possible, however the overall evolution of the system is well shown by RegCM3. Here we see intense rain in the Wjeh area on 17 November and in the Jeddah area on 19 November. The system is initiated in eastern Sudan (Fig. 8a), crosses the Red Sea (producing rain in western Saudi Arabia), and decays after 19 November. Overall, this life cycle is similar to the one obtained from NNRP2 with GFC, except that the intensity and the embedded areas are slightly different. It is noted that RegCM3 with EMAN is also used for the simulation of precipitation over eastern Africa and tropical Indian Ocean (Davis et al., 2009). They concluded that EMAN provides the most realistic simulation in reproducing spatial distribution of convective rainfall, compared to GFC and GAS, however it overestimates the total rainfall amount with respect to the observations.
Figure 9 displays the life cycle of the first spell simulated by RegCM3 using the NNRP1 LBC with the EMAN CPPS. Overall, the evolution of the system is reproduced well by the model. For instance, the intense rain over western Saudi Arabia is apparent for 16-18 November and very similar to the surface observations (see Fig. 4). As with the earlier explanation, the system is initiated in eastern Sudan, crosses the Red Sea (producing rain over western Saudi Arabia), and decays after 19 November. The life cycle is similar to the one obtained from ERA40 with the EMAN CPPS.
To complete this detailed study of the life cycle of the first spell, the rainfall simulation using NNRP2 with EMAN is displayed in Figure 10. Again, there is no rain over Saudi Arabia on 13 November, although a few cells develop over Sudan (Fig. 10a). On 14 November, they merge to form cloud over the west coast of the Red Sea, which further develops and becomes embedded with a small part over western Saudi Arabia on 15 November (Fig. 10c). The figure also shows that from 16 to 19 November, the system is over western Saudi Arabia producing the heavy rainfall in the region during the first spell (as discussed earlier, see Fig. 4). After 19 November, it is in a decaying stage, which completes the life cycle. Combined with the previous results derived from Figures 7, 8 and 9, it is clear that RegCM3 simulates fairly well the life cycle of the first spell. The precise location of the intense core, the embedded areas, and the time do not exactly match with the observations, however such close simulation encourages the use of the RCM for further study.
As with the first spell, the life cycle of the second spell (25-27 November) is discussed here. In Figure 11, a convective cell develops over the Red Sea near Jeddah on 24 November 1996. The cell reaches its mature stage on 25 November, producing heavy rainfall over Jeddah, which is in line with the observed rain-gauge data (see Fig. 4). This system extends into inland areas east of Jeddah before dissipating on 26 November. On that day, two more new cells develop over the Red Sea (Fig. 11c). The new system then moves northward slightly and reaches its mature stage on 27 November. Because it is somewhat far from the Jeddah area, very low rainfall was recorded on that day at the Jeddah station. The system then weakens on 28 November and almost disappears on 29 November. This is typical of the systems that occur in Saudi Arabia, and they usually last 2-3 days.
During the second spell, Jeddah received its largest rainfall amount (55 mm) on 25 November (see Fig. 4), and therefore the spatial distribution of the system, simulated with EMAN using different forcings, is shown for this date only. For all the forcings (ERA40, NNRP1 and NNRP2), the model simulates the rainfall for western Saudi Arabia (Fig. 12). However, the embedded area over the Jeddah area is large for EMAN compared to GFC (see Fig. 11b). The location of the intense core near Jeddah is more visible for NNRP1 and NNRP2, compared to ERA40 (Fig. 12). Combing the results of Figures 9 and 10, we conclude that RegCM3 is able to simulate the second spell (25-27 November 1996). However, it may be interesting to study the dynamics of such systems, including the development mechanism, in order to understand the evolution of the rainfall event in western Saudi Arabia by using an RCM. This will be documented in a further study.
In the previous section, the evolutions of the life cycles of the two simulated spells were discussed. There are no observed gridded data available for comparing the patterns of simulated rainfall spells at the daily scale. Therefore, rainfall values extracted from the simulated data are compared with the ground observations at Jeddah station.
Figure 13 displays the time sequences of the daily rainfall (mm/day) simulated by the RegCM and compared with the ground observations at Jeddah station. It is evident from Fig. 13 that during the first spell, the observed rainfall has two large peaks, 46 and 42 mm on 16 and 19 November, respectively. However, the model fails to simulate the maximum rainfall peak during the first spell. The model estimates the maximum rainfall peak (44.78 mm) on 18 November, which is slightly shifted compared to the observations. Similarly, the observation shows the rainfall peak (55 mm) on 25 November during the second spell, which coincides with the simulated maximum by the model. However, the model underestimates the rainfall amount during the second spell. Three other domains are unable to show any rainfall amounts in the Jeddah area (results are not shown). On average, the model simulates 137.06 mm rainfall in November 1996, whereas the observed record was 258.11 mm. The observed (model) rainfall amounts are 199.30 mm (83.62) and 58.80 mm (29.22) for the first and second spells, respectively. Hence, the model rainfall is underestimated by 58.04 and 50.31% for the first and second spells, respectively. The fact is that the regional model generates well the rainfall system during November 1996 (see Figs. 7-12), (8, 9, 10, 11) however, the amount of rainfall calculated by the model is underestimated. These results are consistent with Junker and Hoke (1990). The amount of over- and under-estimation of the model rainfall can be tuned through controlling the sub-grid explicit moisture scheme in the model (Davis et al., 2009), which is beyond the scope of this paper.

4. Conclusions
The RegCM3 model is employed to capitalize on its capability of simulating the life cycle of the two spells of heavy rainfall that occurred in western Saudi Arabia in November 1996. The rainfall distribution simulated by the model is compared with the ground-based observations and CMAP data. The simulation of rainfall over western Saudi Arabia depends highly on the model domain size and the domain center, and is less dependent on the model LBCs and the model CPPSs. In this study, the high resolution domain did not improve the simulation of rainfall when there is no signature of rain in the low resolution run, although it did improve the finer features of the rainfall system and enhanced the rainfall intensity. The simulated spatial rainfall distribution matches well with the gridded data for November 1996. The evolution of the life cycles of the simulated rainfall systems begin in each case with a cell generated over eastern Sudan, which moves eastward across the Red Sea, merging with new cells during its propagation. The system is in a mature stage when it reaches western Saudi Arabia, producing intense rainfall over the region before dissipating, thus completing the life cycle (this is usually 2-3 days, except for the unusual 8-day system that delivered significant rainfall between the 13 and the 20 of November 2009). It is found that EMAN CPPS produces well the life cycles of the two rainfall systems for any of the boundary forcings used. The performance of GFC is also reasonable; however GAS and KUO fail to capture these extreme rainfall events over the region, and are not recommended for case studies. In fact, more case studies are suggested for understanding the development mechanism and the use of regional climate models in application-oriented tasks. Due to the complexity of climate systems and the limited knowledge of the processes involved in climate extremes, a great deal of model development is still required.
Acknowledgements
The author would like to acknowledge the Presidency of Meteorology and Environment (PME) of Saudi Arabia for providing the rain-gauge data. The RegCM group of ESP-ICTP, Trieste, Italy is acknowledged for providing the model with LBCs.
References
Abdullah M. A. and M. Al-Mazroui, 1998. Climatological study of the southwestern region of Saudi Arabia. I. Rainfall analysis. Clim. Res. 9, 213-223. [ Links ]
Adler R. F., G. J. Huffman, A. Chang, R. Ferraro, P. Xie, J. Janowiak, B. Rudolf, U. Schneider, S. Curtis, D. Bolvin, A. Gruber, J. Susskind and P. Arkin, 2003. The Version 2 Global Precipitation Climatology Project (GPCP) Monthly Precipitation Analysis (1979-Present). J. Hydrometeor. 4,1147-1167. [ Links ]
Almazroui M., 2006. The relationships between atmospheric circulation patterns and surface climatic elements in Saudi Arabia. Ph.D. thesis, Climatic Research Unit, University of East Anglia, Norwich, UK, 433 pp. [ Links ]
Almazroui M., 2011a. Calibration of TRMM rainfall climatology over Saudi Arabia during 1998–2009. Atmos. Res. 99, 400-414. doi:10.1016/j.atmosres.2010.11.006 [ Links ]
Almazroui M., 2011b. Sensitivity of a regional climate model on the simulation of high intensity rainfall events over the Arabian Peninsula and around Jeddah (Saudi Arabia). Theor. Appl. Clim. doi: 10.1007/s00704-010-0387-3. [ Links ]
Anthes R. A., 1977. A cumulus parameterization scheme utilizing a one-dimensional cloud model. Mon. Wea. Rev. 105, 270-286. [ Links ]
Arakawa A. and W. H. Schubert, 1974. Interaction of cumulus cloud ensemble with the large-scale environment, Part I. J. Atmos. Sci. 31, 674-701. [ Links ]
Bettina B.-M., J. A. Smith, M. L. Baeck and W. Zhao, 1997. Heavy rainfall: Contrasting Two concurrent great plains thunderstorms. Wea. Forecast. 12, 785-798. [ Links ]
Davis N., J. Bowden, F. Semazzi and A. L. Xie, 2009. Customization of RegCM3 regional climate model for eastern Africa and a tropical Indian ocean domain. J. Clim. 22, 3595-3616. DOI: 10.1175/2009JCLI2388.1. [ Links ]
Dickinson R. E., R. M. Errico, F. Giorgi and G. T. Bates, 1989. A regional climate model for the western United States. Clim. Chan. 15, 383-422. [ Links ]
Dickinson R. E., A. Henderson-Sellers and P. J. Kennedy, 1993. Biosphere-atmosphere transfer scheme (BATS) version 1e as coupled to the NCAR community climate model. NCAR/TN-387+STR, NCAR, Tech. Note, 72 pp. [ Links ]
Emanuel K. A., 1991. A scheme for representing cumulus convection in large-scale models. J. Atmos. Sci. 48, 2313-2335. [ Links ]
Emanuel K. A. and M. Zivkovic-Rothman, 1999. Development and evaluation of a convection scheme for use in climate models. J. Atmos. Sci. 56, 1766-1782. [ Links ]
Fritsch J. M. and C. F. Chappell, 1980. Numerical prediction of convectively driven mesoscale pressure systems. Part I: Convective parameterization. J. Atmos. Sci. 37, 1722-1733. [ Links ]
Giorgi F. and G. T. Bates, 1989. The climatological skill of a regional model over complex terrain. Mon. Wea. Rev. 117, 2325-2347. [ Links ]
Grell G., 1993. Prognostic evaluation of assumptions used by cumulus parameterizations. Mon. Wea. Rev. 121, 764-787. [ Links ]
Grell G. A., J. Dudhia and D. R. Stauffer, 1994. Description of the fifth-generation Penn State/NCAR Mesoscale Model (MM5). Tech. Note. TN-398+STR, NCAR, Boulder, Colorado, 117 pp. [ Links ]
Holtslag A. A. M., E. I. F. de Bruijn and H-L. Pan, 1990. A high resolution air mass transformation model for short-range weather forecasting. Mon. Wea. Rev. 118, 1561-1575. [ Links ]
Junker N. W. and J. E. Hoke, 1990. An examination of nested grid model precipitation forecasts in the presence of moderate-to-strong low-level southerly inflow. Wea. Forecasting 5, 333-344. [ Links ]
Kiehl J. T., J. J. Hack, G. B. Bonan, B. A. Boville, B. P. Breigleb, D. Williamson and P. Rasch, 1996. Description of the NCAR community climate model (CCM3), Tech. Note. NCAR/TN-420+STR, Co, USA, 159 pp. [ Links ]
Leung L. R., S. J. Ghan, Z-C. Zhao, Y. Luo, W-C. Wang and H-L. Wei, 1999. Intercomparison of regional climate simulations of the 1991 summer monsoon in eastern Asia. J. Geophys. Res. 104, 6425-6454. doi:10.1029/1998JD200016. [ Links ]
Litta J., B. Chakrapani and K. Mohankumar, 2007. Mesoscale simulation of an extreme rainfall event over Mumbai, India, using a high-resolution MM5 model. Meteorol. Appl. 14, 291-295. [ Links ]
Liu S., W. Gao, M. Xu, X. Wang and X. Z. Liang, 2009. China summer precipitation simulations using an optimal ensemble of cumulus schemes. Front. Earth Sci. China 3, 48-257. doi: 10.1007/s11707-009-0022-8. [ Links ]
Liu Y. Q., F. Giorgi and W. M. Washington, 1994. Simulation of summer monsoon climate over East Asia with an NCAR regional climate model. Mon. Wea. Rev. 122, 2331-2348. [ Links ]
Pal J. S., F. Giorgi, X. Bi, N. Elguindi, F. Solmon, X. Gao, S. A. Rauscher, R. F. Ashraf, Zakey, J. Winter, M. Ashfaq, F. S. Syed, J. L. Bell, N. S. Diffenbaugh, J. Karmacharya, A. Konaré, D. Martínez, R. P. da Rocha, L. C. Sloan and A. L. Steiner, 2007. Regional Climate Modeling for the Developing World: The ICTP RegCM3 and RegCNET. B. Am. Meteor. Soc. 88, 1395-1409. doi: 10.1175/BAMS-88-9-1395. [ Links ]
Pal J., E. Small and E. Eltahir, 2000. Simulation of regional-scale water and energy budgets: Representation of subgrid cloud and precipitation processes within RegCM. J. Geophy. Res. Atmos. 105, 29579-29594. [ Links ]
Romero R., C. Ramis, S. Alonso, C. A. Doswell and D. Stensrud, 1998. Mesoscale model simulations of three heavy precipitation events in the western Mediterranean region. Mon. Wea. Rev. 126, 1859-1881. [ Links ]
Shiao C. H. and H. M. H. Juang, 2006. Sensitivity study of the climate simulation over East Asia with the CWB Regional Spectral Model. Terr. Atmos. Ocean. Sci. 17, 593-612. [ Links ]
Trapp R. J., N. S Diffenbaugh, H. E. Brooks, M. E. Baldwin, E. D. Robinson and J. S. Pal, 2007. Changes in severe thunderstorm environment frequency during the 21 century caused by anthropogenically enhanced global radiative forcing. PNAS USA 104, 19719-19723. doi: 10.1073/pnas.0705494104. [ Links ]
Xie P. and P. A. Arkin, 1997. Global precipitation: A 17-year monthly analysis based on gauge observations, satellite estimates, and numerical model outputs. B. Am. Meteor. Soc. 78, 2539-2558. [ Links ]

