


Servicios Personalizados
Revista
Articulo
 Inglés (pdf)
  Artículo en XML
 Referencias del artículo
 Enviar artículo por email
Indicadores
 Citado por SciELO
 Accesos
Links relacionados
 Similares en SciELO
Compartir

 Permalink
Atmósfera
versión impresa ISSN 0187-6236
Atmósfera vol.25 no.1 Ciudad de México ene. 2012
Emission of methane and nitrous oxide from Vigna mungo and Vigna radiata legumes in India during the dry cropping seasons
Y. V. Swamy, G. N. Nikhil, R. Venkanna
Indian Institute of Chemical Technology, Discovery Building, Tarnaka,
Uppal Road, Hyderabad 500067, India
Corresponding author: Y. V. Swamy; email: swamy_yv@yahoo.com
S. N. Das, G. Roy Chaudhury
Institute of Minerals and Material Technology, Bhubaneswar 751013, Orisa, India
Received June 18, 2011, accepted September 27, 2011
RESUMEN
Se hicieron estimaciones de la emisión de metano (CH4) y óxido nitroso (N2O) de las legumbres Vigna mungo y Vigna radiata. Para evaluar estas emisiones se estudió el potencial de óxido reducción (redox) y la temperatura del suelo. El CH4 fue negativo y el N2O positivo para Vigna mungo a lo largo de casi todo el período de cultivo. El potencial redox fue de más de +100 mV durante todo el período de cultivo con un flujo máximo de N2O de 11.67 μg m-2 h-1. El incremento de la temperatura del suelo y del potencial redox durante la cosecha incrementó aún más el flujo de N2O a 18.38 μg m-2 h-1. El flujo integrado estacional E(SIF) de CH4 y N2O para Vigna mungo se calculó en –4.06 g m-2 y 3.38 mg m-2, respectivamente. De manera simmilar los valores E(SIF) estimados para Vigna radiata durante la estación de cultivo fueron de 0.009 g m-2 y –7.6 mg m-2, mientras que para el período post cosecha fueron de 0.02 g m-2 y 4.06 mg m-2 para CH4 y N2O, respectivamente. Durante la estación de cultivo se evaluaron los parámetros del suelo carbón orgánico y nutrimentos como el amonio, nitratos y nitritos. La emisión de gases de efecto invernadero también se correlacionó con varios parámetros fisicoquímicos del suelo.
ABSTRACT
Methane (CH4) and nitrous oxide (N2O) emission estimates were made for Vigna mungo and Vigna radiata legumes. The affecting soil parameters like redox potential, soil temperature were studied to evaluate CH4 and N2O emissions. The CH4 was negative and N2O was positive for Vigna mungo, almost throughout the cropping period. The redox potential was more than +100 mV during the entire cropping period with a maximum N2O flux of 11.67 μg m-2 h-1. The raise in soil temperature and the redox potential during harvest further increased the N2O flux to 18.38 μg m-2 h-1. The seasonally integrated flux E(SIF) for CH4 and N2O for Vigna mungo was calculated to be –4.06 g.m-2 and 3.38 mg m-2 respectively. Similarly E(SIF) values estimated for Vigna radiata cropping season were 0.009 g m-2 and –7.6 mg m-2, whereas for the post harvesting period the fluxes were 0.02 g m-2 and 4.06 mg m-2 for CH4 and N2O respectively. The soil parameters like organic carbon and nutrients such as ammonia, nitrate and nitrite during the cropping season were evaluated. The emission of greenhouse gases (GHG) was also correlated to various physico-chemical parameters of soil.
Keywords: Methane, nitrous oxide, soil organic carbon, Vigna mungo, Vigna radiata, legumes.
1. Introduction
Due to rapid increase in world population, people are striving hard to produce more and more food to sustain their lives themselves. This needs high input of chemical fertilizer to increase the agricultural productivity. There is a gradual increase of GHG emission from the agricultural sector; believed to be one of the components causing global warming. Presently, N2O concentration in the atmosphere stands at 311 ppbv, which is increasing at a rate of 0.22% per year (Machida et al., 1995; Battle et al., 1996). According to the Intergovernmental Panel on Climate Change (IPCC, 1997), the global mean annual atmospheric N2O loading was 16.2 Tg in 1997, to which agricultural sector contributed about 3.3 Tg (20.4%).
Legume pulses form an essential component of the Indian daily diet. Land used for growing pulses during 1999 was estimated to be 23.8 million ha, which remained unaltered over the last three decades (Fertiliser Association of India, 2000). The total N2O emission from cultivated legumes worldwide has been estimated to be 23-315 Gg N2O-N in 1986 (Eichner, 1990).
It is important to distinguish the contribution of the various N2O sources to atmosphere, such as native soil N, N from recent atmospheric deposition, N from fertilization and N from crop residues. Atmospheric N2 fixed by the legumes is chemically bound in the plants and the plant debris gets mineralized to release inorganic N, which in turn produces N2O when nitrified. NO3– is also a product of the same process, which produces N2O via denitrification (Galbally, 1992). In addition, the rhizobia symbiotically living in root nodules are capable of denitrifying, to produce N2O (O'Hara and Daniel, 1985). Biological N2 fixation by legumes induces the availability of NH4+ in the soil to serve as a substrate for nitrification (O'Hara and Daniel, 1985; Ghosh et al., 2002). Redox potential and organic carbon were found to be favourable for N2O emission (Verma et al., 2006). Organic carbon in the soil is a source for microbial growth and biological decomposition, which is often being considered as a good index of carbon availability (Huang et al., 2004).
When the soil is more reducing, a large amount of CH4 is produced at a critical redox potential (Eh), which increases exponentially with a further decrease of Eh (Ui and Patrick, 2003). Lower CH4 fluxes were recorded in the fields with less rice residue applications, multi aeration periods, and low fertilization, which normally result in poor rice growth and low yields (Delwiche and Cicerone, 1993). Continuously flooded soils maintain anaerobic conditions that enhance CH4 production whereas reduced flooding duration increases N2O production (Neue and Roger, 1994; Cai, 1997; Chen et al., 1997; Abao et al., 2000) because of the contrasting Eh conditions required for N2O and CH4 formation. Eh of the soil affects not only the methanogesis, but also transfer of gas through the plant parenchyma (Kludze and Delaune, 1995). Higher temperature accelerates the decomposition of soil carbon due to greater activities of methanogens (Yang and Chang, 1997). Maximum CH4 emission was observed where the soil Eh varied in the range –100 to –200 mV (Wang et al., 1993).
Legume-cropped soils produce considerable amount of N2O during the plant metabolism. Unlike pulses, systematic studies are reported for rice and wheat (ALGAS, 1998; Bhattacharya and Mitra, 1998; Moiser et al., 1998; Pathak, 1999; Rath et al., 1999; Adhya et al., 2000; Kumar et al., 2000; Aulakh et al., 2002; Pathak et al., 2003; Swamy et al., 2007) for the estimation of emission factors under different water regimes. In relatively dry soils, the predominantly aerobic environment favours microbial nitrification producing mainly NO. Increased moisture regime directly or indirectly induces denitrification process by denitrifying bacteria in the partially anaerobic conditions (Davidson, 1993; Singh et al., 2003). Under strict anaerobic condition (Bremmer and Blackmer, 1978), substrate depletion through denitrification (Granli and Bockman, 1994) leads to further reduction of N2O to N2. Water is essential for microbial survival and activities. Rapid increase in soil moisture content dilutes the nutrient concentration as well as the microbial population in the water filled pore space (Weitz et al., 2000). Porous soil would drain water easily and help in retaining oxygen, thus enhancing the kinetics of N2O formation (Baruah et al., 1997). In an effort to estimate N2O emission from legumes grown on an alluvial soil, pot experiments were conducted by Gosh et al., 2002. These experiments were conducted under both fertilized and unfertilized conditions. The results indicated that legumes may lead to an increase in N2O formation and emission from soils, which may vary from crop to crop. These crops are cultivated in moist uplands which are the sources for N2O emission due to mild redox conditions.
Information on emission from legumes like Vigna mungo and Vigna radiata is scanty in literature. Hence, an attempt is made to evaluate the role of soil parameters on the emission of CH4 and N2O during dry cropping season (Rabi) in a farmer's field. The field selected is located in upland area having porous rain-fed soil which is used traditionally for cultivating rice in the Kharif season.
2. Materials and methods
2.1 Site for Vigna mungo and Vigna radiata
Field experiments were carried out in an actual farmer's field in the village Raghunathpur, situated at a distance of about 14 km from Bhubaneswar, Orissa, India. Vigna mungo (January 2004-April 2004) and Vigna radiata (January 2005-March 2005) were grown during the Rabi seasons (crop grown during the winter season and pre-summer months) in a plot measuring 25 decimals (0.10 acre). Soil samples were collected randomly at a depth of 10 cm. The physical characteristics of the soil samples are shown in Table I. Unlike paddy, pulses do not need any standing water and hence, they are grown in uplands.

Being dry crops, these were directly seeded after ploughing the field in slightly wet condition. Intermittent drizzles during the season were the only source of water for the crop. As the plants are leguminous, they fix nitrogen from atmosphere by the micro-organisms present in root nodules and emit N2O during the plant metabolism.
2.2 Analysis of soil samples
NH4+-N in the soil sample was estimated by the indo-phenol blue method (Keeny and Nelson, 1982) by extracting NH3 in 2M KCl. NO3– is estimated quantitatively by reducing to nitrite. The NO2– produced is determined by diazotization with sulfanilamide and complexing with N-(1-naphthyl)-ethylenediamine dihydrochloride to form a highly coloured azo dye complex and the absorbance was measured at 543 nm (Wood et al., 1967).
2.3 Collection of gas samples
The closed chamber technique prescribed by Hutchison and Moiser (1981) was adopted to collect the gas fluxes. A rectangular aluminium channel was inserted inside the soil to avoid any leakage of external air into the chamber and was allowed to attain equilibrium. A rectangular airtight Perspex box measuring 52 × 31.7 × 34.5 cm was fixed to the aluminium channel. The aluminium base and Perspex channel interface were made airtight by filling with water. Measurements were carried out at diagonally opposite spots in the rectangular plot measuring 0.1 acre. A battery operated pulse pump (Aerovironment Inc.) was used to circulate the air for homogeneity. The air flux samples were collected at 0, 15, 30 min intervals. A three-way stopcock was fitted at the output of the air-circulating pump to collect gas samples. The chamber temperature was noted with a thermometer inserted into the chamber. Ambient air samples were collected in the forenoon and afternoon hours to have the background levels. The gas flux samples were collected in Teflon bags, which were most convenient compared to water filled glass tubes specially designed for the purpose. Samples were collected weekly once between 8-10 am in the forenoon and 3-5 pm in the afternoon. Eight replicas were collected for each measurement, four in the morning at two diagonally opposite points of the site, four in the afternoon. These measurements were continued throughout the cropping season.
2.4 Analysis of gas samples
The flux samples were analyzed in laboratory using a Perkin-Elmer AutoSystem gas chromatograph equipped with flame ionization detector (FID) for CH4 using N2 (flow rate: 5 mL min-1), H2 (flow rate: 45 mL min-1) and zero air (flow rate: 450 mL min-1) as carrier, fuel and oxidative gases respectively. A packed semi-micro column of 0.45µm ID, 18 m length was employed to the purpose. The GC parameters fixed for CH4 analysis were: column, injector and detector temperatures were 70, 120 and 250 ºC, respectively. A secondary standard CH4 (14.2 ppmv) in zero air supplied by the National Physical Laboratory, New Delhi, was used for calibration of the instrument for each set of analysis. Primary certified standard of CH4 (6.02 ppm) in zero air was also used occasionally for calibration. N2O was estimated in Shimadzu GC 17A with ECD, using N2 as carrier gas. SupelcoQ plot capillary column (30 m × 0.53 mm ID), with auto-sampling valve fully controlled by Shimazu star software was used in the study. The column, injector and detector temperature were maintained at 70,120 and 350 oC, respectively. NIST traceable N2O in N2 primary standard (Spectra Gases, Inc.) of 5 ppm was dynamically diluted to 500 ppb was used for standardization. The minimum detection limit through dynamic dilution was found to be 90-100 ppbv. However, the range of N2O in our samples was at least three times that of the minimum detection limit. A pre-calibrated zero air cylinder (311 ppbv) was used as a standard for calculating N2O concentration. The chromatogram was recorded in a computer with TotalChrom Software. The CH4 and N2O flux were calculated (Hou et al., 2000) as per the equation below
F = ∆m/(A*∆t) = (ρ*V*Δc)/(A*Δt) = ρ*h*Δc/Δt
where F is flux, ρ is the density of gas at absolute temperature of the chamber headspace, ∆m and Δc are the mass and mixed ratio concentration of gas increased (or decreased) in the static chamber during Δt, respectively. V, A, and h are the volume of effective space, area of bottom and height of the chamber, respectively.
2.5 In -situ measurement of pH and redox potential
The in-situ pH of the soil was measured in replicates by inserting the pH electrode up to 5 cm from the ground connected to a portable pH-meter (Russell model RL 100). The combined electrode along with its protecting sheath was dipped into the soil and the reading was taken after stabilization. Prior to each set of measurement, the instrument was standardized against Orion buffer pH-7.0 and pH-4.1 (Orion Research Incorporated, Boston, certified by NIST Standard Reference Material).
The Eh-meter was specially fabricated in the laboratory to meet the field requirements. The electrodes were fabricated with a small piece of platinum wire embedded into an end of sealed glass capillary filled with mercury connected to a copper wire. A pair of such electrodes was used. The other ends of the copper wire were connected to a sensitive multimeter capable of measuring resistance in mV with an accuracy of ±0.01 mV. The probe used to measure Eh during dry period consists of a Perspex tube, with holes drilled in it to house the sensors (Austin and Huddleston, 1999) and dipped to an approximate depth of 5 cm each time. The second electrode was placed just in contact with the moist soil. The stabilized values after ~15 min of equilibrium were noted. The setup was standardized using a standard redox solution of 0.0033 M K3Fe(CN)6 and 0.0033 M K4Fe(CN)6 in 0.1M KCl which gives an Eh of 0.222 V at 25 oC.
3. Results and discussion
3.1 Emission pattern of N2O and CH4 from Vigna mungo during 2004 Rabi season
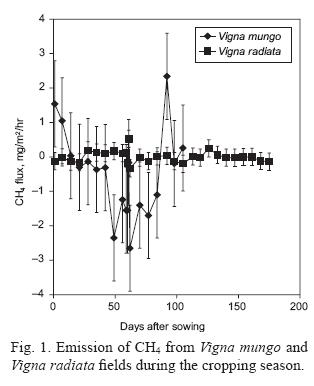
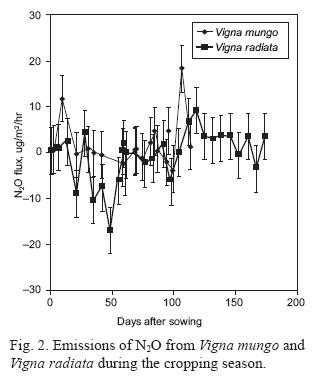
Air flux samples were collected from the Vigna mungo over 107 days (from 9-1-04 to 6-4-04). The emission pattern for both CH4 and N2O during the entire cropping season is shown in Figures 1 and 2 respectively. It is observed that CH4 flux was almost negative or negligible throughout the cropping season barring a few positive values. The overall N2O flux was positive. CH4 and N2O fluxes were almost stable from the 29th day of seeding to 88th day. N2O flux was positive but lower compared to the rice fields (Swamy et al., 2007). A slightly higher N2O emission at the time of seeding and also during harvest may be due to disturbances in the surface layer of the soil and consequent upheaval.
3.2 Role of redox potential and soil temperature on CH4 and N2O flux
The change in N4O flux with Eh and soil temperature is shown in Figure 3. It is observed that the Eh was > +100 mV throughout the cropping season except for a few observations. It was < +100 mV initially on the 36th day after sowing (DAS) to 59th day and again just before harvesting (i.e., 88 DAS and 95 DAS). The Eh range for the minimum generation of both CH4 and N2O was generally between +120 and –170 mV (Yu et al., 2001). A higher flux of 11.67 µg m-2h-1 was observed with the highest Eh of the season on the 10th DAS (150 mV). Previously, it was observed that the critical Eh in US paddy soil for denitrification was approximately + 350 mV (Patrick and Jugsu Inda, 1992).
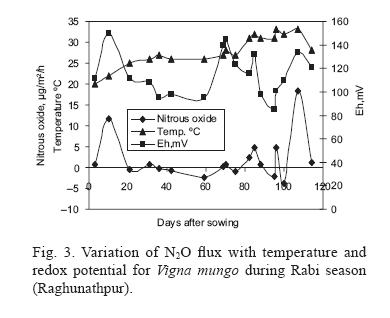
Significant N2O accumulation was also noticed at Eh values in the range +120 to +250 mV (Yu et al., 2001). It is important to understand that N2O formation depends on the origin of the soil, nitrate availability, pH and Eh status. Relationship between the soil N2O concentration and Eh suggests that the denitrification is probably the major mechanism for N2O production (Smith et al., 1983; Yu and Patrick, 2003). The maximum soil N2O concentration was found at Eh +250 mV, the boundary Eh between the ridge and the swamp (Chen et al., 1997), which is in good agreement with laboratory studies using homogeneous soils (Yu et al., 2001; Yu and Patrick, 2003). N2O flux was almost positive in all the cases when the Eh was > +100 mV. In some cases, even though the redox potential was < +100mV, the increase in soil temperature might have played a role. The highest N2O (18.38 µg m-2 h-1) emission at the time of harvest (107 DAS) may be due to combined effect of high redox potential (+134mV) and the highest temperature of the season (33 oC).
3.3 Seasonally integrated flux E (SIF) for Vigna mungo
Seasonally integrated flux E (SIF) for CH4 and N2O was calculated by taking the daily mean of the flux data and integrating the flux for the entire cropping season (107 days) by taking into consideration the background values. The E(SIF) calculated for CH4 and N2O are –4.06 g m-2 and 3.38 mg m-2 respectively. The study indicates that the total N2O emission from Vigna mungo cultivated in 3.15 million hectares (Singh and Ahlawat, 2005) in India comes out to be nearly 0.11Gg.
3.4 Emission pattern of CH4 and N2O fluxes from Vigna radiata field
Emission estimates were made for Vigna radiata during the Rabi season of 2005. The measurements were carried out over a period of 175 days including pre-seedling and post- harvesting fallow periods. The emission pattern of CH4 and N2O are represented graphically in Figures 1 and 2 respectively. Seeds were sown on 29.12.04 and the crop was harvested after 92 days (30-03-05). It is observed that during the initial stage of the plantation, i.e., up to 14 days, the N2O flux was positive, while beyond this and up to the 56th day, the flux was negative. The overall N2O flux was negative till the harvest. The post-harvest fallow period emissions were positive (Fig. 2), indicating a total reverse trend from the cropping period. This might be due to the decomposition of nitrogen bearing nodules in the root structure lying buried in soil after harvest. CH4 emissions during the same period are shown in Figure 1. It is observed from the pattern that CH4 emission is negative during the initial 21 days which is in contrast to N2O emission. Similar negative trend was observed for CH4 during the remaining cropping period.
3.5 Influence of Eh on N2O emission
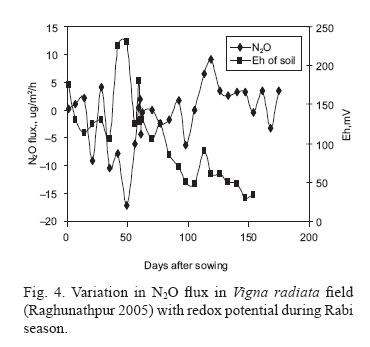
The redox potential for the Vigna radiata was in the range of +100 to 150 mV during the entire cropping season except on 42nd and 49th days after sowing (DAS). The variation of soil Eh with DAS during the entire season is shown in Figure 4. Initially, the Eh was well above 100 mV up to harvesting (92 days). But immediately after harvesting (fallow period) the N2O flux was leading to positive continuously.
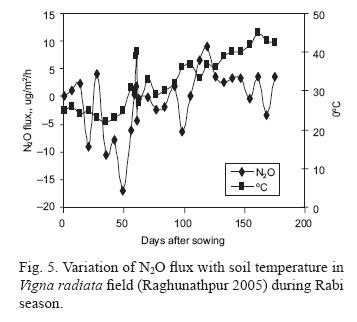
3.6 Influence of soil temperature on nitrous oxide flux
The variation in soil temperature during the cropping season and post- harvest fallow period is shown in Figure 5. The temperature varied in the range 22-32 oC during the cropping period (1-92 days) except on 60th and 61st DAS. During the fallow period, it was in the range of 36-45 ºC (Fig. 5). The temperature might be one of the factors contributing to high emission of N2O during the post-harvest fallow period. It was observed that the rate of CH4 production increased with temperature in rice paddy (Yang and Chang, 1998) with a linear relationship between 15 and 37 oC. Similarly, a linear relationship was also observed between a soil temperature and N2O-N emission from legumes in pot experiments (Gosh et al., 2002). The higher N2O emission may be due to the fast degradation of organic matter containing atmospheric N2, fixed by legumes, which gets mineralised to release inorganic N producing N2O more effectively (Galbally, 1992) with higher temperature. Sensitivity analysis showed that the temperature-soil moisture interaction is critical in the production (Cao et al., 1996) of N2O. The N2O emission was correlated statistically (Statistic XL, version 1.7) with affecting soil parameters. A significant positive correlation (r = 0.46) was observed with temperature while there is no significant correlation with CH4.
3.7 Evaluation of other soil parameters
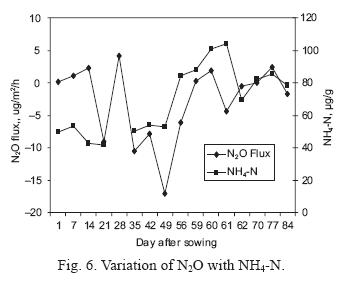
The nutrients like organic carbon, NH4+, NO3- and NO2- in the soil were evaluated continuously during the measurement period. The results obtained are shown in Table II. It is observed that the organic carbon was in the range of 0.3-0.5%. Ammonia was maximum on 60th DAS (100 μg g-1) and almost similar values were recorded during 56th to 61st DAS. This might be attributed to the generation of NH4+-N from plant roots (rhizosphere), during the flowering stage due to the metabolic activity in the plant. Ammonia values came down to 3μg g–1 during the fallow period. NO2-N was maximum (1.4 μg g-1) on 42nd and 49th DAS. The increased moisture content (4-20%) due to occasional rains might have enhanced the N2O formation as well as emissions (Skiba et al., 1996; Anderson et al., 1988). The moisture in the soil increases nodulations and N fixation and thereby increases N input by changing NH4+ and NO3- contents of the soil (Smith et al., 1982). Subsequently, it induces denitrification process driven by denitrifying bacteria in the partially anaerobic condition (Singh et al., 2003; Granli and Bockman, 1994). This might have contributed to the N2O emission beyond 61 days till the end of the harvesting season leading to decrease in NH4-N and NO3-N (Table II). During the fallow period, NO2-N content of soil was as low as 0.0003 μg g-1. Similarly, NO3-N was maximum (3.79 μg g-1) during the initial stages of plantation (up to 35 DAS). For the remaining cropping period and the post-harvest fallow period, the values are in the range of 0.1-0.6 μg g-1 (Table II). The relationship of N2O and NH4-N is shown in Figure 6. It is observed that N2O emission increased with NH4N concentration throughout the cropping period indicating mild anaerobic conditions in the soil which are favourable for N2O formation. The other soil parameters like NO2-N and NO3-N could not be correlated with N2O emission due to non-availability of sufficient data during the period.
3.8 Seasonally integrated flux E(SIF), for Vigna radiata
The E(SIF) was calculated based on the emission estimates for the cropping season and also fallow periods. The E(SIF) values estimated for CH4 and N2O during the entire cropping season are found to be 0.009 g m-2 and –7.6 mg m-2, where as for the post harvesting period, the ESIF values are 0.02 g m-2 and 4.06 mg m-2, respectively. Atmospheric N2 fixed by the legumes produces N2O by rhizobia symbiotically living in root nodules under mild, anaerobic conditions (O'Hara and Daniel, 1985). The grams (Vigna mungo and Vigna radiata) are grown as dry crops, where partial anaerobic conditions prevail in the soil. Absolute dry conditions prevailed in the Vigna radiata soil (soil moisture 1-4% and soil temperature 25-43 ºC, Fig. 5) might have supplied O2 to the micro-sites for nitrification. These prevailing aerobic conditions contributed to the nitrification with low N2O production or negative (N2O sink) during the initial period of the cropping season. The precipitation (intermittent drizzles) at the time of harvest has increased the moisture content of the soil to 18%, this might have contributed to the denitrification process to produce N2O just before the harvest (84 DAS) and also during the post harvest (fallow period). Increased moisture regime directly or indirectly induces denitrification process driven by denitrifying bacteria in the partially aerobic conditions (Singh et al., 2003). It was also observed that higher soil moisture induces N2O emission initially and then gradually declined either due to substrate depletion through denitification (Granli and Bockman, 1994) or further reduction of N2O to N2 in the strict anoxic conditions (Bremner and Blackmer, 1978). The moisture content has decreased the soil reduction potential from an initial value in the range of +100mV to + 150 mV to +30 mV (Fig. 4) during the fallow period. Hence, during the fallow period the N2O production was almost positive with reduction potential less than +100 mV. In case of Vigna mungo the reduction potential is between +100 to +150 mV (Fig. 3) with soil temperature 20-30 ºC and moisture (14-18%), generally required for growing the crop, might have supported in the production of N2O. In a subsequent study by Swamy et al., 2008, in Vigna radiata field at ICRISAT, Hyderabad, the authors reported a E(SIF) of 1.71μg m-2 for N2O. This amounts to total 0.05 Gg of N2O emissions from 2.99 million hectors (Singh and Ahlawat, 2005) of Vigna radiata cultivated in India. It confirms that legumes are the source of N2O emissions whereas soil is total sink for CH4.
4. Conclusions
CH4 and N2O emission studies were carried out on Vigna mungo and Vigna radiata during the two consecutive cropping seasons in a rain-fed upland area. The results indicated a reduction potential of around 100mV for both the crops which supported the formation of N2O. The higher soil temperature (>40 oC) enhanced the emission of both CH4 and N2O due to metabolic activity of the plant in the rhizosphere. The E(SIF) for CH4 and N2O for Vigna mungo was calculated to be –4.06 and 3.38 mg m-2, respectively. The dry condition of the soil contributed positive flux for N2O. The N2O flux for Vigna radiata was negative attributing to high soil temperature and increased moisture content due to intermittent rains, which acted as total sink for N2O. It is observed that during post harvest fallow period the N2O flux (4.06 mg m-2) was positive due to residual biomass in soil, after harvesting, with almost negligible amount of CH4.
The maximum NH4+-N content (100 μg g-1) during the flowering stage of the crop might be due to higher plant metabolism in the rhizosphere. The NO2-N content in the soil was higher (1.4 μg g-1) on 42nd and 49th DAS and lower (0.0003 μg g-1) during the fallow period. NO3-N content was at its maximum (3.79 μg g-1) during the initial stages of plantation. Correlation could not be established between NO2-N, NO3-N and N2O emission.
Acknowledgements
The authors are thankful to the Directors of Institute of Minerals and Materials Technology (IMMT), Bhubaneswar, and Indian Institute of Chemical Technology (IICT), Hyderabad, for their kind permission to publish the paper. They would also like to thank AT/CTM under ISRO-GBP for funding the programme. Thanks are also due to Dr. C.B.S Dutt, Deputy Program Director, ISRO-GBP, Prof. Syam Lal, Project Director, AT/CTM for their kind support and encouragement during the course of the studies.
References
Abao Jr., E. B., K. R. Bronson, R. Wassmann and U. Singh, 2000. Simultaneous records of methane and nitrous oxide emissions in rice-based cropping systems under rainfed conditions. Nutr. Cycl. Agroecosyst. 58, 131-139. [ Links ]
Adhya T. K., K. Bharti, S. R. Mohanty, B. Ramakrishna, V. R. Rao, N. Sethunathan and R. Wassmann, 2000. Methane emissions from rice fields at Cuttack (India). Nutr. Cycl. Agroecosyst. 58, 95-106. [ Links ]
ALGAS, 1998. National report. Asia Least-cost Greenhouse Gas Abatement Strategy. Ministry of Environment and Forest, Government of India, New Delhi, 32-40. [ Links ]
Anderson I. C., J. S. Levine, M. A. Poth and P. J. Riggan, 1988. Enhanced bionic emissions of nitric oxide and nitrous oxide following surface biomes burning. J. Geophys. Res. 93, 3893-3898. [ Links ]
Aulakh M. S., T. S. Khera, J. W. Doran and K. Bronson, 2002. Denitrification, N2O and CO2 fluxes in rice wheat cropping system as affected by crop residues, fertilizer N and legume green manure. Biol. Fertil. Soils 34, 375-389. [ Links ]
Austin W. E. and J. H. Huddleston, 1999. Viability of permanently installed platinum redox electrodes. Soil Sci. Soc. Am. J. 63, 1757-1762. [ Links ]
Baruah K. K., D. C. Parashar, P. K. Gupta, C. Sharma, M. C. Jain and A. P. Mitra, 1997. Effects of water management and rice genotypes on methane emission from paddy field. Ind. J. Radio Space Phys. 26, 77-81. [ Links ]
Battle M., M. Bender, T. Sowers, P. P. Tans, J. H. Butler, J. W. Elkins, J. T. Ellis, T. Conway, N. Zhang, P. Lang and A. D. Clarke, 1996. Atmospheric gas concentrations over the past century measured in air from firn at the south pole. Nature 383, 231-235. [ Links ]
Bhattacharya S. and A. P. Mitra, 1998. Greenhouse gas emissions in India for the base year 1990. Global Change 11, 30-39. [ Links ]
Bremner J. M., 1965. Total nitrogen. In: Methods of soil analysis: Part 2. (Agronomy 9) C. A. Black D. D. Evans, J. L. White L. E. Ensminger and F. E. Clark, Eds.). Am. Soc. Agron. Madison, WI, USA, 1149-1176. [ Links ]
Bremner J. M. and A.M. Blackmer, 1978. Nitrous oxide emission from soils during nitrification of fertilizer nitrogen. Science 199, 295-296. [ Links ]
Cai Z. C., G. X. Xing, X. Y. Yan, H. Xu, H. Tsuruta, K. Yagi, and K. Minami, 1997. Methane and nitrous oxide emissions from rice paddy fields as affected by nitrogen fertilizers and water management. Plant Soil 196, 7-14. [ Links ]
Cao M., K. Gregson, S. Marshall, J. B. Dent and O. W. Heal, 1996. Global methane emissions from rice paddies. Chemosphere 33, 879-897. [ Links ]
Chen G. X., G. H. Huang, B. Huang, K. W. Yu, J. Wu and H. Xu, 1997. Nitric oxide and methane emissions from soil plant systems. Nutr. Cycl. Agroecosyst. 49, 41-45. [ Links ]
Davidson E. A., 1993. Soil water content and the ratio of nitrous oxide to nitric oxide emitted from soil. In: Biogeochemistry of global change: Radiactively active gases. (R. S. Oremland, Ed.). Chapman and Hall, New York, 369-386. [ Links ]
Delwiche C. C. and R. J. Cicerone, 1993. Factors affecting methane production under rice. Global Biogeochem. Cycles 7, 143-156. [ Links ]
Eichner M. J., 1990. Nitrous oxide emission from fertilized soils: summary of available data. J. Environ. Qual. 19, 272-280. [ Links ]
FAI, 2000. Fertilizer statistics (1998-99), Fertilizer Association of India, New Delhi, India. [ Links ]
Galbally I. E., 1992. Biosphere-atmosphere exchange of trace gases over Australia. In: Australia's renewable resources: Sustainability and global change (Gifford RM, Barson MM, Eds.). Bureau of Rural Resources, Canberra, 117-149. [ Links ]
Ghosh S., D. Majumdar and M. C. Jain, 2002. Nitrous oxide emissions from kharif and rabi legumes grown on an alluvial soil. Biol. Fertil. Soils 35, 473-478. [ Links ]
Granli T. and O. C. Bockman, 1994. Nitrous oxide from agriculture. Nor. J. Agric. Sci. 12 (Suppl.): 1-128. [ Links ]
Hou A. X., G. X. Chen, Z. P. Wang, O. Van Cleemput and W. H. Patrick Jr., 2000. Methane and nitrous oxide emissions from a rice field in relation to soil redox and microbiological process. Soil Sci. Soc. Am. J. 64, 2180-2186. [ Links ]
Huang Y., J. Zou, X. Zheng, Y. Wang and X. Xu, 2004. Nitrous oxide emissions as influenced by amendments of plant residues with different C: N ratio. Soil Biol. Biochem. 36, 973-981. [ Links ]
Hutchison G. L. and A. R. Moiser, 1981. Improved soil cover method for field measurement of nitrous oxide fluxes. Soil Sci. Soc. Am. J. 45, 311-316. [ Links ]
IPCC, 1997. Intergovernmental Panel on Climate Change. Guidelines for National Greenhouse Gas Inventories. OECD, Chapter 4, Paris, France, 59 pp. [ Links ]
Jackson M. L., 1967. Soil chemical analysis. Prentice Hall of India, New Delhi, India, 205 pp. [ Links ]
Keeny D. R. and D. W. Nelson, 1982. Nitrogen-inorganic forms. In: Methods of soil analysis. Part 2. Chemical and microbiological properties (A. L. Page, R. H. Miller and D. R. Keeny, Eds.). 2a ed. Soil Sci. Soc. Am. WI, 643-698. [ Links ]
Kludze H. K. and R. D. Delaune, 1995. Straw application effects on methane and oxygen exchange and growth in rice. Soil Sci. Soc. Am. J. 59, 824-830. [ Links ]
Kumar U., M. C. Jain, S. Kumar, H. Pathak and D. Majumdar, 2000. Effects of moisture levels and nitrification inhibitors on N2O emission from fertilized alluvial clay loam soil. Curr. Sci. 79, 224-228. [ Links ]
Machida T., T. Nakazawa, S. Fujii Yaola and O. Watanabe, 1995. Increase in the atmospheric nitrous oxide concentration during the last 250 years. Geophys. Res. Lett. 22, 2921-2924. [ Links ]
Mishra R. D. and M. Ahmed, 1987. Manual on irrigation agronomy. Oxford and IBH, Publishing Co. Pvt., New Delhi, India, 412 pp. [ Links ]
Moiser A. R., J. M. Duxbury, J. R. Freney, O. Heinemeyer and K. Minami, 1998. Assessing and mitigating N2O emissions from agricultural soils. Clim. Change 40, 7-38. [ Links ]
Neue H. U. and P. A. Roger, 1994. Potential of methane emission in major rice ecologies. In: Climate biosphere interaction (R. G. Zepp, Ed.). John Wiley and Sons, New York, 65-93. [ Links ]
O'Hara G. W. and P. M. Daniel, 1985. Rhizobial denitrification:a review. Soil Boil. Biochem. 17, 1-9. [ Links ]
Pathak H, 1999. Emissions of nitrous oxide from soils. Curr. Sci. 77, 359-369. [ Links ]
Pathak H., Shiv Prasad, A. Bhatia, S. Singh, S. Kumar, M. C. Jain and U. Kumar, 2003. Emission of methane from rice wheat systems of Indo-Gangetic plains of India. Agric. Ecosyst. Environ. 97, 309-316. [ Links ]
Patrick Jr. W. H. and A. Jugsujinda, 1992. Sequential reduction and oxidation of inorganic nitrogen, manganese and iron in flooded soil. Soil Sci. Soc. Am. J. 56, 1071-1073. [ Links ]
Piper C. S., 1967. Soil and plant analysis. Asia Publishing House, Bombay, 369 pp. [ Links ]
Rath A. K., S. R. Mohanty, S. Mishra, S. Kumaraswamy, B. Ramakrishna, and N. Sethunathan, 1999. Methane production in unamended and rice –straw-amended soil at different moisture levels. Biol. Fertil. Soils 28, 145-149. [ Links ]
Singh S. N., A. Verma and L. Tyagi, 2003. Biogenic emission of GHGs from agricultural fields. Physiol. Mol. Biol. Plants 9, 63-73. [ Links ]
Singh D. P. and I. P. S. Ahlawat, 2005. Greengram (Vigna radiata) and black gram (V. mungo) improvement in India: past, present and future aspects, Indian J. Agric. Sci. 75, 243-250. [ Links ]
Skiba U., K. J. Hargreaves, I. J. Beverland, D. H. O'Neill, D. Fowler and J. B. Moncrieff, 1996. Measurement of field scale N2O emission fluxes from a wheat crop using micrometeorological techniques. Plant Soil 181, 139-144. [ Links ]
Smith C. J., M. Bradon and W. H. Patrick Jr., 1982. Nitrous oxide emission following urea N-fertilization of wet land rice. Soil Sci. Plant Nutr. 28, 161-171. [ Links ]
Smith C. J., M. F. Wright and W. H. Patrick Jr., 1983. The effect of soil redox potential and pH on the reduction and production of nitrous oxide. J. Environ. Qual. 12, 186-188. [ Links ]
Swamy Y. V., S. N. Das, Ruby Das and P. K. Behera, 2007. Assessment of methane from agricultural field during the entire paddy cropping seasons- a case study. Toxicol. Environ. Chem. 89, 269-280. [ Links ]
Swamy Y. V., P. N Sarma, S. V. Ramanaiah and M. Ramakrishna, 2008. Studies on emission of nitrous oxide flux from moist uplands of Orissa, Report No. T/ES/679/Sep/2008 submitted by IMMT, Bhubaneswar, page37. [ Links ]
Ui L. and W. H. Patrick Jr., 2003. Redox range with minimum nitrous oxide and methane production in a rise soil under different pH. Soil Sci. Soc. Am. J. 67, 1952-1958. [ Links ]
Verma A., Larisha Tyagi, Sumit Yadav and S. N. Singh, 2006. Temporal changes in N2O efflux from cropped and fallow agricultural fields. Agric. Ecosyst. Environ. 116, 209-215. [ Links ]
Walkley A. and I. A. A. Black, 1947. A critical examination of a rapid method for determining organic carbon in soil: effect of variation in digestion and inorganic soil constituents. Soil Sci. 62, 251-257. [ Links ]
Wang Z. P., R. D. Delanne, P. H. Masschelevn and W. H. Patrick, 1993. Soil redox and pH effect on methane production in a flooded rice soil, Soil Sci. Soc. Am. J. 57, 382-385. [ Links ]
Weitz A. M., E. Linder, S. Frolking, P. M. Crill and M. Keller, 2000. N2O emissions from humid tropical agricultural soils: effects of soil moisture, texture and nitrogen availability. Soil Biol. Biochem. 33, 1077-1093. [ Links ]
Wood E. D., F. A. J. Armstrong and F. A. Richards, 1967. Determination of nitrate in sea water by cadmium-copper reduction to nitrite. J. Mar. Biol. Assoc. UK. 47, 23-31. [ Links ]
Yang S. S. and E. H. Chang, 1997. Effect of fertilizer application on methane emission in the paddy soils of Taiwan. Biol. Fertil. Soils 25, 245-251. [ Links ]
Yang S. S. and H.L. Chang, 1998. Effect of environmental conditions on methane production and emission from paddy soil. Agri. Ecosyst. Environ. 69, 69-80. [ Links ]
Yu K. W., Z. P. Wang, A. Vermoesen, W. H. Patrick Jr. and O. Van Cleemput, 2001. Nitrous oxide and methane emissions from different soil suspensions: effect of soil redox status. Biol. Fertil. Soils 34, 25-30. [ Links ]
Yu K.W. and W.H. Patrick Jr., 2003. Redox range with minimum nitrous oxide and methane production in a rice soil under different pH. Soil Sci. Soc. Am. J. 67, 1952-1958. [ Links ]

