


Servicios Personalizados
Revista
Articulo
 Inglés (pdf)
  Artículo en XML
 Referencias del artículo
 Enviar artículo por email
Indicadores
 Citado por SciELO
 Accesos
Links relacionados
 Similares en SciELO
Compartir

 Permalink
Atmósfera
versión impresa ISSN 0187-6236
Atmósfera vol.25 no.1 Ciudad de México ene. 2012
Evaluation of long-term NDVI time series derived from Landsat data through blending with MODIS data
D. Singh
Department of Science and Technology, Technology Bhawan, New Mehrauli RoadNew Delhi-110016, India
e-mail: ds.chahar@nic.in
Received February 28, 2011; accepted September 28, 2011
RESUMEN
El objetivo de este estudio es capitalizar el detalle espacial del Landsat y la regularidad temporal de las adquisiciones de MODIS utilizando una aproximación de fusión (Spatial and Temporal Adaptive Reflectance Fusion Model, STARFM). Específicamente, se pronosticó la reflectancia de superficie de 30 m del Landsat-7 Enhanced Thematic mapper plus (ETM+) para un período de ocho años (2002-2009) como el producto de la reflectancia observada de superficie (MOD09Q1) ETM+ y MODIS sobre los datos ETM+ observados y pronosticados. El análisis de pixeles de los datos ETM+ observados de las estaciones de cultivo de invierno y verano mostró que el método de predicción fue más preciso para el infrarrojo cercano (NIR, por sus siglas en inglés) (media r2 = 0.87, p ≤ 0.01) en comparación con la banda del rojo ( media r2 = 0.65, p ≤ 0.01). Se calculó el índice de vegetación en diferencias normalizadas (NDVI, por sus siglas en inglés) de la reflectancia Landsat observada y pronosticada. Se comparó la diferencia entre el NDVI de los datos ETM+ observados y pronosticados (predicción residual) y los residuales temporales de los datos Landsat y MODIS en dos fechas diferentes. Se encontró que que los residuales pronosticados para el NDVI (valor de la media espacial 0.0085) fueron significativamente menores que los residuales temporales (valor de la media espacial para MODIS 0.056 y 0.051 para ETM+ observados) lo que implica que el método de predicción fue mejor que la sustitución temporal de pixeles. Al investigar la tendencia de los valores sintéticos ETM+ del NDVI durante una estación de crecimiento se descubrió que los patrones fenológicos son bien capturados. La comparación directa entre los valores del NDVI obtenidos de MODIS y de imágenes sintéticas ETM+ muestra buena consistencia de la dinámica temporal pero también un error sistemático que puede ser leído como un sesgo (sobre estimación del NDVI MODIS). También se estudió la relación entre el NDVI ETM+ sintético y los datos de precipitación observada y de evaporación y se observó que la precipitación mensual total y la evaporación mensual del mes precedente tiene coeficientes de correlación mayores ( r2 = 0.56 y r2 = 0.59) que la media mensual del NDVI ETM+ sintética.
ABSTRACT
The aim of this study is to capitalize on the spatial detail of Landsat and the temporal regularity of MODIS acquisitions using a fusion approach (Spatial and Temporal Adaptive Reflectance Fusion Model, STARFM). Specifically, the 30 m Landsat-7 ETM+ (Enhanced Thematic Mapper plus) surface reflectance was predicted for a period of eight years (2002-2009) as the product of observed ETM+ and MODIS surface reflectance (MOD09Q1) on the predicted and observed ETM+ dates. A pixel based analysis for observed ETM+ dates covering winter and summer crop seasons showed that the prediction method was more accurate for NIR (mean r2 = 0.87, p ≤ 0.01) compared to red band (mean r2 = 0.65; p ≤ 0.01). The NDVI was computed from observed Landsat and predicted surface reflectance. The difference between NDVI from predicted and observed ETM+ data (prediction residual) was compared with the temporal residuals of NDVI from observed Landsat and MODIS data at two different dates. The prediction residuals for NDVI (spatial mean value of 0.0085) were found to be significantly lower than the temporal residuals (spatial mean value of 0.056 for MODIS and 0.051 for observed ETM+) implying that the prediction method was better than temporal pixel substitution. Investigating the trend in synthetic ETM+ NDVI values over a growing season revealed that phenological patterns were well captured. A direct comparison between the NDVI values obtained from MODIS and synthetic ETM+ images has shown a good consistency of the temporal dynamics but a systematic error that can be read as bias (MODIS NDVI over estimation). The relationship between synthetic ETM+ NDVI with observed precipitation and evaporation data was also studied and it was observed that monthly total precipitation and monthly evaporation of the preceding month have higher correlation coefficients (r2 = 0.56 and r2 = 0.59) with mean monthly synthetic ETM+ NDVI.
Keywords: Landsat, modis, blending, NDVI, precipitation, evaporation.
1. Introduction
Accurate and timely information on the location and area of major crop types has significant economic, food, policy, and environmental implications. While all dimensions of remotely sensed data are relevant, for practical purposes it is the temporal information that has been most useful for monitoring of major crop types with remote sensing (Smith and Ramey, 1982; Badhwar, 1984; Hall and Badhwar, 1987; Price et al., 1997; Wardlow et al., 2007). At any point during the growing season, crops are at different stages of maturity, and these stages are manifested as differential levels of spectral reflectance in remotely sensed signals, thereby building a crop-specific temporal record. Hence, by monitoring spectral indices that are sensitive to vegetation cover over time, it is possible to distinguish crops and other land-cover types. Despite the availability of long term satellite observations, temporal monitoring of crop types and crop health has not been widely operational for crop acreage assessment. Two reasons contribute to this absence. First, the spatial detail comes at the cost of reduced temporal availability: due to predetermined acquisition strategies and obstructions by clouds, only a few medium or high spatial resolution images are usually available during critical growing periods. Even if the necessary image data were available, the increased number of datasets makes the cost prohibitive for operational applications. Second, lower spatial resolution data such as Moderate Resolution Imaging Spectroradiometer (MODIS) provide extensive coverage at continental and global scales, but lack the ability to reveal specific details on the fields of interest. Thus many of the pixels generated by coarse resolution sensors are not characteristic of any one crop but relate to a mixture.
The potential solution to provide more frequent high resolution surface observations is to fuse Landsat observations with data from other remote sensing systems, such as MODIS. The MODIS instrument offers new possibilities for large area crop mapping by providing a near-daily global coverage of science-quality, intermediate resolution (250 m) data since February 2000 at no cost to the end user (Justice and Townshend, 2002). The Terra platform crosses the equator at about 10:30 A.M. local solar time, roughly 30 min later than Landsat-7 ETM+. Their orbital parameters are equal, and as such the viewing (near-nadir) and solar geometries are close to those of the corresponding Landsat acquisition. The Terra/Aqua MODIS provides frequent coarse-resolution observations, revisiting the globe once to twice per day. The MODIS observations include 250-m spatial resolution for red (band 1) and near-infrared (NIR) (band 2) wavebands and 500-m spatial resolution for other five MODIS land bands (band 3-7). The MODIS land bands have corresponding bandwidths to the Landsat ETM+ sensor except their bandwidths are narrower than ETM+.
Landsat fusion is not straightforward however because the radiometric consistency of Landsat data may change spatially and temporally, due to atmospheric and phenological variations, differences in illumination and observation angles, cloud and shadow contamination, and sensor calibration changes (Coppin et al., 2004; Song and Woodcock, 2003). Many studies have been carried out on fusion of two different satellite data (Carper et al., 1990; Shettigara, 1992; Acerbi et al., 2006). The recent fusion studies based on Landsat and MODIS data of 500 m 16-day MODIS have been carried out to monitor forest cover on a 8-day basis (Roy et al., 2008; Hansen et al., 2008; Hilker et al., 2009). The current Landsat and Terra satellites are in the same polar orbit, with Landsat ETM+ observations occurring approximately 15 min before MODIS Terra nadir observations. Recognizing the complementary aspects of these systems, Gao et al. (2006) developed an empirical fusion technique, the spatial and temporal adaptive reflectance fusion model (STARFM), to combine 30 m Landsat ETM+ data with daily 500 m MODIS reflectance data. STARFM predicts changes in reflectance at Landsat's spatial and spectral resolution using high temporal frequency observations from MODIS. STARFM predicts reflectance at up to daily time steps, depending on the availability of MODIS data.
The objective of this study was to investigate the suitability of the prediction algorithm for generating synthetic (predicted) ETM+ surface reflectance for near-infrared (NIR) and red bands and derivation of NDVI using these synthetic surface reflectances. The assessment of the quality of the synthetic ETM+ reflectance by comparing these predictions with surface reflectance values from observed ETM+ images acquired through out two growing seasons over a period of eight years (2002-2009). To generate the NDVI time series from synthetic ETM+ data for the assessment of seasonal changes (i.e. changes due to vegetation green-up and leaf senescence) in vegetation cover and vegetation status over the study site, for which the potential of acquiring frequent higher spatial resolution data (and therefore the potential for mapping of vegetation dynamics) is otherwise low. Finally, the relationship between NDVI from synthetic ETM+ data with precipitation and evaporation for its potential use in hydrological applications are investigated.
2. Methods
2.1 Study area
The study area is Mawana subdivision of Meerut district of Uttar Pradesh state depicted by the red polygon shown in Figure 1, covering an area of about 1250 km2. The land cover is predominantly cropland with scattered trees and bushes. This area is about 75 km from the national capital Delhi. The study area was chosen mainly because of three important factors (1) The identified location represents the agroclimatic conditions of a large part of northern India, where sugarcane occupies around 2 million ha and rice-wheat is grown in about 10 million ha. This area comes under Indo-Gangetic plains, where applications of organic matters in soil have gone down drastically resulting in decline of crop productivity, (2) The availability of continuous satellite data as the study site lies at the middle of tiles where Landsat-7 ETM+ has no missing lines due to SLC off, (3) The availability of continuous observed meteorological parameters like temperature, rainfall, evaporation and wind over a period of 15 years (1995-2009) over the study site.
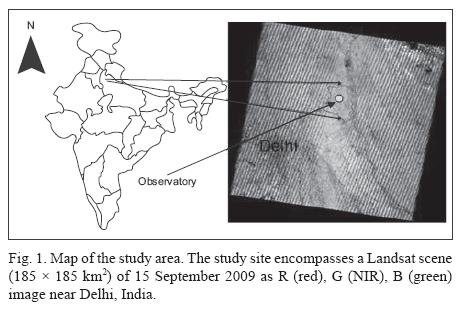
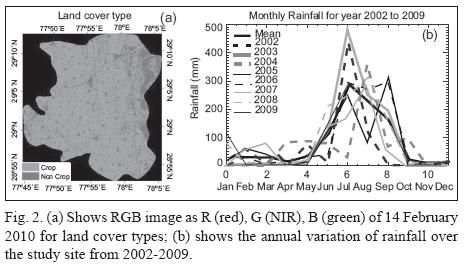
Figure 2a shows the RGB with R (red), G (NIR), and B (green) bands of Landsat-7 ETM+ image of 15 September 2009 to have an idea about the land cover type of study site. There are basically two types of land cover found in the RGB (Fig. 2a), namely crop and non crop land cover types. The pink color shows non cropland, the Ganges river in the eastern part of region and villages in the image while the green colour shows the crop land cover. The maximum temperature in the region is about 45 ºC in summer while minimum is about 5 ºC in winter. The region receives approximately 950 mm of rainfall during the year. Out of that, about 90% of the rain occurs in the monsoon months i.e. July to middle of September (Fig. 2b). The average depth of the water table is 6.0 m in the study area. The soil characteristics vary in the study area from sandy loam in the western part of the area to highly clay loam in the eastern part of the area in Khadar of the river Ganges.
2.2 Satellite data
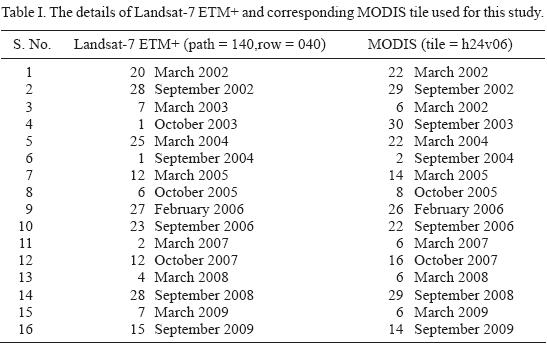
Two pairs of contemporary images, acquired by the sensors Terra-MODIS and Landsat-7 ETM+, respectively, were used in the present study. The eight days MODIS composites (MOD09Q1) of surface reflectances (NIR and red) with a spatial resolution of 250 m for eight years (2002-2009) were obtained from the EOS data gateway of NASA's Goddard Space Flight Center (http://redhook.gsfc.nasa.gov). Landsat-7 ETM+ orthorectified images (path 146, row 040) were acquired through the USGS GLOVIS portal (http://glovis.usgs.gov/) for the same period. The details of Landsat-7 ETM+ and corresponding MODIS tiles used in this study are given in Table I.
Precise registration and orthorectification of remote sensing images are the basic processes for quantitative remote sensing applications, especially for multi-temporal image analysis. Image registration is often very time-consuming, sometimes taking months to collect an adequate number of ground control points (GCPs). Many methods have been and continue to be developed for automatic or semi-automatic image registration (Hanaizumi and Fujimura, 1993; Dare and Dowman, 2000; Zhang and Zhang, 2001; Ali and Clausi, 2002; Bentoutou et al., 2005). These methods describe algorithms and functional forms rather than the use of particular software. Therefore, implementation of these methods will be difficult to end users. This work took advantage of a free application called ITPFIND (Kennedy and Cohen, 2003) that automatically finds image reference points for image rectification, in order to produce accurately registered images in a relatively short amount of time operationalized in IDL (ITT Visual Information Solutions, Boulder CO). Subsequently, image to image registration was carried out from these points using the ENVI software package.
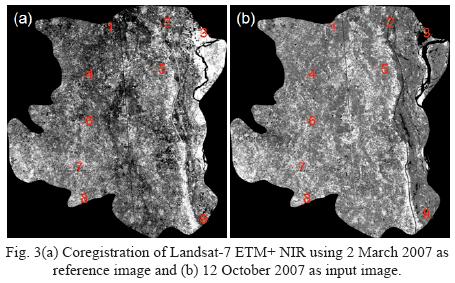
Image registration is the process of making an image conform to another image and involves georeferencing if the reference image is already rectified to a particular map projection. Thus image to image registration is usually used for time series data like multi-temporal images over the same region in order to place the same coordinate system to disparate images. The Landsat-7 ETM+ image was manually corrected using ground control points (GCPs) and thereafter it was considered as reference image for image to image registration of all the remaining images as given in Table I. For example, Figure 3(a and b) shows the Landsat-7 ETM+ image on 2 March 2007 as reference image and 12 October 2007 as input image. Table II provides the predicted x, et al. coordinates for the selected warp, the x and et al. error, and the Root Mean Square (RMS) error after the selection of at least four GCPs from GCP list. However, it is better to select sufficient number of GCPs to conduct a first-degree polynomial warp and calculate the total error and the RMS error for each point. The RMS error is minimized by refining the positions of the pixels with the largest errors or by removing them. If only few GCPs are available, place them near the image corners or widely scatter them throughout the image (Fig. 3). For rectification, first order polynomial transformation equations were derived and a bilinear interpolation resampling method was used to determine the pixel values of the new rectified image with a size of 30 by 30 m. The total RMS error of the registered images was 0.68 pixel, which was quite low to accept the RMS error limit required for the fusion of satellite data.
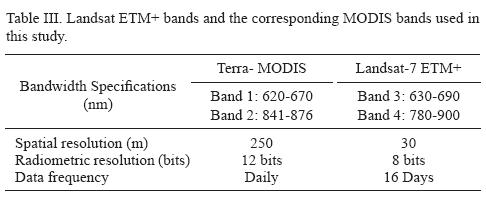
The radiometric and atmospheric corrections were applied to Landsat-7 ETM+ scenes. The equations and parameters to convert calibrated Digital Numbers (DNs) to physical units, such as at-sensor radiance or TOA reflectance utilized in this study are from the previous studies (Chander and Markham, 2003; Chander et al., 2007; Markham et al., 2004). Images were atmospherically corrected using the Quick Atmospheric Correction (QUAC) module (Bernstein et al., 2005) of environment for visualizing images (ENVI) processing package. Following STARFM algorithm input requirements, the MODIS data were reprojected to the geographical projection using the MODIS reprojection tool (Kalvelage and Willems, 2005), clipped to the extent of the available Landsat imagery, and resampled to a 30 m spatial resolution with nearest-neighbor resampling to maintain the MODIS pixel values and 30 m output pixel dimensions to reduce nearest-neighbor resampling pixel shifts (i.e., position errors) (Roy and Dikshit, 1994). These datasets were forced to assume the same size in order to make the results comparable. The basic features of the two sets of data are given in Table III.
3. Results
3.1 Evaluation of synthetic ETM+ imagery
The spatial and temporal adaptive reflectance fusion model (STARFM) developed by Gao et al. (2006) predicts pixel values based upon a spatially weighted difference computed between the ETM+ and the MODIS scenes acquired at date T1, and the ETM+ T1-scene and one or more MODIS scenes of prediction day (T2), respectively. The input pairing (T1) criteria for the prediction of synthetic ETM+ (T2) was based on least amount of cloud cover (almost 0%) and minimal temporal difference in order to reduce the likelihood for changes in land cover resulting from harvesting or phenological changes. The input pairs (T1) used in this study are given in Table I. The study area comprises winter and summer crops. Generally, late February or early March is the peak time (middle of season) for winter and September or October are peak time for summer crops. The algorithm yielded 46 (eight days composites) high spatial resolution, synthetic ETM+ images for the growing seasons (December to April for winter crop and May to December for summer crop) using an ETM+, for example MODIS scene acquired on 4 March 2008 and 28 September 2008 as the T1 images, and eight day MODIS composites between January to December 2008 as the T2 images for prediction (Table I). Also, the validation was not done for June, July and August months because of non availability of cloud free observed ETM+ images and also excluding input image pairs (Table I).
Figures 4(a-f) and 5(a-f) show a per-pixel comparison between observed and predicted ETM+ NIR, and red surface reflectance for the winter and summer crops. The first row shows the scatter plots for NIR band and second row for red band. The relationship between observed and predicted pixel values closely followed the 1-to-1 line for the NIR compared to that of red reflectance (Figs. 4(a-f) and 5(a-f)). Some deviations from this 1-to-1 line, however, were found for the NIR towards the end of the summer crops period (Fig. 5(a)) and during the month of December when harvesting of sugarcane progresses (Fig. 5(c)). The harvesting of summer crops (sugarcane) and simultaneously sowing of winter crops (wheat) during the month of December creates a complex mixture of land cover type, as a result the scatter plots (Figs. 5a and 5c) are bit noisy and also the coefficients of determination are also relatively low (r2 = 0.87 and r2 = 0.82). The ability of 30 m resolution synthetic ETM+ images for the predictability of changes depends upon the capacity of MODIS to detect these changes, particularly when they occur in vegetation structure or stand composition or at sub-pixel ranges (Gao et al., 2006). Complex mixtures of land cover type are a challenge for all methods of data fusion. Therefore, it will be difficult to identify or spatially define individual change events as it is not possible to depict changes occurring in the sub-MODIS pixel range. As a result, the algorithm in its current form seems less suited for the prediction of changes in vegetation structure (such as originating from clear cut harvesting or thinning) or changes in land cover. Changes will also not be detected by STARFM when two contradicting changes occur within a coarse resolution pixel simultaneously and compensate for each other (Gao et al., 2006).
The validation of synthetic ETM+ with observed ETM+ has been carried out for the images which are not used as input pairs (T1) in this study as given in Table I. Therefore, it may be stated that regression analysis was carried out on two independent set of observations. The validation was carried out for winter and summer crops for all the eight years and statistical results are given in Table IV. The first column in each sub-table shows the coefficient of determination, the second column shows the intercept and the third column shows the slope of the relationship between observed and predicted. A two-sided t-test was used to determine whether there is a statistically significant difference between observed and predicted surface reflectance. Table IV shows the reasonably consistency in the results for all the eight years (2002-2009) with different dates of input pairs from year to year. The highest correlations between observed and predicted pixel values were found for the NIR band (0.76 ≤ r2 ≤ 0.92, p ≤ 0.01), while the red band yielded slightly weaker relationships (0.64 ≤ r2 ≤ 0.69, p≤ 0.01) (Table IV). In most of the cases the intercepts of the relationship between observed and predicted images were greater than zero (Table IV) which can be interpreted as a noise signal likely due to atmospheric and BRDF effects. These findings are also confirmed by previous studies (Gao et al., 2006; Hilker et al, 2009).
The spatio-temporal variation of the NDVI is illustrated in Figure 6 over the study area. The absolute difference of NDVI values (temporal residuals) from MODIS data on 28 September 2008 (Part a) and 15 October 2008 (Fig. 6b), and observed ETM+ data on 28 September 2008 (Part 6d) and 14 October 2008 (Part 6e) were computed and shown in Figure 6 (c and f), respectively. Similarly, the prediction residuals were computed from the absolute difference of NDVI values from synthetic ETM+ data on 15 October 2008 and observed ETM+ data on 14 October 2008 (Fig. 6(i)). Close examination of the NDVI derived from predicted ETM+ data reveals a faint blocky pattern that corresponds spatially to the locations of the resampled 250 m MODIS pixel dimensions. This pattern is most evident across some of the fields (Fig. 6g). This is due to the fact that the dynamics of surface reflectance is different between one field and its neighbor (e.g., due to harvesting in one field and not in an adjacent field), underlying the fact that the method is less likely to be valid where the Landsat reflectance heterogeneity at the sub-MODIS pixel scale changes temporally. The NDVI from observed ETM+ data for 28 September (Fig. 6d) is higher than the 14 October 2008 (Fig. 6e) with many fields harvested by the later acquisition date. Despite the evident land cover change complexity, the NDVI from predicted ETM+ data on 15 October 2008 captures many of the temporal changes (Fig. 6g). In general, the prediction residuals (spatial mean value of NDVI was 0.0085) was considerably lower than the temporal residuals (spatial mean value of NDVI from MODIS was 0.056 and predicted Landsat was 0.051) that correspond to 25 and 9% of mean observed values of NDVI (0.502 from observed Landsat and 0.527 from MODIS) on 14 and 15 October 2008, implying that the prediction method was on an average better than temporal pixel substitution. However, prediction residuals were also found to be higher than the temporal residuals at a few locations. The higher prediction residuals may be due to regions of textural change in addition to misregistration and resampling impacts that are greatest in regions of high spatial variation (Roy, 2000).
3.2 Evaluation of NDVI time series
The majority of ETM+ images used for the prediction of NIR and red surface reflectances were close to 100% cloud free. However, the NDVI calculated using predicted ETM+ NIR and red surface reflectances still include some contaminated pixels. There are many complications, limitations and causes of error associated with satellite data, including sensor resolution and calibration (Vermote and Kaufmann, 1995), digital quantization errors (Viovy et al., 1992), ground and atmospheric conditions (Tanre et al., 1992), and orbital and sensor degradation (Kaufmann et al., 2000). NDVI data sets are generally well-documented, quality-controlled data sources that have been pre-processed to reduce many of these problems (James and Kallmi, 1994; Smith et al., 1997; Tucker et al., 2005). However, some noise is still present in the downloadable data sets and, therefore, NDVI time-series need to be smoothed before being used. Therefore, Savitzky-Golay (1964) filtering technique was used in order to remove the noise from NDVI time series. This technique was applied to smooth every pixel's time series profile for eight year (2002-2009) period.
The scatter plots of synthetic ETM+ with observed ETM+ NDVI and the MODIS NDVI data from the nearest composite period are shown in Figures 7a and b, respectively. The observed ETM+ NDVI values close to 100% cloud free thus provide a reference value for the comparison of synthetic ETM+ and MODIS NDVI values. The total number observed ETM+ scenes used for this study was 58 over a period of eight years (2002-2009). The regression analysis between observed and synthetic ETM+ NDVI (Fig. 7a) carried out at 30 m spatial resolution while for MODIS NDVI (Fig. 7(b)), the synthetic ETM+ NDVI was resampled to 250 m spatial resolution. The mean value of closest synthetic ETM+ NDVI over the study area corresponding to observed ETM+ NDVI was used for the regression analysis. A strong linear relation exists between MODIS, observed and synthetic ETM+ NDVI (Fig. 7(a) and 7(b)) but with different regression coefficients, because of MODIS tendency to overestimate NDVI (Hwang et al., 2008). A good agreement (r2 = 0.86, p ≤ 0.01) was observed between observed and synthetic ETM+ NDVI (Fig. 6a) compared to MODIS and synthetic ETM+ NDVI (r2 = 0.63, p ≤ 0.01). The rms errors from predicted and observed Landsat data derived NDVI were found to be 0.042 to 0.046 over a period of eight years (2002-2009). The later result showed that a significant amount of information is lost in case of MODIS medium spatial resolution compared to the ETM+ NDVI.
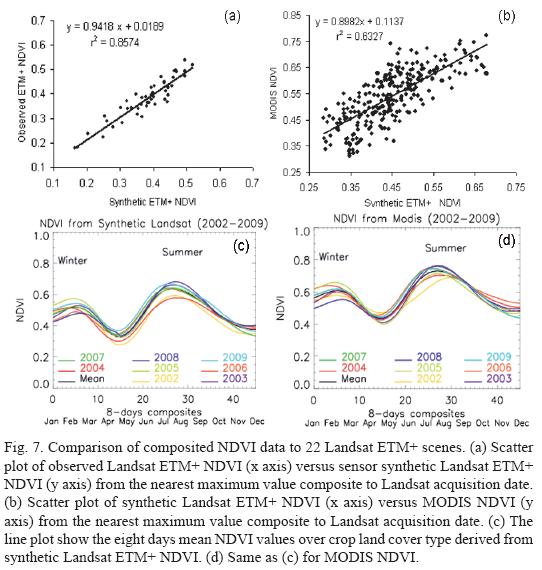
The results of the intercomparisons of the NDVI time series from synthetic ETM+ and MODIS are presented in Figure 7(c) and 7(d), respectively. The synthetic ETM+ NDVI time series was generated at 30 m spatial resolution by taking the mean of synthetic ETM+ NDVI (Fig. 6(c)) over study area for 46 weeks (8-days composites) for eight years period (2002-2009). Similarly for MODIS NDVI (Fig. 7(d)) time series also but for 250 m spatial resolution. The first maximum corresponds to winter crops (wheat) while the second one corresponds to summer crops (sugarcane) in each year. All the curves of NDVI for the years from 2002 to 2009 show distinctive seasonal dynamics. It may be observed that vegetation green-up and leaf-down at the beginning and at the end of the vegetation period were well captured by the synthetic ETM+ NDVI (Fig. 7 (c)) and MODIS NDVI (Fig. 7 (d)). The NDVI time series by and large represent crops, since only a small area of scattered trees and bushes are present over the study site. The NDVI values are maximum around week 8 (winter crops) followed by a second peak around week 38 (summer crops). The mean synthetic ETM+ NDVI value of first maximum (0.52) is found to be smaller than the second maximum (0.62). These peaks represent winter crops of low productivity and summer crops of high productivity. Therefore, synthetic ETM+ NDVI suggests that data may potentially be used to quantify seasonal changes in reflectance induced by physiological changes in vegetation, the rate of increase and decrease of the NDVI, the dates of the beginning, end and peak(s) of the growing season, the length of the growing season, the timing of the annual maximum NDVI and the NDVI value at a fixed date (Drake, 1976; Tucker, 1979; Sellers, 1985) at fine spatial scales (Gao et al., 2006). Similar patterns are observed in case of MODIS NDVI (Fig. 7(d)). However, there were two major differences observed between these two data sets. First, the interannual variations were found to be more distinct in case of synthetic ETM+ NDVI compared to MODIS. Second, MODIS NDVI was overestimated, characterized by a moderate intercept with respect to synthetic ETM+ NDVI. Earlier study (Hwang, 2008) also reported over estimation of MODIS NDVI in comparison to ETM+ NDVI.
The vegetation dynamics and local climate are intrinsically linked and hence vegetation dynamics could provide information about climatic events, such as drought conditions. The NDVI has been used to improve our predictions and impact assessments of disturbances such as drought (Singh etal., 2003), fire (Maselli et al., 2003), flood (Wang et al., 2003) and frost (Tait and Zheng, 2003). Because of interannual and intra-annual variations in rainfall on the study area, the vegetation is often exposed to water shortage during the growing season, periodically leading to severe droughts (Susmitha, et al., 2009), food shortage and production deficiencies. NVDI in the monitoring of drought or in the evaluation of dynamic fire risk rely on the sensitivity of the index to vegetation dryness, a major predisposing factor for drought occurrence. An attempt has been made in this study to investigate the capability of synthetic ETM+ NDVI for the analysis of two drought years 2002 and 2004 (Susmitha et al., 2009). The mean NDVI (mean of eight years) over the study site is shown as a black line (Fig. 7(c) and 7(d)), which clearly separates the years of healthy and poor vegetation conditions during the summer season. The maximum value of synthetic ETM+ NDVI values (Fig. 7(c) observed during the year 2002 and 2004 were significantly lower (0.60 and 0.61 respectively) compared to mean NDVI value (0.66) and also with other years. Similar results were also observed for MODIS NDVI (Fig. 7(d)), but with overestimation. The lower value of NDVI for the year 2002 attributed to no rainfall during month of July (Susmitha et al., 2009). However, the year 2004 also suffered four short or long monsoon breaks, but these were intermittent and of less duration compared to July 2002 (Susmitha et al., 2009). Generally, the sowing time of summer crops over this area starts from middle of June and therefore, July rainfall is very critical for the growth of vegetation. Therefore, it may be stated that synthetic ETM+ NDVI could be useful for the monitoring of climatic events such as drought. However, further work is required to quantify the impact of synthetic ETM+ NDVI data on a larger scale.
3.3 Synthetic ETM+ NDVI vs precipitation and evaporation
NDVI was shown to be sensitive to changes in vegetation conditions, since it is directly influenced by the chlorophyll absorption of the sun radiation (Tucker et al., 1985). Because the chlorophyll status integrates the effects of numerous environmental factors, NDVI has been related to the following components of the water balance equation for a wide range of spatial and temporal scales: soil moisture (Choudhary and Golus, 1988; Farrar et al., 1994; Nicholson et al., 1996), precipitation (Tucker et al., 1985; Choudhary and Tucker, 1987; Nicholson et al., 1990; Devenport and Nicholson, 1993; Schultz and Halpert, 1993; Nicholson and Farrar, 1994; Grist et al., 1997) and evaporation (Running and Nemani, 1988; Kerr et al., 1989; Chiller et al., 1991; Gao et al., 1992; Seevers and Ottmann, 1994; Nicholson et al., 1996). A comparable long-term study of NDVI versus concurrent monthly evaporation has been presented by Nicholson et al. (1996) who concluded that with the growing aridity of the environment the NDVI versus evaporation relationship becomes significantly weaker. However, it was concluded by Szilagyi et al. (1998), when a time-lag of one month between evaporation with NDVI is taken into consideration, the relationship remains strong even in a water limited environment.
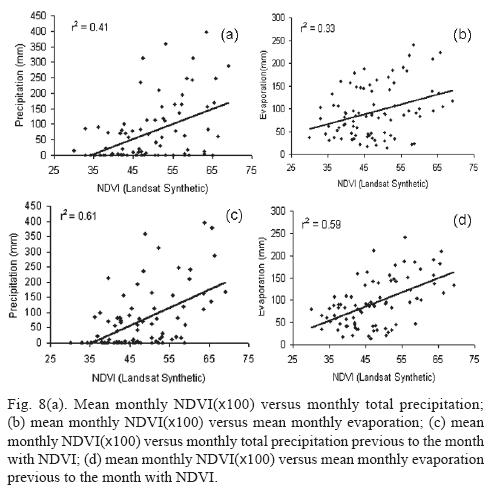
The relationships between evaporation, precipitation and synthetic ETM+ NDVI as mentioned earlier were revisited. The scatter plots between mean monthly synthetic ETM+ NDVI values versus monthly total precipitation and monthly evaporation with no time-lag as shown in Figure 8a and b yielded a weak relationship (r2=0.41 and r2 =0.33 respectively). The relationship improves when the synthetic ETM+ NDVI values are plotted against precipitation and evaporation with a time-lag of one month (Fig. 8(c) and 8(d)) with coefficients of determination as 0.59 and 0.56 respectively. Previous study (Di et al., 1994) also confirms these findings. These relationships between synthetic ETM+ NDVI and evaporation are also in agreement with previous studies (Nicholson et al., 1996 and Szilagyi et al., 1998). Therefore, synthetic ETM+ NDVI could be a useful tool for estimating evaporation at regional scales for long-term hydrologic budgeting and model validation by supplying reference values for the modeler against whom the model estimated evaporation values can be regressed.
4. Discussion
As currently only the SLC-off Landsat ETM+ and the aging Landsat-5 TM (Chander et al., 2007; Helder and Ruggles, 2004) systems are acquiring data, and only a single successor Landsat Data Continuity Mission (LDCM) sensor is scheduled for launch early in the next decade (Irons and Masek, 2006), a potential solution to provide more frequent high resolution surface observations is to fuse Landsat observations with data from other remote sensing systems. This study investigated the capability of STARFM (Gao et al., 2006) over a tropical region (India) to predict seasonal changes in winter and summer crops for a higher level of complexity due to small field sizes, diversified cropping pattern and field-to-field variability in crop phenology and management practices, which is different than its use in previous studies (Gao et al., 2006 and Hilker et al., 2009). The prediction residuals (Fig. 6i) were found to be considerably lower than the temporal residuals (Fig. 6c and 6f), suggesting that the prediction method is on average better than temporal pixel substitution. The higher correlations between observed and predicted pixel values for the NIR and red band (Table IV) may suggest their use for the derivation of the product such as NDVI, LAI at 30 m spatial resolution. The validation of synthetic 8-day ETM+ NIR reflectance with single day observed ETM+ NIR showed a very good agreement (Figs. 4 and 5), implying the capability of the prediction method. In the present study, MODIS 8-day composite images are used rather than daily MODIS reflectance products, because they yielded largely cloud-free images and can therefore help to predict changes in reflectance of vegetation over tropical area of the earth where cloud cover prevents frequent cloud free observations. The use of MODIS composites rather than single observations may, however, impact the average reflectance brightness for a given image region, depending on the MODIS scenes used in the MOD09Q1 product and is therefore at the same time also a limitation to the applied technique as the composition of data originating from multiple viewing angles and the variation of vegetation within the eight-day production period which differs from the Landsat acquisition date, also provides a possible source of error (Hilker et al., 2009).
NDVI is often used as a monitoring tool for the vegetation health and dynamics, enabling easy temporal and spatial comparisons (Myneni et al., 1997). Benefits of this work include the successful data fusion of ETM+ and MODIS data sets, enabling the use of the longer Landsat TM/ETM+ NDVI time series for winter and summer seasons over a tropical area. Direct comparisons of synthetic ETM+ NDVI with MODIS NDVI revealed several important distinctions and similarities. One obvious difference was associated with image/map resolution. Synthetic ETM+ captured much of the spatial complexity of land cover at the study site (Fig. 6(g)). In contrast, the relatively coarse resolution of MODIS did not allow for that level of spatial detail (Fig. 3(f)). The greatest difference was an overestimation by MODIS NDVI (Fig. 7(d)). This is because MODIS data have significantly larger grain size (250 m), which can be expected to lower overall spatial variance (Woodcock and Strahler, 1987; Cohen et al., 1990). Furthermore, at larger grain sizes, there is less likelihood that class-specific relationships are practical. However, due to difference in spectral bands, temporal compositing, spatial resolution and other sensor characteristics, there has never been the expectation that NDVI values from these two sensors (synthetic ETM+ and MODIS) here will match perfectly. Empirical techniques can be used to force agreement, yet there remains a question of how well the resulting time series matches reality. Comparison provides evidence that the time series do represent what is actually happening on the ground.
The previous studies (Szilagyi et al., 1998; Szilagyi, 2000) also confirm the relationship of synthetic ETM+ NDVI with hydrological parameters as shown in Figure 6. However, different authors drew differing conclusions about the relationship of NDVI to precipitation and evaporation. For example, Seevers and Ottmann (1994) and Nicholson et al. (1996) pointed out that the NDVI-evaporation relationship is strong mainly in humid environments. Szilagyi et al. (1998) emphasized that the correlation may not necessarily deteriorate with the growing aridity of the environment, provided that a time-lag is considered between the two variables. One might argue that a lag between evaporation and NDVI exists because, when precipitation is high in a month, the NDVI will be high the following month, and conversely, since it takes some time for the vegetation to use it from soil moisture storage and since soil moisture supports vegetation for some time during dry spells before plants start to wilt. Szilagyi et al. (1998) showed that NDVI is more strongly related to lagged evaporation than lagged precipitation. Also, NDVI had higher correlation with evaporation than with precipitation for water-cycle averaged values (Szilagyi, 2000). This is so because plant photosynthesis and transpiration are inseparable processes (Wiegand and Richardson, 1990). An increase/decrease in photosynthetic activity and thus in evaporation results in an increase/decrease of green biomass within a certain time lag. NDVI responds to any change in green biomass, because NDVI is a measure of the total amount of photosynthetically active tissue (Wiegand and Richardson, 1990) over a given area.
Algorithms like the one used in this study are important components of current research efforts seeking to map high spatial resolution changes in vegetation cover and status with high temporal density, over larger areas. Data blending approaches, such as STARFM can help in minimizing the technical limitations and trade-offs associated with information needs that require data with both high spatial and temporal resolutions. Applications such as monitoring seasonal changes in vegetation biophysical and structural attributes over tropical areas can benefit from the synergies of multiple data sources such as MODIS and Landsat ETM+. Advances in data blending can also influence the design of new sensors, where the advantages of different spatial and temporal resolutions may be fully realized in the creation of different sensors on different platforms, with the complementary nature of these systems in a data blending approach, considered from the outset of the design process. Tactical decision-making on land management can benefit from immediate access to the synthetic data, especially over the heterogeneous areas of very small crop field. At this stage, however, the synthetic ETM+ data should be considered only a general solution. Until more detailed models that begin with synthetic ETM+ and add computations of species are ready, and even of cultivar-specific developmental sequences, it will lack the accuracy desired for specific crops and areas.
5. Conclusions
The STARFM algorithm has been successfully used in this study for complex mixture of agriculture land over a tropical area to predict reflectance for NIR and red bands over a period of eight years (2002-2009). The accuracy was found to be better for NIR (mean r2 = 0.87, p ≤ 0.01) compared to red band (mean r2 = 0.65; p ≤ 0.01) for winter and summer crop seasons. The prediction method maintained a high spatial level of detail in the predicted scenes, as the prediction residuals were significantly lower than temporal residuals. It seems, however, less well suited to predict sudden changes in land cover, such as induced by harvesting or sowing of crops. The synthetic ETM+ NDVI demonstrated the capability of mapping the seasonal and interannual variations in vegetation at ETM+ spatial resolution and 8-day time intervals. The two drought years 2002 and 2004 were clearly brought out by synthetic ETM+ NDVI. The study of the relationship of synthetic ETM+ NDVI with precipitation and evaporation yielded that monthly total precipitation and monthly evaporation of the preceding month have higher correlation coefficients (r2 = 0.56 and r2 = 0.59) with mean monthly synthetic ETM + NDVI, which are also corroborated by previous studies.
Acknowledgements
I am very much thankful to Dr. T. Ramasami, Secretary, Department of Science and Technology, for his kind support and encouragement during the course of this study. Author would like to thank Dr. Feng Gao, Biospheric Sciences Branch, NASA Goddard Space Flight Center, USA for providing the STARFM algorithm and Dr. Thomas Hilker, Department of Forest Resource Management, University of British Columbia, Vancouver, Canada, for useful discussions. I also thank the subject editor and two anonymous reviewers for their extremely helpful and constructive comments on the manuscript. Author is also thankful to NASA for providing LANDSAT-7 ETM+ and MODIS data.
References
Acerbi F. W. Jr., J. G. P. W. Clevers and M. E. Schaepman, 2006. The assessment of multisensor image fusion using wavelet transforms for mapping the Brazilian savanna. Int. J. Appl. EarthObs. 8, 278-288. [ Links ]
Ali M. A. and D. A. Clausi, 2002. Automatic registration of SAR and visible band remote sensing images. 2002 IEEE International Geoscience and Remote Sensing Symposium, June 24-28 TO, Canada, doi: 10.1109/IGARSS.2002.1026106. [ Links ]
Badhwar G. D., 1984. Automatic corn-soybean classification using Landsat MSS data. II. Early season crop proportion estimation. Remote Sens. Environ. 14, 31-37. [ Links ]
Bentoutou Y., N. Taleb, K. Palma and J. Ronsin, 2005. An automatic image registration for application in remote sensing. IEEE T. Geosci. Remote Sens. 43, 2127-2137. [ Links ]
Bernstein L. S., S. M. Adler-Golden, R. L. Sundberg, R. Y Levine, T. C. Perkins, A. Berk, A. J. Ratkowski, G. Felde and M. L. Hoke, 2005. A new method for atmospheric correction and aerosol optical property retrieval for VIS-SWIR multi- and hyperspectral imaging sensors: QUAC (Quick atmospheric correction). Proceedings of International Geoscience and Remote Sensing Symposium. 5, 3549-3552. [ Links ]
Carper J., T. M. Lillesand and R. W. Kiefer, 1990. The use of intensity-huesaturation transformations for merging SPOT panchromatic and multispectral image data. Photo-gramm. Eng. RemoteSens. 56, 459-467. [ Links ]
Chander G. and B. L. Markham, 2003. Revised Landsat-5 TM radiometric calibration procedures, and post-calibration dynamic ranges. IEEE T. Geosci. Remote Sens. 41, 2674-2677. [ Links ]
Chander G., B. L. Markham and J. A. Barsi, 2007. Revised Landsat 5 thematic mapper radiometric calibration. IEEE T. Geosci. RemoteSens. 44, 490-494. [ Links ]
Chiller J., L. St-Laurent and J. A. Dyer, 1991. Relationship between the normalized difference vegetation index and ecological variables. Remote Sens. Environ. 35, 279-298. [ Links ]
Choudhary B. J. and C. J. Tucker, 1987. Monitoring global vegetation using Nimbus-7 37 GHz data: some empirical relations. Int. J. Remote Sens. 8, 1085-1090. [ Links ]
Choudhary B. J. and R. E. Golus, 1988. Estimating soil wetness using satellite data. Int. J. RemoteSens. 9, 1251-1257. [ Links ]
Cohen W. B., T. A. Spies and G. A. Bradshaw, 1990. Semivariograms of digital imagery for analysis of conifer canopy structure, Remote Sens. Environ. 34, 167-178. [ Links ]
Coppin P., I. Jonckheere, K. Nackaerts, B. Muys and E. Lambin, 2004. Digital change detection methods in ecosystem monitoring: A review. Int. J. Remote Sens. 25, 1565-1596. [ Links ]
Dare P. M. and I. J. Dowman, 2000. Automatic registration of SAR and SPOT imagery based on multiple feature extraction and matching. Geoscience and Remote Sensing Symposium, Proceedings, IGRASS 2000, IEEE 2000 International, Honolulu, Hi, USA, 24-28 July. Doi: 10.1109/IGARSS.2000.860282. [ Links ]
Devenport M. L and S. E. Nicholson, 1993. On the relationship between rainfall and using normalized difference vegetation index for diverse vegetation types in East Africa. Int. J.Remote Sens. 14, 2369-2389. [ Links ]
Di L., D. C. Rundquist and L. Han, 1994. Modelling relationships between NDVI and precipitation during vegetation growth cycles, Int. Remote Sens. 15, 2121-2136. [ Links ]
Farrar T. J., S. E. Nicholson and A. R. Lare, 1994. The influence of soil type on the relationship between NDVI, rainfall and soil moisture in semi-arid Botswana. II. Relationship to soil moisture, Remote Sens. Environ. 50, 121-131. [ Links ]
Gao F., J. Masek, M. Schwaller and F. Hall, 2006. On the blending of the Landsat and MODIS surface reflectance: Predicting daily Landsat surface reflectance. IEEE T. Geosci. RemoteSens. 44, 2207-2218. [ Links ]
Gao W., M. L. Wesely, D. R. Cook and R. L. Hart, 1992. Air-surface exchange of H2O, CO2 and O3 at a tall grass prairie in relation to remotely sensed vegetation indices. J. Geophys. Res. 97, 18663-18671. [ Links ]
Grist J., S. E. Nicholson and A. Mpolokang, 1997. On the use of NDVI for estimating rainfall fields in the Kalahari of Botswana. J. Arid Environ. 35,195-214. [ Links ]
Gutman G. G., 1999. On the use of long-term global data of land reflectances and vegetation indices derived from the AVHRR. J. Geophys. Res. 104, 6241-6255. [ Links ]
Hall F. G. and G. D. Badhwar, 1987. Signature-extendable technology: Global space-based crop recognition. IEEE T.Geosci. RemoteSens. 2, 93-103. [ Links ]
Hanaizumi N. and S. Fujimura, 1993. An automated method for registration of satellite remote sensing images, Geoscience and Remote Sensing Symposium, IGRASS'93. Better understanding of earth environment. International ITT Visual Information Solutions, Boulder, CO. doi: 10.1109/IGARSS.1993.322087. [ Links ]
Hansen M. C., D. P. Roy, E. Lindquist, B. Adusei, C. O. Justice and A. Altstatt, 2008. A method for integrating MODIS and Landsat data for systematic monitoring of forest covers and changes in the Congo Basin. Remote Sens. Environ. 112, 2495-2513. [ Links ]
Helder D and T. Ruggles, 2004. Landsat thematic mapper reflective-band radiometric artifacts. IEEE Transactions on Geoscience and Remote Sensing, 42, 2704-2716. [ Links ]
Hilker T., M. A. Wulder, N. C. Coops, J. Linke, G. McDermid, J. G. Masek, F. Gao and J. C. White, 2009. A new data fusion model for high spatial- and temporal-resolution mapping of forest disturbance based on Landsat and MODIS. Remote Sens. Environ. 113, 1613-1627. [ Links ]
Hwang T., S. Kang, J. Kim, Y. Kim, D. Lee and L. Band, 2008. Evaluating drought effect on MODIS Gross Primary Production (GPP) with an eco-hydrological model in the mountainous forest, East Asia. Glob. Change Biol. 14, 1-20. [ Links ]
Irons J. and J. Masek, 2006. Requirements for a Landsat data continuity mission, Photo-gramm.Eng. Remote Sens. 72, 1102-1108. [ Links ]
James M. E. and S. N. V. Kalluri, 1994. The pathfinder AVHRR land data set: an improved coarse resolution data set for terrestrial monitoring. Int. J. Remote Sens. 15, 3347-3363. [ Links ]
Justice C. O. and J. R. G. Townshend, 2002. Special issue on the moderate resolution imaging spectroradiometer (MODIS): A new generation of land surface monitoring. Remote Sens.Environ. 83, 1-2. [ Links ]
Kalvelage T. and J. Willems, 2005. Supporting users through integrated retrieval, processing, and distribution systems at the land processes distributed active archive center. Acta Astronaut. 56, 681-687. [ Links ]
Kaufmann R. K., L., Zhou, Knyazikhin, N. V. Shabanov, R. B. Myneni and C. J. Tucker, 2000. Effect of orbital drift and sensor changes on the time series of AVHRR vegetation index data. IEEE T. Geosci. Remote Sens. 38, 2584-2597. [ Links ]
Kennedy R. E. and W. B. Cohen, 2003. Automated designation of tie-points for image-to-image coregistration. Int. J. Remote Sens. 24, 3467-3490. [ Links ]
Kerr Y. H, J. Imbernon, G. Dediue, O. Hautecour, J. P. Lagouarde and B. Seguin, 1989. NOAAAVHRR and its uses for rainfall and evapotransipiration monitoring. Int. J. Remote Sens. 10, 847-854. [ Links ]
Markham B. L., G. Chander, R. Morfitt, D. M. Hollaren, J. Nelson, L. Ong, and J. F. Mendenhall, 2004. Radiometric processing and calibration of EO-1 advanced land imager data. Proceedings of Global Priorities in Land Remote Sensing, PECORA 16, South Dakota, Sioux Falls, 23-27 October. http://cursosihlla.bdh.org.ar/Tutoria_2010/Sensor_ALI/Markham_B.pdf. [ Links ]
Maselli F., S. Romanelli, L. Bottai and G. Zipoli, 2003. Use of NOAA-AVHRR NDVI images for the estimation of dynamic fire risk in Mediterranean areas. Remote Sens. Environ. 86, 187-197. [ Links ]
Myneni R. B., C. D. Keeling, C. J. Tucker, G. Asrar and R. R. Nemani, 1997. Increase plant growth in the northern high latitudes from 1981-1991. Nature 386, 698-702. [ Links ]
Nicholson S. E., M. L. Devenport and A. R. Malo, 1990. A comparison of the vegetation response to rainfall in the Sahel and east Africa using normalized difference vegetation index from NOAA AVHRR. Clim. Change 17, 209-241. [ Links ]
Nicholson S. E. and T. J. Farrar, 1994. The influence of soil type on the relationship between NDVI, rainfall and soil moisture in semi arid Botswana. I. Relationship to rainfall, RemoteSens. Environ. 50, 107-120. [ Links ]
Nicholson S. E., A. R. Lare, J. A. Marengo and P. Sanros, 1996. A revised version of Lettau's evapoclimatonomy model. J. Appl. Meteorol. 35, 549-561. [ Links ]
Price K. P., S. L. Egbert, M. D. Nellis, R.-Y. Lee and R. Boyce, 1997. Mapping land cover in a high plains agro-ecosystem using a multidate Landsat thematic mapper modeling approach. Transactions of the Kansas Academy of Science 100, 21-33. [ Links ]
Roy D. P. and O. Dikshit, 1994. Investigation of image resampling effects upon the textural information content of a high spatial resolution remotely sensed image. Int. J. Remote Sens. 15, 1123-1130. [ Links ]
Roy D. P., 2000. The impact of misregistration upon composited wide field of view satellite data and implications for change detection. IEEE T. Geosci. Remote Sens. 38, 2017-2032. [ Links ]
Roy P., J. Junchang, P. Lewis, C. Schaaf, F. Gao, M. Hansen and E. Lindquist, 2008. Multi-temporal MODIS–Landsat data fusion for relative radiometric normalization, gap filling, and prediction of landsat data. Remote Sens. Environ. 112, 3112-3130. [ Links ]
Running S. W. and R. R. Nemani, 1988. Relating seasonal patterns of the AVHRR vegetation index to simulated photosynthesis and transpiration of forests in different climates. RemoteSens. Environ. 24, 347-367. [ Links ]
Savitzky A. and J. E. Golay, 1964. Smoothing and differentiation of data by simplified least squares procedures. Anal. Chem. 36, 1627-1639. [ Links ]
Schultz P. A. and M. S. Halpert, 1993. Global correlation of temperature, NDVI and precipitation. Adv. Space Res. 13, 277-280. [ Links ]
Seevers P. M. and R. W. Ottmann, 1994. Evapotranspiration estimation using a normalized difference vegetation index transformation of satellite data. Hydrolog. Sci. J. 39, 333-345. [ Links ]
Sellers P. J., 1985. Canopy reflectance, photosynthesis and transpiration. Int. J. Remote Sens. 6,1335-1372. [ Links ]
Shettigara V. K., 1992. A generalized component substitution technique for spatial enhancement of multispectral images using a higher resolution data set. Photo-gramm. Eng. Remote Sens. 58, 561-567. [ Links ]
Singh R. P., S. Roy and F. Kogan, 2003. Vegetation and temperature condition indices from NOAA AVHRR data for drought monitoring over India. Int. J. Remote Sens. 24, 4393-4402. [ Links ]
Smith J. H. and D. B. Ramey, 1982. A crop area estimator based on changes in the temporal profile of a vegetative index. Proceedings of the Survey Research Methods Section, American Statistical Association, 1982, Cincinnati, Ohio, USA, 495-498. [ Links ]
Smith P. M., S. N. V. Kalluri, S. D. Prince and R. Defries, 1997. The NOAA/ NASA Pathfinder AVHRR 8-km land data set. Photo-gramm. Eng. Remote Sens. 63, 12-31. [ Links ]
Song C. and C. E. Woodcock, 2003. Monitoring forest succession with multitemporal Landsat images: Factors of uncertainty. IEEE T. Geosci. Remote Sens. 41, 2557-2567. [ Links ]
Susmitha J., A. K. Sahai and B. N. Goswami, 2009. Eastward propagating MJO during boreal summer and Indian monsoon droughts. Clim. Dynam. 32, 1139-1153. [ Links ]
Szilagyi J., D. C. Rundquist and D. C. Gosselin, 1998. NDVI relationship to monthly evaporation. Geophys. Res. Lett. 25,1753-1756. [ Links ]
Szilagyi J., 2000. Can a vegetation index derived from remote sensing be indicative of areal transpiration? Ecol. Model. 127, 65-79. [ Links ]
Tait A. and X. G. Zheng, 2003. Mapping frost occurrence using satellite data. J. App. Meteorol. 42, 193-203. [ Links ]
Tanre D., E. Vermote, B. N. Holben and Y. L. Kaufman, 1992. Satellite aerosol retrieval over land surfaces using the structure functions. Proc. International GARSS'92, IEEET. Geosci. RemoteSens. Soc. Houston, TX, 1474-1477. [ Links ]
Tucker C. J., 1979. Red and photographic infrared linear combinations for monitoring vegetation. Remote Sens. Environ. 8, 127-150. [ Links ]
Tucker C. J., C. L. Vampraer, M. J. Sharman and G. Van Ittcrsum, 1985. Satellite remote sensing of total herbaceous biomass production in the Senegales Sahel: 1980-1984. Remote Sens.Environ. 17, 233-249. [ Links ]
Tucker C. J. and J. E. Pinzón, 2005. An extended AVHRR 8-km NDVI dataset compatible with MODIS and SPOT vegetation NDVI data. Int. J. Remote Sens. 26, 4485-4498. [ Links ]
Vermote E. F. and Y. J. Kaufmann, 1995. Absolute calibration of AVHRR visible and near-infrared channels using ocean and cloud views. Int. J. Remote Sens. 16, 2317-2340. [ Links ]
Viovy N., O. Arino and A. S. Belward, 1992. The Best Index Slope Extraction (BISE): A method for reducing noise in NDVI time series. Int. J. Remote Sens. 13, 1585-1590. [ Links ]
Wang Q., M. Watanabe, S. Hayashi and S. Murakami, 2003. Using NOAAAVHRR data to assess flood damage in China. Environ. Monit. Assess. 82, 119-148. [ Links ]
Wardlow B. D., S. L. Egbert and J. H. Kastens, 2007. Analysis of time-series MODIS 250 m vegetation index data for crop classification in the U. S. Central Great Plains. Remote Sens.Environ. 108, 290-310. [ Links ]
Wiegand C. L. and A. L. Richardson, 1990. Use of spectral vegetation indices to infer leaf area, evapotranspiration and yield. Agron. J. 82, 623-636. [ Links ]
Woodcock C. E. and A. H. Strahler, 1987. The factor of scale in remote sensing. Remote Sens.Environ. 21, 311-332. [ Links ]
Yocky D. A., 1996. Multiresolution wavelet decomposition image merger of Landsat Thematic Mapper and SPOT panchromatic data. Photo-gramm. Eng. Remote Sens. 62,1067-1074. [ Links ]
Zhang Z. and J. Zhang, 2001. Facet based differential registration of remote sensing images. Geoscience and Remote Sensing Symposium. IGRASS 2001,IEEE Geosci. Remote Sens. Soc. 2001. Sydney, AU, 27, 1188-1190. [ Links ]

