


Servicios Personalizados
Revista
Articulo
 Inglés (pdf)
  Artículo en XML
 Referencias del artículo
 Enviar artículo por email
Indicadores
 Citado por SciELO
 Accesos
Links relacionados
 Similares en SciELO
Compartir

 Permalink
Revista mexicana de ciencias geológicas
versión On-line ISSN 2007-2902versión impresa ISSN 1026-8774
Rev. mex. cienc. geol vol.28 no.3 Ciudad de México dic. 2011
A normalized difference lahar index based on Terra/Aster and Spot 5 images: an application at Colima Volcano, Mexico
Un índice espectral normalizado de lahares basado en imágenes Terra/Aster y Spot 5: aplicación al volcán de Colima, México
Norma Dávila–Hernández1*, Jorge Lira2, Lucia Capra–Pedol3, and Francesco Zucca4
1 Posgrado en Ciencias de la Tierra, Instituto de Geofísica, Universidad Nacional Autónoma de México, 04510 México D.F., Mexico.*ndh_norma@yahoo.es
2 Departamento de Recursos Naturales, Instituto de Geofísica, Universidad Nacional Autónoma de México, 04510 México D.F., Mexico.
3 Centro de Geociencias, Universidad Nacional Autónoma de México, Campus Juriquilla, 76230 Querétaro, Mexico.
4 Università degli Studi di Pavia, Strada Nuova 65, 27100 Pavia, Italy.
Manuscript received: September 5, 2010
Corrected manuscript received: March 10, 2011
Manuscript accepted: May 30, 2011
ABSTRACT
For the evaluation of recent lahar deposits, we propose a Normalized Difference Lahar Index (NDLI) based on the analysis of eigenvectors of Principal Components Analysis (PCA) applied to Terra/Aster and Spot 5 multispectral images of the Colima Volcano. As a result, the normalization of bands 3 and 4 of both sensors produces the best results for the spectral enhancement of lahar deposits with respect to the rest of the components in the image. Such normalization is the basis for the NDLI. For the validation of results in this case of study, fieldwork was carried out based on ground control points (GCP) on the hillsides of Colima Volcano. Likewise, to corroborate the validity of the NDLI, we performed enhancements and segmentations of lahar deposits using a Variant of Principal Component Analysis (VPCA) and a region growth algorithm. These enhancements and segmentations were compared with results from the NDLI. The application of the NDLI allows the identification of new deposit units and new alluvial fan forms from recurrent lahar deposits, principally on Montegrande and San Antonio ravines on the south flank of the volcano. The application of remote sensing techniques, as the introduction of the NDLI, is a useful tool for the identification of lahar deposits associated to recent volcanic activity.
Key words: lahar deposits, spectral enhancement, lahar segmentation, variant of Principal Components Analysis, Terra/Aster image, Spot 5 image.
RESUMEN
Con la finalidad de evaluar el alcance de un evento lahárico, se propone un Indice Espectral Normalizado de Lahares (NDLI, por sus siglas en inglés) basado en el análisis de los eigenvectores del Análisis de Componentes Principales (PCA, por sus siglas en inglés) aplicado a imágenes Terra/Aster y Spot 5 del Volcán de Colima. Como resultado, se obtuvo que la normalización de las bandas 3 y 4 de ambos sensores produce el mejor realce espectral de los depósitos de lahar con respecto al resto de los componentes de la imagen. Esta normalización es la base para el NDLI. Para la comprobación de resultados del estudio de caso, se realizó un trabajo de campo con puntos de control en las laderas del Volcán de Colima. De igual forma, para corroborar la validez del NDLI, se realizaron realces y segmentaciones de depósitos de lahar con base en un Análisis a la Variante de Componentes Principales (VPCA, por sus siglas en inglés) y un algoritmo de crecimiento de regiones. Estos realces y segmentaciones fueron comparados con los resultados del NDLI. De esta forma, la aplicación del NDLI permite identificar nuevas unidades de depósito y nuevos abanicos aluviales a partir de depósitos de lahar recurrentes, principalmente sobre las desembocaduras de las barrancas San Antonio y Montegrande en el Volcán de Colima. Por tanto, se demuestra que la aplicación de técnicas de percepción remota, como lo es el realce espectral del NDLI, son una herramienta útil para la identificación de depósitos asociados a actividad volcánica reciente.
Palabras clave: depósitos de lahar, realce espectral, segmentación de lahares, variante de Componentes Principales, imágenes Terra/Aster, imágenes Spot 5.
INTRODUCTION
The assessment of the probabilities of volcanic eruption occurrence and related volcanic phenomena has received significant attention in the last few decades. The application of remote sensing in volcanic terrains has proven to be useful in diverse active volcanic zones around the world. In particular, in monitoring fumarolic activity, thermal variation, advance of lava flows and domic intrusions (Oppenheimer, 1991; Rothery et al., 1992; Oppenheimer and Francis, 1997; Wooster and Rothery, 1997; Flynn et al., 1994; Wooster et al., 2000; Flynn et al., 2001).
The use of digital elevation models (DEM) for assessment of topographic changes in volcanic environments is notable. Thus, several techniques have been developed using radar interferometry (InSAR) applied to superficial morphologic modifications. These developments are due to the urgency of results and generation of new information in areas of difficult access (Mouginis et al., 2001; Stevens et al., 2001; Hubbard et al., 2007; Huggel et al., 2008).
The spatial recognition and mapping of superficial deposits related to recent volcanic activity allow the characterization of areas affected by lahar flow paths, which is useful in disaster management. Such mapping has been achieved by using optical and radar sensors of different spatial and temporal resolution. There are several studies related to temporal and spatial variation of the frequency and distribution of rain–induced lahars in active volcanoes. The Pinatubo (Philippines) and La Casita (Nicaragua) volcanoes are among the most monitored using remote sensing tools. Such monitoring is based on textural features, superficial sedimentology and morphology of lahar deposits (Torres et al., 1996; Chorowicz et al, 1997, López et al., 1998; 1996; Van Wyk de Vries et al., 2000, Kerle and Oppenheimer, 2002; Kerle et al., 2003; Torres et al., 2004).
In this paper, we propose a new lahar index (NDLI) using remote sensing techniques applied to Colima Volcano in western México. The basis of this index resides on the spatial evaluation and spectral enhancement of lahar deposits by applying a set of transformations to a Terra/Aster (Advanced Spaceborne Emission and Reflection Radiometer) and Spot 5 images (Système Pour l 'Observation de la Terre) images. This approach is useful in volcanic areas of difficult access due to high frequency occurrence of laharic events. The spatial evaluation of the NDLI is based on fieldwork and segmentation by means of a region growth algorithm. We compare the spectral enhancement from the NDLI with that obtained from Variant of Principal Component Analysis (VPCA) and we assess a statistical validation for these results. The enhancement of lahar deposits achieved from the VPCA and their segmentation from the region growth algorithm are used to corroborate the validity of the NDLI.
THE COLIMA VOLCANO
The Colima Volcano is the youngest active edifice of the Colima Volcanic Complex and is located in the western sector of the Trans–Mexican Volcanic Belt (Figure 1). The Colima Volcano is a stratovolcano that reaches an altitude of 3820 meters above sea level and is andesitic in composition. The volcano began its activity ~50 ky ago (Robin et al., 1987) and it is considered one of the most active volcanoes in North America. In the last 430 years, 50 eruptive phases have occurred (De la Cruz–Reyna, 1993; Saucedo–Girón, 2000). At present, volcanic activity consists of dome growth and collapse that produce block and ash flow deposits. Those deposits are subsequently remobilized by heavy rains and form lahars on main ravines on the southern flank of the volcano.
Lahars at Colima Volcano
Lahar is any kind of gravitational flow of water–saturated volcanic debris flowing down slope. Thus, a lahar can be related to different types of flows depending on the proportion of volcanic debris (solid fraction): 40–70 wt. % is linked to hyperconcentrated flows and 70–90 wt. % is associated to debris flows (Pierson, 1985, Scott, 1988). However, in this work use the term "laharic events" or "lahar deposits" in indistinct form to refer to lahar inundation zones on a satellite image including both the deposits produced by debris and by hyperconcentrated flows.
Lahar events at Colima Volcano are associated with rainfall removilization of old pyroclastic flow deposits that fill the main ravines. Lahars occur on the south slope of Colima Volcano along six ravines: La Lumbre, Zarco, Cordobán, San Antonio, Montegrande and Arenal (Figure 2). Further, they are enhanced by a dominant topographic control with slopes of up to 40°.
In the Colima Volcano, the lahar deposits reach 15 km along ravines starting from near the summit, however subsequent erosion partially destroys the stratigraphic record and difficults its spatial and temporal correlation for later morphometric and stratigraphic analysis. (Capra et al., 2010). The monolithologic composition of the volcano also compromise correlation of stratigraphic units across alluvial channels.
MATERIALS AND METHODS
The materials used in our research consist of two sets: 1) data collected from fieldwork, and 2) satellite images from Spot 5 and Terra/Aster sensors. The methods we employed are directly related to the analysis of such images complemented with the data collected in the field. In the following section, we provide technical details of the images. A schematic workflow diagram of our proposed method is given in Figure 3. The derivation of the NDLI is based on the PCA; therefore, we provide an explanation of this transformation. The VPCA and the region growth algorithm are used to assess the utility of the NDLI. We introduced an explanation of the VPCA and we provide proper references for the region growth algorithm, the PCA and the VPCA.
Satellite images of Colima Volcano
The Terra/Aster imagery was obtained from the Land Processes Distributed Active Archive Center (LP DAAC), located in the United States Geological Survey (USGS) Earth Resources Observation and Science Center (EROS) (<http://asterweb.jpl.nasa.gov/>). The Spot 5 imagery was provided by Secretaría de Marina under the terms of an agreement with the Universidad Nacional Autónoma de México (UNAM) (<http://catalog.spotimage.com/PageSearch.aspx>).
We selected four multispectral images from the Terra/Aster (A1 and A2) and Spot 5 sensors (S1 and S2) for years 2004 to 2009 considering availability and cloud–free coverage. The acquisition characteristics of such images are given in Table 1. Figure 2 shows a false color composite of these images. From such images, we subtracted a sub–image covering an area centered on the Colima Volcano. The dimension of the sub–image for Spot 5 is 1296 columns and 937 rows, and for Terra/Aster is 1279 columns and 785 rows, covering an area of –1200 km2. Only the first two subsystems of Terra/Aster (visible, near–infrared,VNIR, and shortwave–infrared,SWIR) were used for the spectral analysis (first nine spectral bands), this is because the thermal infrared (TIR) subsystem is at low resolution (Table 1).
Fieldwork rationale
In this paragraph we introduce the fieldwork rationale to assess the results produced by the Normalized Difference Lahar Index (NDLI). As explained above, four multispectral images (Terra/Aster and Spot 5) for years 2004 to 2009 were used. This allowed a time characterization of the study site. Thus, for the verification of results, two field campaigns were carried out on April 2008 and April 2010. The fieldwork was feasible in the principal ravines of the south slope: San Antonio and Montegrande. Fifteen Ground Control Points (GCP) were sampled using a high–resolution Geo–Positioning System (GPS). Such GCPs were loaded into a Geographic Information System and overlaid on the final images. The selection criteria of GCPs were based on a random sampling scheme. The tracking of a single deposit is not possible due to high erosive activity on (within) the ravines. Each GCP was stored with an in situ description of textural characteristics, thickness, basic layers composition and dimension of fans in the distal zones linked to lahar deposits. The deposit description was used as a tool to gather significant differences in the field between lahar and other sedimentary deposits.
Principal component analysis (PCA)
The lahar index is based upon a variant of the Principal Component Analysis (PCA). Therefore, we briefly introduce a description of the PCA followed by a detailed account of such variant. Details of PCA may be found in Lira (2010). The PCA is defined as

Where A is the kernel of the transformation and r is the vector of the pixel values in the original bands of the image. The kernel A is formed by the eigenvectors of the covariance matrix Kf of the original image F(r). Non–correlated bands named principal components form the transformed image, g(r). The eigenvectors of Kf generate a new system of orthogonal axes, where the variance values are maximized among each principal component.
Thus, PCA is a useful tool to eliminate redundant information among bands of the original image (Lira, 2010). In Terra/Aster and Spot images, the first three principal components carry almost the whole of information of the image F(r).
For the spectral lahar index construction, an analysis was undertaken on the weight factors of the linear combination of bands provided by PCA. These weight factors are defined by the eigenvectors of the covariance matrix Kf.
To look further into the detail of the derivation of the lahar index, a variant of the PCA needs to be considered; this is explained in the following section.
Variant of Principal Components Analysis (VPCA)
In Equation (1), the kernel A is obtained by means of the eigenvectors of the covariance matrix Kf, This matrix is calculated using the whole set of pixels of the image F(r). The variant of PCA uses only a set of pixels that refers to a spectral class previously defined (Lira, 2006; Lira, 2010). A covariance matrix is calculated on the grounds of this set of pixels; let this covariance matrix be Kfw. Thus, the VPCA is written as

Where Aw is the kernel formed by the eigenvectors obtained from the covariance matrix Kfw and ra is the spectral class previously defined. The VPCA minimizes the dispersion between targets and emphasizes or spectrally separates a cover–type with respect to the rest of coverages or targets that form the satellite image. This generates a new spectral projection where the maximum spectral separation is achieved and is related to the maximum variance (Richards and Jia, 1999; Lira, 2006).
The operation of the VPCA was as follows: we extracted from the original image an area that represents an active fan where lahars accumulate each year during the rainy season. We read the values of the pixels included in this area and obtained its associated covariance matrix. Then, we applied Equation (2) to derive output components according to VPCA. The active fans where lahar deposits are apparent is the one cover–type that is spectrally separated from to the rest of the image. This spectral separation is maximum, leading to the enhancement of lahars achieved by means of the VPCA.
Grounds for the generation of a lahar index
Data derived from PCA
The first three eigenvectors are depicted in Table 2. Each of these first components shows different aspects of the image that cannot be appreciated in the original bands. Figures 4a–4b depict the first three principal components.
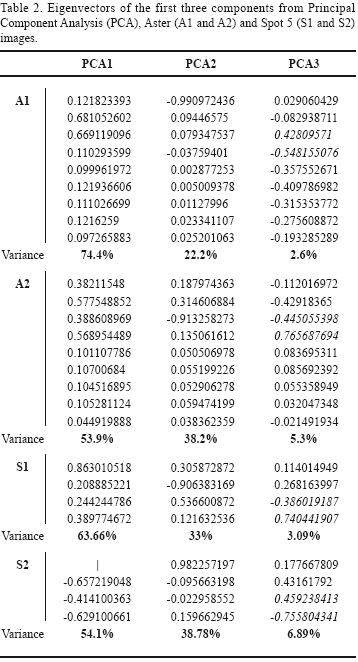
For Terra/Aster images, the first principal components are associated with the highest variance of 74.4 % (A1), and 53.9 % (A2), and high contrast and brightness (Table 2, Figure 4). In the case of Spot 5 images, the first principal components have a variance of 63.6 % (S1) and 54.1 % (S2) respectively. However, based on a visual examination of contrast and brightness, the spectral enhancement of deposits linked to recent volcanic activity is associated with the third component. On the image, such enhancement is associated to high digital numbers or bright colors. This enhancement is observable in the third component of both images, for Terra/Aster images: PCA3–A1 and PCA3–A2 and for Spot 5 images: PCA3–S1, PCA3–S2 (Figure 4).
The above results produce four elements of analysis. (i) The third principal components show the best spectral enhancement of lahars in relation to the remaining components of the images; (ii) this association is valid even when the third component presents a low variance; (iii) Table 2 and Figure 5 show that the weight factors of the third eigenvector hold the greatest difference for bands 3 and 4; the term "greatest difference" is the maximum difference found between two bands, considering the eigenvector's behavior of principal component analysis; (iv) this difference is sustained for the ensemble of the four images for both Terra/Aster and Spot 5 sensors. The spectral enhancement of lahars in the third principal component and the greatest difference, as explained above, form the basis for the definition of the NDLI.
Data derived from VPCA
Figure 6 shows an RGB false color composite of the first three VPCA components for Terra/Aster and Spot 5 images. The enhancement of lahar deposits generated by the VPCA is used as a validation tool of the enhancement provided by the NDLI. Such validation is based on statistical analysis and visual inspection. According to this, the lahars enhanced by VPCA are represented by different hues of pink, while the other objects are observed with different colors in the image (Figure 6).

Design of the NDLI
The idea of a lahar index originated from principal component analysis (PCA) was applied to both images. As explained in previous sections, bands 3 and 4 present the greatest difference for the third component PCA3, in which the lahars are spectrally enhanced.
In order to compare the areas of lahars enhanced by the VPCA and the NDLI we performed a segmentation of lahars. This segmentation was achieved in terms of canonical variables using the Terra/Aster image of2005. This segmentation is to corroborate that VPCA and the NDLI indeed enhance the areas of lahars in the multispectral image.
The segmentation of lahar deposits was achieved on the basis of a canonical expansion (Lira and García, 2003; Lira, 2010). The canonical variables considered are: The albedo of lahars (X1), the third principal component of the (X2), and Humidity from Kauth and Thomas transformation (X3) (Kauth et al., 1979). Upon visual inspection, the third principal component was selected because lahar deposits are well differentiated from the rest of the image. The albedo of lahar (X1) results from the first component of VPCA (Lira and García, 2003). The variable X2 is the third principal component from PCA.
The variables {X1, X2 and X3} were put into a hierarchical region–growth algorithm (RHSEG) (Tilton et al., 2006). The result of this algorithm is an image with a number of regions. By means of an agglomerative process, a final binary image is obtained where two classes are identified, the first one is the laharic event and the second one includes the rest of the image (Figure 7). Figure 8 depicts a block diagram of the segmentation process of lahars.
According with Figure 7, comparison of the binary image with the spectral enhancement produced by the VPCA shows a match of the areas occupied by the lahars. In the same way, a comparison of the binary image with the enhancement of deposits produced by the PCA3 shows a match as well. However, there is a difference in VPCA with respect to PCA3. For VPCA, the lahar deposits show inwards, enhanced borders linked to several lahar pulses (alluvial pulses) located toward the ravine mouth. Such spectral borders are represented by alternation of high and low digital values along enhanced deposits. This is not the case for PCA3, where mostly high digital numbers represent the complete area covered by lahar deposits. In brief, we have the following results: a) an enhancement of deposits from the PCA, b) a unique relationship among bands 3 and 4, c) an enhancement of lahars from VPCA, and d) a segmentation from region growth that matches the spectral enhancement of lahars.
Based on the above discussion, the Normalized Difference Lahar Index (NDLI) is defined as

This index is valid for both images: Terra/Aster and Spot. B3 is the band number three that corresponds to the near infrared, and B4 is the band number 4 that corresponds to the middle infrared.
RESULTS
Statistical validation of the NDLI
The results derived from NDLI are shown in Figure 9. A statistical validation of the NDLI was undertaken. An inspection of the components from PCA (Figures 4 and 5) leads to the conclusion that a particular relationship of bands 3 and 4 set the grounds for the design of the NDLI as explained in the previous section. The VPCA specifically enhances the lahar deposits; therefore, a correlation between the VPCA and the NDLI should be high for those areas occupied by lahar deposits.
To establish a comparison between VPCA and NDLI (Figure 6 and 9), a descriptive statistical analysis was undertaken. This comparison is based on correlation coefficients between VPCA and NDLI. A large area of the Terra/Aster and Spot 5 images is covered by vegetation, which might lead to an error in the statistical comparison analysis. Therefore, to obtain a meaningful correlation coefficient, a sample area was selected, where the lahar deposits are significant. For the selected sample area, the correlation coefficients between VPCA and NDLI for Spot 5 images S1 and S2 are 0.75 and 0.72, respectively. For Terra/Aster images A1 and A2, the correlation produced coefficients of 0.67 and 0.63, respectively. This statistical relationship can be associated with a better spatial definition of the lahar deposits in Spot 5 images (S1, S2) with respect to Terra/Aster images (A1, A2) resulting from VPCA and NDLI. This is for specific areas related to down–flow inundation in San Antonio and Montegrande ravines. The high correlation and spatial definition for S1 can be associated to the eruptive events of 2004–2005.
Based on such correlation results, a direct relation–ship is established between the spectral behavior of lahars enhanced by the VPCA and the NDLI. From the above analysis, we conclude that the VPCA and the NDLI set the basis to segment lahar deposits by means of maximum spectral separation with respect to the rest of the image components. While the VPCA is not easily available in commercial software, the NDLI is readily calculated from a simple relationship of the original bands 3 and 4.
Fieldwork validation
The fieldwork details are as follows. To verify the results derived from NDLI, final images from the NDLI (Figure 9) were loaded into a Geo–Positioning System (GPS) Juno SC–Trimble Handheld with 1.5 meters of accuracy. Fifteen ground control points (GCP) were randomly selected along the principal ravines (lahar areas and no lahar areas).
These GCP were dubbed COL10–i, i = 1 – 15. A general field description at each site was annotated for each GCP. For the NDLI, 80% of the points were indeed verified as lahars, while for VPCA the success rate was 60%.
In particular, from those GCP, the control points COL 10–1 and COL 10–2 correspond to a topographic change from the distal limit of the ravine to the beginning of its depositional fan (Figure 10). The transect dimension defined by COL10–1 and COL10–2 is 260 m long. According with this field description, the depositional fan is cut off by parallel gullies that expose a sequence of recent lahar deposits. This sequence is up to 3.5 m thick and is composed by a sequence of heterolithological units of massive, matrix–supported debris flows deposits with clasts up to 6 cm in diameter. Clast–supported layers constitute the top of this deposit with fragments up to 30 cm in diameter. Thus, based on the spectral enhancement of lahars by the NDLI and the high rate of success, we conclude that their field identification might be easily achieved.
Fieldwork was concentrated along main ravines on the southern flank of the volcano. In such areas, the slope varies between 35° and 40° from the summit at 3850 to 3200 m above sea level, and decreases to ~10° at its base, at 2500 m. In areas more distal from the summit (up to 20 km), slope progressively decreases to lower values. Lahars mainly occur at the distal end of the main ravines, where they open up to form alluvial fans that result from the deposition of several units of debris flow deposits, as is the case at the San Antonio and Montegrande ravines. In particular, at the distal portion of main ravines, lahar deposition forms wide fans.
Spatial and temporal distribution of lahars
The validity of the NDLI as a spectral enhancer of lahars was explained in previous sections. Therefore, we may use this index to segment areas occupied by lahars in two different periods linked probably to dissimilar volcanic activity. In order to assess the spatial distribution of lahars enhanced by the NDLI, a spatial comparison of Spot images from different years (2004 and 2009) was carried out. The lahars were spectrally enhanced by means of the NDLI. Thus, the images resulting from the NDLI (Figure 9) were introduced into a region growth algorithm (RHSEG) (Tilton, 2006). The RHSEG algorithm produces a set of clusters that are easily associated with lahars. From this, two binary images were produced, one for the year 2004 and the other for the year 2009. The binary images represent the segmentation of lahars. Both segmentations were spatially overlapped using the Geographic Information System ArcGis 9.3 (Figure 10). In the image of 2004, the NDLI shows a good spatial definition of alluvial fans related to lahar events. While in the 2009 image, it is possible to detect the formation of new erosive channels associated to a higher lahar frequency along the San Antonio ravine. At the end of the Montegrande ravines, it is clear that a large fan formed by several epiclastic deposits originated from intense laharic activity. A detailed fieldwork was undertaken to corroborate the above statements. Figure 11 shows a spatial view of lahar deposits of such image segmentation.
DISCUSSION
Spectral behavior of lahar deposit
In the following discussion, we focus on the relative spectral differences between coverage deposits, which imply that no absolute reflectance values are required. The spectral difference is preserved whether as reflectance values or as digital number (DN) values. To evaluate the relative spectral differences between superficial deposits, a kernel of 3 × 3 was slipped over representative areas of each kind of deposit to obtain an average of the digital number (DN) of a pixel from Terra/Aster images. Thus, the considered coverages were: 1) lahar deposits, 2) undifferentiated deposits, 3) and pyroclastic flows (Figure 12). The spectral behavior of such coverages is as follows. These three spectral coverages show a similar spectral behavior, with a maximum difference between bands 3 and 4. This spectral difference is characterized as follows: for lahar deposits, signature (1) presents a maximum of 120 DN in band 3 and 49 DN in band 4. In the case of undifferentiated deposits (2) similar values are observed. However, signature of pyroclastic deposits (3) presents the highest difference at a maximum of 229 DN in band 3 and 57 DN in band 4. The lahar deposits present a similar curve behavior with respect to spectral coverages (1) and (2) but with lower DN values; this is because the pyroclastic flow deposits are the source material for a lahar event because they are easily remobilized as lahars during rainy seasons.

The similar curve behavior of these three spectral coverages is a fact that can be related to their spectral properties, which means that their monolitologic composition determines the spectral behavior. As mentioned previously, the Colima Volcano composition is predominantly andesitic; thus, the spectral behavior of andesite is expected in the three cases. The normalized andesite signatures (AHA–h1, AHA–h2, AHA–h3) were extracted from the Terra/Aster spectral library (Balbridge et al., 2009) (Figure.13). The andesite signature was compared with respect to Terra/Aster and Spot 5 images, considering the spectral coverages 1 to 3 previously defined (Figure 12). According to Figure 13, for Terra/Aster and Spot 5 images, the lahar curve presents a similar behavior as the andesite curve. Nonetheless, a change of slope from 0.8 to 1.5 ¿im is observed in both cases. The spectral difference among bands 3 and 4 matches the change of slope previously mentioned when comparing the lahars curve in Figure 12.
Since the spectral difference is the highest among bands 3 and 4 for lahar deposits, this enables us to con–clude that the NDLI allows the spectral separation of lahar deposits from the rest of the spectral coverages in the study area.
SUMMARY AND CONCLUSION
A Normalized Difference Lahar Index (NDLI) was generated on the basis of Principal Component Analysis (PCA). These transformations indicate that a normalized relationship of bands 3 and 4 for Terra/Aster and Spot images produces a spectral enhancement of lahar deposits linked to remobilization of older pyroclastic flow deposits during rainfall events. For the ratification of NDLI we have realized a statistical validation based on a comparison between NDLI and Variant of Principal Component Analysis (VPCA), fieldwork and spatial distribution of lahar deposits of different volcanic periods. Thus, the statistical validation is based on the correlation coefficient of NDLI with VPCA, which shows the highest values for lahar deposits on Spot 5 images (S1, S2). Furthermore, on the basis of fieldwork validation, 80% accuracy was obtained. The spatial distribution of lahars obtained with NDLI, permitted to get a better segmentation of lahar flow paths on Spot 5 images (S1, S2) in comparison with Terra/Aster images (A1 and A2); specifically for S1 where new erosive channels linked to the highest lahar frequency along San Antonio Ravine were detected. The detection of this change would not have been possible using the original bands.
The spectral comparison between relative signatures of volcanic deposits extracted from Terra/Aster images with respect to the andesite signature obtained from the Terra/ Aster library showed the influence of the monolithologic composition at Colima Volcano. All signatures presented a similar behavior, it means the same change of slope from 0.8 to 1.5 um and corresponding with the original bands 3 and 4 (both Spot 5 and Terra/Aster).
Therefore, the NDLI is a useful technique and can be applied in volcanoes with a high explosive component such as the Colima Volcano or in volcanic areas with difficult access. The monitoring of remote sensing information can be a very useful tool during a volcanic crisis to detect potential inundation areas by lahar events.
ACKNOWLEDGEMENTS
This study is part of the project: DGAPA–UNAM IN123209. We gratefully acknowledge the Secretaría de Marina, which provided the Spot 5 data. Professor Tilton of NASA–JPL kindly provided a temporary license of the software RHSEG. The authors thank to the reviewers S. V. Smith, C. Puente, and A. Hinojosa for their helpful and constructive reviews. Finally, we would like thank A. Martin, RMCG editor, for his valuable comments to improve this work.
REFERENCES
Balbridge, A.M., Hook, S.J., Rivera, G., 2009, The ASTER spectral library version 2.0: Remote Sensing of Environment, 113, 711–715. [ Links ]
Capra, L., Borselli, L., Varley, N., Norini, G., Gavilanes, J.C., Sarocchi, D., Caballero, L., 2010, Rainfall–triggered lahars at Volcán de Colima, Mexico: surface hydro–repellency as initiation process: Journal of Volcanology and Geothermal research, 189(1–2), 105–117. [ Links ]
Chorowicz, J., López, E., Garcia, F., Parrot, J.F., Rudant, J.P., Vinluan, R., 1997, Keys to analyze active lahars from Pinatubo on SAR ERS imagery: Remote Sensing of Environment, 62, 20–29. [ Links ]
De la Cruz–Reyna, C., 1993, The historical eruptive activity of Colima Volcano, Mexico: Journal of Volcanology and Geothermal Research, 55, 51–58. [ Links ]
Flynn, L.P., Mouginis–Mark, P.J., Horton, K.A., 1994, Distribution of thermal areas on an active lava flow field: Landsat observations of Kilauea, Hawaii, July 1991: Bulletin of Volcanology, 56, 284–296. [ Links ]
Flynn, L.P., Harris, A.J.L., Wright, R., 2001, Improved identification of volcanic features using Landsat 7 ETM+: Remote Sensing of Environment, 78, 180–193. [ Links ]
Hubbard, B.E., Sheridan, M.F., Carrasco–Núñez, G., Díaz–Castellón, R., Rodríguez, S.R., 2007, Comparative lahar hazard mapping at Volcán Citlaltépetl, Mexico using SRTM, ASTER and DTED–1 Digital Topographic Data: Journal of Volcanology and Geothermal Research, 60, 99–124. [ Links ]
Huggel, C., Schneider, D., Miranda, J., Delgado, H., Kääb, A., 2008, Evaluation of ASTER and SRTM DEM data for lahar modeling: A case study on lahars from Popocatépetl Volcano, Mexico; Journal of Volcanology and Geothermal Research, 170, 99–110. [ Links ]
Kauth, R.J., Lambeck, P.F., Richardson, W., Thomas, G.S., Pentland, A.P., 1979, Feature extraction applied to agricultural crops as seen by Landsat, in Proceedings of the Large Area Crop Inventory Experiment (LACIE) Symposium, Houston TX, NASA/Johnson Space Center, 705–721. [ Links ]
Kerle, N., Oppenheimer, C., 2002, Satellite Remote Sensing as a Tool in Lahar Disaster Management: Disasters, 26(2), 140–160. [ Links ]
Kerle. N., Van Wyk de Vries, V., Oppenheimer. C., 2003, New insight into the factors leading to the 1998 flank collapse and lahar disaster at Casita Volcano, Nicaragua: Bulletin of Volcanology, 65, 331–345. [ Links ]
Lira, J., 2006, Segmentation and morphology of open water bodies from multispectral images: International Journal of Remote Sensing, 27 (18), 4015–4038. [ Links ]
Lira, J., 2010, Tratamiento digital de imágenes multiespectrales: Universidad Nacional Autónoma de México, 632 pp. [ Links ]
Lira, J., García, E., 2003, Characterization of vegetation in the south of Mexico by means of a canonical expansion: International Journal of Remote Sensing, 24, 1083–1093. [ Links ]
López, E.D., Chorowicz, J., García, F., Parrot, J.F., Vinluan, R.J.N., 1996, Mount Pinatubo lahar damage assessment using ERS–1 synthetic aperture radar data: International Archives of Photogrammetry and Remote Sensing, 31, part B7, 434–447. [ Links ]
López, E.D., Vinluan, R. J. N., Paringit, E. C., 1998, Lahar damage assessment using satellite remote sensing: The Mount Pinatubo experience, in Proceedings of the Workshop on Information Technology Tools for Natural Disaster Risk Management, Bangkok, February 4–6: International Center for Disaster–Mitigation Engineering (INCEDE) of the University of Tokio, United Nations University (UNU). Asian Center for Research on Remote Sensing (ACRoRS), 175–182. [ Links ]
Mouginis–Mark, M.J., Rowland, K.S., Garbeil. H., Amelung. F., 2001, Topographic change on volcanoes from SRTM and other inteferometric radars, in International Geoscience and Remote Sensing Symposium (IGARSS), Sidney, July 9–13: Institute of Electrical and Electronics Engineers (IEEE) Conference Proceedings, no. 2, 757–758. [ Links ]
Oppenheimer, C., 1991, Lava flow cooling estimated from Landsat Thematic Mapper infrared data: the Lonquimay eruption: Journal of Geophysical Research, 96, 21865–21878. [ Links ]
Oppenheimer, C., Francis, P., 1997, Remote sensing of heat, lava, and fumarole emissions from Erta 'Ale Volcano, Ethiopia: International Journal of Remote Sensing, 18, 1661–1692. [ Links ]
Pierson, T. C., 1985, Initiation and flow behavior of the 1980 Pine Creek and Muddy River lahars, Mount St. Helens, Washington: Geological Society of American Bulletin, 96, 1056–1069. [ Links ]
Richards, J.A., Jia, X., 1999, Remote sensing digital image analysis: An introduction: Berlin, Heidelberg, Springer–Verlag, 363 pp. [ Links ]
Robin, C., Mossand, P., Camus, G., Cantagrel, J.M., Gorgaud., A., Vincent, P.M., 1987, Eruptive history of the Colima volcanic complex (Mexico): Journal of Volcanology and Geothermal Research, 31, 99–113. [ Links ]
Rothery, D.A., Borgia, A., Carlton, R.W., Oppenheimer, C.,1992, The 1992 Etna lava flow imaged by Landsat TM: International Journal of Remote Sensing, 13, 2759–2763. [ Links ]
Saucedo–Girón, R., 2000, Erupciones de 1991 y 1998–1999 del Volcán de Colima: mecanismos de transporte y depositación de los flujos piroclásticos y de bloques y ceniza: Universidad Nacional Autónoma de México, Posgrado en Ciencias de la Tierra, Ph. D. Thesis, 132 pp. [ Links ]
Scott, K.M., 1988, Origins, behavior, and sedimentology of lahars and lahar–runout flows in the Toutle–Cowlitz River System: United States Geological Survey, Professional Paper 1447–A, 74 pp. [ Links ]
Stevens, N.F., Wadge, G., William, C. A., 2001, Post–emplacement lava subsidence and the accuracy of ERS InSAR digital elevation models of volcanoes: International Journal of Remote Sensing, 22(5), 819– 828. [ Links ]
Tilton, J.C., 2006, RHSEG User's Manual: National Aeronautics and Space Administration, 53 pp. [ Links ]
Tilton, J.C., Lawrence, W.T., Plaza, A.J., 2006, Utilizing hierarchical segmentation to generate water and snow masks to facilitate monitoring change with remotely sensed image data: GIScience and Remote Sensing, 43, 39–66. [ Links ]
Torres, R.C., Self, S., Martínez, M.L., 1996, Secondary pyroclastic flows from the June 15, 1991, ignimbrite of Mount Pinatubo, in Newhall, C.G., Punongbayan, R.S. (eds.), Fire and mud: Eruptions and lahars of Mount Pinatubo, Philippines: Seattle, University of Washington Press and Philippine Institute of Volcanology and Seismology, 665– 678. [ Links ]
Torres, R., Mouginis–Mark, P., Self, S., Garbeil, H., Kallianpur, K., Quiambao, R., 2004, Monitoring the evolution of the Pasig–Potrero alluvial fan, Pinatubo Volcano, using a decade of remote sensing data: Journal of Volcanology and Geothermal Research, 138, 371–392. [ Links ]
Van Wyk de Vries, B., Kerle N., Petley, D., 2000, Sector collapse forming at Casita Volcano, Nicaragua: Geology, 28( 2), 167–170. [ Links ]
Wooster, M.J., Rothery, D.A., 1997, Thermal monitoring of Lascar Volcano, Chile, using infrared data from the along–track scanning radiometer: a 1992 – 1995 time series: Bulletin of Volcanology, 58, 566–579. [ Links ]
Wooster, M.J., Kaneko, T., Nakada, S., Shimizu, H., 2000, Discrimination of lava dome activity styles using satellite–derived thermal structures: Journal of Volcanology and Geothernal Reseach, 102, 97–118. [ Links ]

