


Servicios Personalizados
Revista
Articulo
 Inglés (pdf)
  Artículo en XML
 Referencias del artículo
 Enviar artículo por email
Indicadores
 Citado por SciELO
 Accesos
Links relacionados
 Similares en SciELO
Compartir

 Permalink
Economía: teoría y práctica
versión On-line ISSN 2448-7481versión impresa ISSN 0188-3380
Econ: teor. práct no.35 México jul./dic. 2011
Does Innovation Performance Depend on Economic Growth? The Case of a Country in Transition*
Andrzej H. Jasinski
** Head, Unit for Innovation and Logistics, School of Management, Universidad de Varsovia, Szturmowa Street 1/3, 02–678. Warsaw, Poland. E–mail: ahj@onet.pl
*Fecha de recepción: 31/12/2010
Fecha de aceptación: 05/07/2011
ABSTRACT
This paper is an attempt to analyze a possible influence of economic growth on innovation performance. Econometric model based on principal component analysis is the research tool. Poland, as a country in transition, is here a case–study. The analysis has confirmed an interesting pattern: in 1989–2007, corporate innovation performance was changing, in principle, in the same direction as macro–economic changes but with a one–to–two–year delay. This is some proof that the innovation activity followed the cyclical development of the national economy. Innovation performance was demand–driven, i.e., pulled by demand resulting from the economy's recovery and high economic growth. So, technological innovation appeared to be highly sensitive to the general economic situation in Poland as a transitional economy. Economic growth seems to be a kind of tag–boat pulling innovation activities in the business sector.
Keywords: economic growth, innovation performance, country in transition.
Clasifficaction JEL: O33.
RESUMEN
Este artículo intenta analizar una posible influencia del crecimiento económico en el desempeño de la innovación. La herramienta de investigación empleada es el modelo econométrico basado en un componente principal de análisis. El estudio de caso es Polonia, una economía en transición. El análisis ha confirmado un patrón interesante: durante el periodo 1989–2007, el desempeño de la innovación cambió, en principio, en la misma dirección que los cambios macroeconómicos pero con un retraso de uno a dos años. Esto muestra de algún modo que la actividad innovadora correspondió al desarrollo cíclico de la economía nacional. El desempeño innovador se orientó por la demanda, es decir, una demanda impulsada por la recuperación económica y el alto crecimiento económico. Por lo tanto, la innovación tecnológica parece ser muy sensible a la situación económica en general de Polonia, como economía en transición. El crecimiento económico parece ser una especie de motor que impulsa las actividades innovadoras del sector de negocios.
Palabras clave: crecimiento económico, desempeño de la innovación, país en transición.
Clasificación JEL: O33.
I. A LITERATURE REVIEW
The main aim of this paper is to analyze basic relationships between technological innovation1 and economic growth or, in other words, relationships between innovation performance and macro–economic performance.
Two aspects of this issue can potentially be considered:
1) The influence of innovation on economic growth and
2) The reverse dependence, i.e. the influence of economic growth on innovation. Here, the second aspect of this problem is the subject of interest.
It was Schumpeter who pointed out that innovation is the engine of economic development. Following his thesis, numerous studies were conducted afterwards to analyze the place of technical change in economic growth.
This issue has usually been considered in the context of the Solow's (1957) aggregate growth model based on the concept of the Cobb–Douglas production function. He constructed a three–factor model, subsequently extended by various authors to a four– or even a five–element function where technological change is a kind of a residual part.
According to Freeman (2006), what it meant so far as the process of technical change was concerned, is extraordinary difficult to measure in quantitative terms. I. Adelmann (1961, p. 9), in her discussion of models of economic growth, used the five–element formula:
Yt= ƒ (Kt Nt Lt St Ut)
where:
• Kt denotes the amount of the services of the capital stock at time t
• Nt stands for the rate of the use of natural resources
• Lt represents the employment of the labour force
• St represents 'society's fund of applied knowledge'
• Ut represents the 'social–cultural milieu' within which the economy operates.
It is difficult enough to measure St, although some progress has been made in this direction but Adelmann accepted that it is even more difficult and perhaps impossible to measure Ut. However, the fact that some of these variables cannot be quantified satisfactory does not mean that they can simply be ignored.
Recently, according to the new theory of economic growth (Romer, 1986; Barro and Martin, 1995; Von Tunzelmann, 1995), an economic role of innovation is usually assessed through the prism of the concept of total factor productivity (TFP). An increase of TFP is interpreted, simplifying, as a coefficient informing us about the rate of improvement in efficiency due to new technologies.
Such approach may be named as an exogenous approach because it assumes that innovation is here an exogenous (independent) variable being one of the reasons of economic growth which, in such model, is treated as an endogenous (dependent) variable.
Let's now check whether there is a reverse relationship. So, a question emerges: Does innovation performance depend on economic growth? If we get an answer 'yes', it will mean that the following economic mechanism exists:
• High growth of the national economy usually means a sound economic situation, prosperity, good climate in the business sector.
• This evokes an optimism among entrepreneurs who positively look to the future.
• This, in turn, stimulates their pro–investment inclinations, including higher expenditures on innovation activities.
• In result, the growth of innovations appears.
An inspiration to such way of thinking can be found in the evolutionary theory by Nelson and Winter (1982). The essence of their An Evolutionary Theory of Economic Change is the recognition of market competition as dynamic evolution; it goes beyond the conventional framework based on perfectly competitive equilibrium. The evolutionary theory, from the view–point of the behavioral science of firms, reveals an endogenous understanding of research and development in firms and thus endogenous recognition of the field of innovation.
In short, it may be said that innovation dynamism depends to some extent on macro–economic dynamism. So, in this sense, this is an endogenous approach.
Recently, Hirooka (2006) seems to remain under the impression of the evolutionary theory when he writes that innovations selectively develop on the upswing of prosperity and their diffusion is affected by economic conditions.
'The diffusion of innovation is easily retarded by economic turbulence and resumes the original diffusion rate when the economy recovers to a sound condition' (p. 50). Of course, according to Hirooka's Innovation Dynamism and Economic Growth, innovation per se is the source of economic development.
In analyzing an influence of economic growth on innovation performance, let us use a case–study of Poland being a country in transition.
II. INNOVATION PERFORMANCE IN POLAND
In order to answer the question: What changed in the field of technological innovation in Poland in 1989–2007?, let's have a look at Table 1. The table shows that:

• As far as new and modernized products development is concerned (column 2), substantial improvement was achieved from 3.0% in 1990 to 9.5% in 1999, and then the newly calculated by Gus (Central Statistical Office) indicator2 stabilized at average level of 18.4% which may be estimated as 6.1% in terms of the old definition;
• So–called innovation intensity (column 3) was declining at the beginning of the period, then improved between 1994 and 1999, and from 2000 shows a slight decline year by year, and so returned to the level achieved in 1994;
• Technology–transfer processes, measured here by the number of firms participating in domestic transfers of technology (column 4), showed a tendency to decline in 1996–1999 and then, from 2000, its scale is bigger and bigger with slight fluctuations;
• Both domestic patent submissions (column 5) and patents issued (column 6) tend to decrease during the whole period analyzed, although the latter started to increase from 2004;
• The growth rate of total factor productivity (TFP) shows no visible tendency (column 7).
Summarizing, in the period of transition, Poland did not achieve significant improvement in innovation performance. The general picture of changes is ambiguous: neither good nor bad; both positive and negative tendencies can be identified. At the same time, several indicators showed no visible change.
However, one must remember that inflows of new technologies via foreign direct investments to Poland intensified throughout the whole period: from ca 100 mln USD in 1990 to over 110 bln USD, cumulatively in 2007 (GUS, 2008), which played some positive role in modernizing the national economy.
Moreover, it is hard to say whether Poland's accession to the European Union (EU) caused any improvement in innovation performance. Firstly, the membership period is too short to observe any tendencies: the first full year of Poland's membership was 2005, and secondly, there is no clear evidence of changes in 2004–2007; full statistical data on S&T in 2008 and 2009 are not available yet.
III. THREE RESEARCH QUESTIONS
In order to analyze an influence of economic growth on innovation, we must first answer three questions:
1) How to measure economic growth?
2) How to express innovation performance?
3) How to describe relationships between the growth and innovation?
In relation to 1): economic growth will here be expressed by the gross domestic product (GDP) growth rate, as is usually done in the literature. Data for Poland in 1989–2007 are shown in Table 2.

On the basis of this table, the following stages of economic growth in Poland in 1989–2007 can be distinguished:
• Recession (1989–1991)
• Recovery (1992–1994)
• High growth (1995–1997)
• Slow down (1998–2000)
• Slow growth (2001–2002)
• Recovery (2003–2005)
• High growth (2006–2007)
In relation to 2): there is no single, universal indicator of a country's innovation performance. Not even TFP will do. After a deep survey of the Polish statistics of science and technology run by GUS, only three yardsticks regarding innovation performance were available for the whole period 1989–2007. These are as follows:
1) The share of new and modernized products in aggregate industrial output (x1),
2) The share of high–tech products in total exports (x2) and
3) The share of corporate expenditures on innovation activities in aggregate industrial output or innovation intensity (x3).
None of them can separately explain the development of innovation performance.
One can have some reservations towards these yardsticks. First two of them represent an innovation output while the third one represents a kind of innovation input. However, innovation intensity is universally treated as a good indicator for firms' innovative activities (OsloManual, 2005).
Moreover, it turned out that the first indicator had been calculated – till 2001 – as the share of new and modernized products launched in a given year and – since 2000 – as the share of such products launched within last three years. This change in the statistics methodology made it impossible to establish comparable time–series of this variable for the whole analysed period. Therefore, it was necessary to divide the period and run analyses for two over–lapping sub–periods: (a) 1989–2001 and (b) 2000–2007.
Principle component analysis (PCA) was applied to choose the combination of these measurements, e.g., first principal component (PC), that best describes the course of a given phenomenon, in this case of innovation performance.
In relation to 3): the basic research tool was the econometric model based on PCA (see, e.g., Morrison, 1976). Indeed, we did not find in the literature, at least in the Polish one, publications on econometric analysis of an influence of economic growth on innovation performance.3
IV. THE RELATIONSHIPS IN 1989–2001
Table 3 contains relevant time–series for the first sub–period, i.e. 1989–2001.

The results of constructing the first principal component PC(a) for 19892001 are shown in Table 4. The calculations were conducted using the partial least squares method.

The form of the PC(a) function for 1989–2001 is as follows:

The variability coefficient (64.63%) seems sufficiently high. For an easier interpretation, the coefficients were multiplied by –1, so then an increase in this function may be interpreted as an increase in innovation performance. The values of this new first principal component for 1989–2001 are presented in Table 5. A curve of PC(a), shown alongside the GDP growth curve, is presented in Figure 1.

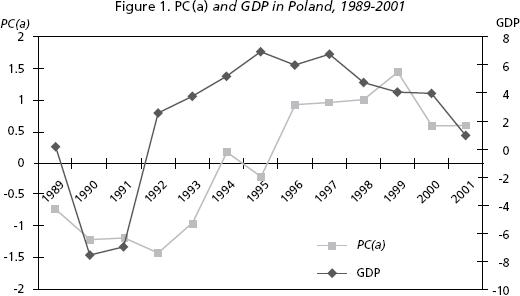
For a further analysis, a linear econometric model has been constructed where PC(a) is a dependent variable, and a GDP growth rate with various delays (PKBt, PKBt–1, PKBt–2) is an independent variable. After using the step backward method for selection of variables, the following equation has been received:

where PKB means a GDP growth rate.
Detailed reports concerning this model are presented in Appendix 1.
As can be seen from the figure, the growth in PC(a) values shows many similarities to the dynamics of GDP growth. The curve representing innovation performance behaves in a similar manner to that of macro–economic development, although PC(a) responds to a GDP increase/decrease with a certain displacement. So, we can say that, in 1989–2001, innovation performance in Poland developed parallel to the country's macro–economic performance, but – according to model (2) – with a two–year delay.
V. THE RELATIONSHIPS IN 2000–2007
Let's now come to the second sub–period. Table 6 contains relevant time–series for 2000–2007.

The results of constructing the first principal component PC(b) for 20002007 are shown in Table 7.

The form of the PC(b) function for 2000–2007 is as follows:

The variability coefficient (50.66%) is quite high, too. The values of this first principal component for 2000–2007 are presented in Table 8. A curve of PC(b), shown alongside the GDP growth curve, is presented in Figure 2.


For a further analysis, a linear econometric model has been constructed where PC(b) is a dependent variable, and a GDP growth rate with various delays (PKBt, PKBt–1, PKBt–2) is an independent variable. After using the step backward method for selection of variables, the following equation has been received:

Detailed reports concerning this model are presented in Appendix 2.
The conclusions are very similar to those for the previous sub–period. So, in 2000–2007, innovation performance in the country developed parallel to its macro–economic performance, this time – according to model (4) – with a one–year delay.
VI. THE RELATIONSHIPS IN THE WHOLE PERIOD: 1989–2007
A full picture of innovation performance against the background of GDP for the whole period 1989–2007 is shown in Figure 3. An easily seen difference between the values of PC(a) and PC(b) is a proof that the division into two sub–periods was justified. Moreover, a deeper econometric analysis of both functions has been done and included in: Jasinski and Manikowski (2010). It confirms the conclusions contained earlier in this paper.
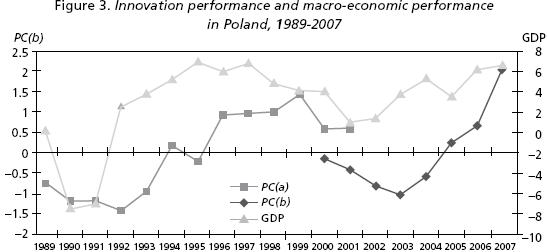
However, due to relatively short time–series, especially for 2000–2007, conclusions must be very guarded. So, let us wait for relevant statistical data on science and technology in Poland in 2008–2010. Then we shall have the longer, i.e., eleven–element time–series. Moreover, due to the global economic crisis, GDP growth rate dropped in Poland too, and probably pulled down innovation performance although with a slight lag. Our model confirms this (see Table 9).
Table 9 shows that the falling innovation performance, measured by first principal component PC (b),4 accompanied the declining GDP growth rate in 2008–2009. In turn, the economic growth rate forecasted for 2010 shows a slight increase in comparison with 2009 while PC(b) continues to decline (the third year in turn).
CONCLUSIÓN
In summary, the analyses confirm an interesting pattern: in 1989–2007, corporate innovation performance was changing, in principle, in the same direction as macro –economic changes but with a one–to–two–year lag. This is some proof that the innovation activity followed the cyclical development of the national economy. Innovation performance was demand–driven, i.e., pulled by demand resulting from the economy's recovery and high economic growth. So, technological innovation appeared to be highly sensitive to the general economic situation in Poland as a transitional economy.
The above conclusion brings a positive answer to the question posed at the beginning of this section and thus seems to confirm the existence of the economic mechanism described there: economic growth is a kind of tug–boat pulling innovation activities in the business sector.
REFERENCES
Adelmann, Irma (1961), Theories of Economic Growth and Development, Stanford University Press, Stanford. [ Links ]
Barro, Robert, and Xavier Sala–I–Martin (1995), Economic Growth, McGraw–Hill, New York. [ Links ]
ECORYS (2007), ICT, Innovation and Economic Growth in Transition Economies, The World Bank. [ Links ]
GUS (1999,..., 2008), Science and Technology in Poland (Statistical Yearbooks), Glowny Urzad Statystyczny, Warsaw. [ Links ]
–––––––––– (2009), Rocznik statystyczny 2009, Glowny Urzad Statystyczny, Warsaw. [ Links ]
Hirooka, Masaaki (2006), Innovation Dynamism and Economic Growth: A Non–linear Perspective, Edward Elgar, Cheltenham. [ Links ]
Jasinski, Andrzej H. (2003), "Has Innovation Policy an Influence on Innovation? The Case of a Country in Transition", Science and Public Policy, Vol. 30, No. 6, december. [ Links ]
–––––––––– (2004), "Innovation Performance and Public Policy in Transition: The Polish Perspective", International Journal of Technology and Globalization, No. 1. [ Links ]
–––––––––– (2006), Integrating Science and Technology in Eastern Europe with Western Europe: Dissimilarities, Challenges and Recommendations, VEST, No. 3–4. [ Links ]
–––––––––– and Arkadiusz Manikowski (2010), "Dokonania innowacyjne a wzrost gospodarczy", in Jasinski, A. H., ed.: Innowacyjnosc polskiej gospodarki w okresie transformacji, The Warsaw University Press, Warsaw. [ Links ]
–––––––––– (ed.) (2002), Innovation in Transition: The Case of Poland, The Warsaw University Press, Warsaw. [ Links ]
–––––––––– (ed.) (2004), Transition Economies in the European Research and Innovation Area: New Challenges for Their Science and Technology, The Warsaw University Press, Warsaw. [ Links ]
Morrison, Donald (1976), Multivariate Statistical Methods, New York, McGraw–Hill. [ Links ]
Nelson, Richard, and Sidney Winter (1982), An Evolutionary Theory of Economic Change, Harvard University Press, Cambridge, Ma. [ Links ]
Oslo Manual (2005), OECD, Paris. [ Links ]
Romer, Paul (1986), "Increasing Returns and Long Run Growth", Journal of Political Economy, No. 94, october. [ Links ]
Solow, Robert (1957), "Technical change and the aggregate production function", Review of Economics and Statistics, No. 39. [ Links ]
Von Tunzelmann, G. N. (1995), Technology and Industrial Progress: The Foundations of Economic Growth, Aldershot, Edward Elgar. [ Links ]
Weresa, Marzzena Anna, ed. (2006), Polska. Raport o konkurencyjnosci, SGH, Warsaw. [ Links ]
NOTAS
* Una versión previa fue presentada en la VII Conferencia Triple Helix, Glasgow, 17–19 de junio de 2009.
1 Concepts of 'technological innovation' and 'technological change' will here be used interchangeably, although the latter is a bit broader.
2 More explanations further.
3 In the recent World Bank publication on ICT, Innovation and Economic Growth in Transition Economies (ECORYS, 2007), its authors don't make an attempt to determine quantitative relationships between innovation and economic growth in the countries analysed.
4 Based on model (3) above.

