<?xml version="1.0" encoding="ISO-8859-1"?><article xmlns:mml="http://www.w3.org/1998/Math/MathML" xmlns:xlink="http://www.w3.org/1999/xlink" xmlns:xsi="http://www.w3.org/2001/XMLSchema-instance">
<front>
<journal-meta>
<journal-id>0188-3380</journal-id>
<journal-title><![CDATA[Economía: teoría y práctica]]></journal-title>
<abbrev-journal-title><![CDATA[Econ: teor. práct]]></abbrev-journal-title>
<issn>0188-3380</issn>
<publisher>
<publisher-name><![CDATA[Universidad Autónoma Metropolitana, a través de la Unidad Iztapalapa, la Unidad Azcapotzalco y la Unidad Xochimilco, División de Ciencias Sociales]]></publisher-name>
</publisher>
</journal-meta>
<article-meta>
<article-id>S0188-33802015000200005</article-id>
<title-group>
<article-title xml:lang="en"><![CDATA[Redistribution of Taxes and Benefits in Mexico: Evaluation of the 2014 Fiscal Reform on Households]]></article-title>
<article-title xml:lang="es"><![CDATA[Redistribución de los impuestos y beneficios en México: Evaluación de la reforma fiscal de 2014 en el ingreso familiar]]></article-title>
</title-group>
<contrib-group>
<contrib contrib-type="author">
<name>
<surname><![CDATA[Huesca]]></surname>
<given-names><![CDATA[Luis]]></given-names>
</name>
<xref ref-type="aff" rid="A01"/>
</contrib>
<contrib contrib-type="author">
<name>
<surname><![CDATA[Robles Valencia]]></surname>
<given-names><![CDATA[Arturo]]></given-names>
</name>
<xref ref-type="aff" rid="A02"/>
</contrib>
<contrib contrib-type="author">
<name>
<surname><![CDATA[Araar]]></surname>
<given-names><![CDATA[Abdelkrim]]></given-names>
</name>
<xref ref-type="aff" rid="A03"/>
</contrib>
</contrib-group>
<aff id="A01">
<institution><![CDATA[,Centro de Investigación en Alimentación y Desarrollo A. C.  ]]></institution>
<addr-line><![CDATA[Hermosillo Sonora]]></addr-line>
<country>México</country>
</aff>
<aff id="A02">
<institution><![CDATA[,Universidad de Sonora Departamento de Economía ]]></institution>
<addr-line><![CDATA[Hermosillo Sonora]]></addr-line>
<country>México</country>
</aff>
<aff id="A03">
<institution><![CDATA[,Universite Laval Departament d'économique ]]></institution>
<addr-line><![CDATA[Quebec ]]></addr-line>
<country>Canadá</country>
</aff>
<pub-date pub-type="pub">
<day>00</day>
<month>12</month>
<year>2015</year>
</pub-date>
<pub-date pub-type="epub">
<day>00</day>
<month>12</month>
<year>2015</year>
</pub-date>
<numero>43</numero>
<fpage>103</fpage>
<lpage>131</lpage>
<copyright-statement/>
<copyright-year/>
<self-uri xlink:href="http://www.scielo.org.mx/scielo.php?script=sci_arttext&amp;pid=S0188-33802015000200005&amp;lng=en&amp;nrm=iso"></self-uri><self-uri xlink:href="http://www.scielo.org.mx/scielo.php?script=sci_abstract&amp;pid=S0188-33802015000200005&amp;lng=en&amp;nrm=iso"></self-uri><self-uri xlink:href="http://www.scielo.org.mx/scielo.php?script=sci_pdf&amp;pid=S0188-33802015000200005&amp;lng=en&amp;nrm=iso"></self-uri><abstract abstract-type="short" xml:lang="en"><p><![CDATA[We measured, for the first time, the general redistributive effect in the Mexican fiscal system with the Duclos-Jalbert-Araar decomposition approach, obtaining: vertical equity, horizonal inequity (HI) and reranking effect. The novelty of this application lies in the use of non-parametric techniques and the fact that we did not assume any functional relationship between the variables in our analysis. Our paper contributes with an assessment of the fiscal reform that took place in 2014 and compares it with the previous situation. A tax-benefit system with relative progressivity but high HI effect is found, as well as an increase on tax revenues up to 5.2 and 3.7 percent of GDP for income tax and VAT respectively.]]></p></abstract>
<abstract abstract-type="short" xml:lang="es"><p><![CDATA[Se mide por primera vez el efecto redistributivo general del sistema fiscal mexicano con el enfoque de descomposición Duclos-Jalbert-Araar, que obtiene: equidad vertical, inequidad horizontal (HI) y efecto de reordenación. La novedad reside en el uso de técnicas no paramétricas y que no se asume a ninguna relación funcional entre las variables. Se contribuye a generalizar una medición de qué tan progresivo y recaudatorio es el sistema fiscal actual de Méxicano y evaluar la situación simulada de la reforma fiscal de 2014. Los resultados determinan una progresividad relativa con un alto efecto de HI con la reforma fiscal y un incremento de recursos tributarios en 5.2% y 3.7% del PIB en impuesto sobre la renta e IVA respectivamente.]]></p></abstract>
<kwd-group>
<kwd lng="en"><![CDATA[progressivity]]></kwd>
<kwd lng="en"><![CDATA[redistribution]]></kwd>
<kwd lng="en"><![CDATA[vertical equity]]></kwd>
<kwd lng="en"><![CDATA[horizontal inequity]]></kwd>
<kwd lng="en"><![CDATA[non-parametric analysis]]></kwd>
<kwd lng="es"><![CDATA[progresividad]]></kwd>
<kwd lng="es"><![CDATA[redistribución]]></kwd>
<kwd lng="es"><![CDATA[equidad vertical]]></kwd>
<kwd lng="es"><![CDATA[inequidad horizontal]]></kwd>
<kwd lng="es"><![CDATA[análisis no paramétrico]]></kwd>
</kwd-group>
</article-meta>
</front><body><![CDATA[  	    <p align="center"><font face="verdana" size="4"><b>Redistribution of Taxes and Benefits in Mexico: Evaluation of the 2014 Fiscal Reform on Households*</b></font></p>      <p>&nbsp;</p>  	    <p align="center"><font face="verdana" size="3"><b>Redistribuci&oacute;n de los impuestos y beneficios en M&eacute;xico: Evaluaci&oacute;n de la reforma fiscal de 2014 en el ingreso familiar</b></font></p>  	    <p>&nbsp;</p>  	    <p align="center"><font face="verdana" size="2"><b>Luis Huesca,** Arturo Robles Valencia*** y Abdelkrim Araar****</b></font></p>  	    <p>&nbsp;</p>  	    <p align="justify"><font face="verdana" size="2"><i>** Corresponding author. Research profesor in Centro de Investigaci&oacute;n en Alimentaci&oacute;n y Desarrollo (CIAD) and D&eacute;partement d'&eacute;conomique, Universit&eacute; Laval research fellow.</i> E&#45;mail: <a href="mailto:lhuesca@ciad.mx">lhuesca@ciad.mx</a>.</font></p>  	    <p align="justify"><font face="verdana" size="2"><i>*** Associate professor in Departamento de Econom&iacute;a, Universidad de Sonora. M&eacute;xico,</i> E&#45;mail: <a href="mailto:artrobval@mail.com">artrobval@mail.com</a>. Arturo Robles is grateful to Consejo Nacional de Ciencia y Tecnolog&iacute;a (CONACYT) for his support under the Programa de Apoyos Complementarios para la Consolidaci&oacute;n Institucional de Grupos de Investigaci&oacute;n, modalidad Retenci&oacute;n no. 250476.</font></p>  	    <p align="justify"><font face="verdana" size="2"><i>**** D&eacute;partement d'&eacute;conomique, Universit&eacute; Laval, Poverty (PEP) and Centre sur le Risque, les Politiques Economiques et le Emploi (CIRPEE) research fellow.</i> E&#45;mail: <a href="mailto:Araar.Abdelkrim@ecn.ulaval.ca">Araar.Abdelkrim@ecn.ulaval.ca</a>.</font></p>  	    ]]></body>
<body><![CDATA[<p>&nbsp;</p>  	    <p align="justify"><font face="verdana" size="2">* Fecha de recepci&oacute;n: 07/10/2014.    <br> 	Fecha de aprobaci&oacute;n: 29/08/2015.</font></p>  	    <p>&nbsp;</p>  	    <p align="justify"><font face="verdana" size="2"><b>Abstract</b></font></p>  	    <p align="justify"><font face="verdana" size="2">We measured, for the first time, the general redistributive effect in the Mexican fiscal system with the Duclos&#45;Jalbert&#45;Araar decomposition approach, obtaining: vertical equity, horizonal inequity (HI) and reranking effect. The novelty of this application lies in the use of non&#45;parametric techniques and the fact that we did not assume any functional relationship between the variables in our analysis. Our paper contributes with an assessment of the fiscal reform that took place in 2014 and compares it with the previous situation. A tax&#45;benefit system with relative progressivity but high HI effect is found, as well as an increase on tax revenues up to 5.2 and 3.7 percent of GDP for income tax and VAT respectively.</font></p>  	    <p align="justify"><font face="verdana" size="2"><b>Keywords:</b> progressivity, redistribution, vertical equity, horizontal inequity, non&#45;parametric analysis.</font></p>  	    <p align="justify"><font face="verdana" size="2"><b>JEL classification:</b> D63, H22, H23, I32, C14.</font></p>  	    <p>&nbsp;</p>  	    <p align="justify"><font face="verdana" size="2"><b>Resumen</b></font></p>  	    ]]></body>
<body><![CDATA[<p align="justify"><font face="verdana" size="2">Se mide por primera vez el efecto redistributivo general del sistema fiscal mexicano con el enfoque de descomposici&oacute;n Duclos&#45;Jalbert&#45;Araar, que obtiene: equidad vertical, inequidad horizontal (HI) y efecto de reordenaci&oacute;n. La novedad reside en el uso de t&eacute;cnicas no param&eacute;tricas y que no se asume a ninguna relaci&oacute;n funcional entre las variables. Se contribuye a generalizar una medici&oacute;n de qu&eacute; tan progresivo y recaudatorio es el sistema fiscal actual de M&eacute;xicano y evaluar la situaci&oacute;n simulada de la reforma fiscal de 2014. Los resultados determinan una progresividad relativa con un alto efecto de HI con la reforma fiscal y un incremento de recursos tributarios en 5.2% y 3.7% del PIB en impuesto sobre la renta e IVA respectivamente.</font></p>  	    <p align="justify"><font face="verdana" size="2"><b>Palabras clave:</b> progresividad, redistribuci&oacute;n, equidad vertical, inequidad horizontal, an&aacute;lisis no param&eacute;trico.</font></p>  	    <p align="justify"><font face="verdana" size="2"><b>Clasificaci&oacute;n JEL:</b> D63, H22, H23, I32, C14.</font></p> 	    <p align="justify">&nbsp;</p>  	<hr>     <p align="justify"><font face="verdana" size="2"><b>Introduction</b></font></p>  	    <p align="justify"><font face="verdana" size="2">Tax and benefit systems have a significant influence on disposable income distribution when they are able to reduce market income differences. In recent years, similar countries to Mexico in Latin America like Brazil, Argentina and Uruguay have improved their fiscal conditions. The two later countries have tackled poverty through redistribution; however, there are still countries with poor results that have applied even more ambitious programs and more resources, such as Mexico with the Oportunidades program, among others, such as Bolivia and Peru (Lustig, Pessino and Scott, 2014).</font></p>  	    <p align="justify"><font face="verdana" size="2">Success or failure of the implementation of fiscal policies to meet its purpose have been evaluated over time, with respect to policies related to the pension systems, social security, health and medicare services, housing and even the targeting of different conditional transfers as the programs with greatest impact on the well&#45;being of the most vulnerable agents. This is how fiscal policy appears with the power accrued in their redistributive essence, to the extent that part of the collection of revenues for social spending should be assigned to programs of benefits allocated to the contributors in the system (Musgrave, 2001: 68).</font></p>  	    <p align="justify"><font face="verdana" size="2">In the Mexican case, a country with persistent levels of disparities and income inequality; we provide some elements that contribute to highlight this inequality as a result from the fiscal system. In recent years, there has been a renewed interest in discussing theoretical and empirical issues about the redistributive mechanisms of income, where one role of the state can be to improve the social welfare of population through redistributive mechanisms of income, which are the collection of taxes and the provision of benefit programs.</font></p>  	    <p align="justify"><font face="verdana" size="2">In the year 2012, some changes have emerged in the taxation ground in Mexico. At both state and municipal level, the tax systems remained weak and the informal sector grew to reach sixty percent of the workers, resulting in a low taxable base (INEGI, 2014; Dougherty and Escobar, 2013). Also, the benefit programs have reached a peak with a faster pace during this year. 2014 is a year that begun with the implementation of a tax reform, withemphasis on making the application of direct taxes more progressive and increasing the general rate of the Value Added Tax (VAT). These facts can provide an ideal opportunity to examine the effects of the fiscal policy and redistribution into the whole population as well as for the contributors.</font></p>  	    <p align="justify"><font face="verdana" size="2">Two other interesting features of this fiscal crisis are both, the null capacity of the Mexican government to increase the productivity of revenues from taxes as well as the rapid internal increase in food and energy prices during the recent years. This has involved in its turn the expansion of consumption subsidies and targeted benefits, as well as the need to improve the government revenues to face with this agenda.</font></p>  	    ]]></body>
<body><![CDATA[<p align="justify"><font face="verdana" size="2">In order to do so, our motivation is to analyze the tax&#45;benefit system consisting only on cash&#45;transfers, personal income tax and indirect taxes in Mexico. We leave out of the scope of this paper the targeting of the public expenditure as well as the impact on poverty. Our aim is to compute total progressivity in the fiscal system, comparing between the progressivity for total taxes as well as that of total household benefits, which are not only for the poor (as the case for Programa de Apoyos Directos al Campo &#150;PROCAMPO&#150; and public scholarships &#150;<i>becas</i>&#150;). We implement some simulations to capture, non&#45;parametrically, the effect on the current tax reform in 2014.</font></p>  	    <p align="justify"><font face="verdana" size="2">To our knowledge, this task has not been considered for the Mexican case using the generalization of a measure that combines the joint effects of a tax system, with the novel technique of Duclos, Jalbert and Araar (2003) &#150;DJA, henceforth&#150;. "Equal must be treated equally", a sentence that serves as a value judgment on the fair treatment of taxpayers and transfer recipients and the main hypothesis in this research. This ethical value is linked to the negative impact of the horizontal inequality (HI) exerted in the distribution of income in any economy captured by the redistributive effect, where the governmental intervention may increase income disparities instead of reducing the gap. To assess the extent of HI and its impact, we adopt the DJA (2003) approach. In this paper, we also develop the novel methodology of progressivity curve, which accounts for an order of stochastic dominance on evaluation and is able to determine the improvement of the fiscal reform or any fiscal system composed by tax and benefit components.</font></p>  	    <p align="justify"><font face="verdana" size="2">The rest of the paper is organized as follows. In section I, we provide a literature review of the studies on the redistribution impact from the fiscal systems and incidence of taxes. Section II explains the theoretical approach and the mathematical derivation of the method applied with the corresponding indices, it also describes the ordering of data. Section III shows the empirical application for assessing the redistribution of the tax&#45;benefit system in Mexico and reports the main findings; and last section concludes with some particular recommendations.</font></p>  	    <p>&nbsp;</p>  	    <p align="justify"><font face="verdana" size="2"><b>I. Overview of literature on redistribution in tax&#45;benefit systems</b></font></p>  	    <p align="justify"><font face="verdana" size="2">The redistribution of income is regularly justified when failures occur in free markets. The study of progressivity and redistributive effect constitute a basic input to perceive the social efficiency of the fiscal system. It also allows ensuring an overview on the shape of distributions from contributors to the incidence of taxes and benefits.</font></p>  	    <p align="justify"><font face="verdana" size="2"><b>1. <i>Empirical studies of redistribution: international evidence</i></b></font></p>  	    <p align="justify"><font face="verdana" size="2">It is said that a taxation system is efficient &#45;with equity and redistribution&#45; only when all taxpayers are considered; that is, what the policy makers need to assert to modify the tax system (Musgrave, 1990). For the Latin American countries, the recent policy recommendations focus on the development of a tax structure that emphasizes revenue through indirect taxes (Bird and Gendron, 2011) as the basis for an effective mechanism for redistribution; this later recommendation should not be taken frivolously, or it could lead to another distortions.</font></p>  	    <p align="justify"><font face="verdana" size="2">Pechman and Okner (1974) represented a strong basis in the related research for a proportional tax system, derived from the mix of neutralization influenced by the progressive and regressive tax figures. This topic is addressed for developed countries as well as for some developing and transitional economies (Duclos and Tabi, 1996; Davidson and Duclos, 1997; Duclos, Jalbert and Araar, 2003; Duclos, Makdissi and Wodon, 2005; Araar, 2008; Kaplanoglou and Newberry, 2008; Bibi and Duclos, 2010; Duclos, Makdissi and Aaraar, 2010; Bird and Gendron, 2011; Cok, Urban and Verbic, 2013; Lustig, Pessino and Scott, 2014; Scott, 2014).</font></p>  	    <p align="justify"><font face="verdana" size="2">Duclos and Tabi (1996) and Davidson and Duclos (1997) developed an application using microdata from the Canadian Surveys of Consumer and Finances to evaluate effective progressivity with a focus on the Tax&#45;Redistributive approach (TR). The rates provide an approach to social welfare evaluation and therefore the tax system in the country was found to be effectively progressive during the 1980s, despite a regressive scheme for some tax figures. Transfers were also added in the assessment. The latter article shows evidence of a more progressive distribution in the post&#45;fiscal scene for the 1990s in the country.</font></p>  	    ]]></body>
<body><![CDATA[<p align="justify"><font face="verdana" size="2">In the literature, there are other methods described to compare the progressivity of the fiscal system. Makdissi and Wodon (2002) address the study of social efficiency of tax reforms using a stochastic dominance approach. In other instance, Duclos, Makdissi and Wodon (2005) applied this revision for the impact of two benefit programs in Mexico. More recently, Araar (2008) and Huesca and Araar (2016) proposed an empirical application to compare progressivity over time. In the former research, the impact of the fiscal system is measured based on the size and welfare of socio&#45;economic classes in the Canadian case; while in the latter, a formal robust comparison is used to determine how progressivity can be checked over time in Mexico during 2004&#45;2012.</font></p>  	    <p align="justify"><font face="verdana" size="2">In the international arena, for Greece, Kaplanoglou and Newberry (2008) estimated in the 1990s HI and VE components and found a vertical negative effect attributed to reranking by the indirect reforms for this country. A novel technique to study the impact on poverty dominance from the fiscal systems for five developed countries was developed by Bibi and Duclos (2010). On the fiscal impact side from indirect taxes such as the VAT, Bird and Gendron (2011) found the need for additional research. They state how the recent reforms for developing and transitional countries seem to reduce hi as long as the indirect taxation improves.</font></p>  	    <p align="justify"><font face="verdana" size="2">For two transitional countries, Slovenia and Croatia, Cok, Urban and Verbic (2013) performed one of the most complete empirical applications using a wide variety of figures to complete the whole fiscal system in both countries and obtain a comparison of the vertical and horizontal components from the two countries. They have applied the DJA approach for Croatia and found that although both countries share a similar background they present different outputs from their fiscal systems. They found how the fiscal system in Slovenia has created a much more impact on vertical effects than in Croatia, but for the former country the fiscal system also induced much more horizontal inequity when sensitivity analysis was carried out using greater aversion to inequality for the lower tail of distribution.</font></p>  	    <p align="justify"><font face="verdana" size="2">The argument that the progressivity can also increase due to inequality in countries with large informal sector (unable to tax) is shown by Duncan (2010), its evidence has been estimated for over one hundred countries. Duncan's findings suggest that progressivity has a strong negative effect on inequality in reported gross and net income and that this negative effect is more noticeable in countries where institutional framework supports pro&#45;poor redistribution. A similar pattern was found for many Asian countries by Claus, Mart&iacute;nez&#45;Vazquez and Vulcovic (2013), where government spending on social protection appears to increase income inequality instead of coping with it. Claus's study found for Asia that public spending on social protection as well as the one in housing for low&#45;income lending appears to increase income inequality.</font></p>  	    <p align="justify"><font face="verdana" size="2"><b>2. <i>Studies of incidence, progressivity and redistribution in the Mexican case</i></b></font></p>  	    <p align="justify"><font face="verdana" size="2">In Mexico, the issue of incidence analysis and impact from taxes has been carried out in a group of studies (Valero&#45;Gil , 2002; Flores, 2003; Huesca and Serrano, 2005; Valero&#45;Gil, 2006; Vargas, 2006; Barcelata&#45;Chavez, 2012; Scott, 2014, and Lustig, Pessino and Scott, 2014). Specifically, in the VAT case Valero&#45;Gil (2002) and Valero&#45;Gil (2006) found that some merchandises are not good candidates to be subsidized. In both studies, he found this condition when estimated low levels of elasticity on food and medicines for the entire population.</font></p>  	    <p align="justify"><font face="verdana" size="2">Flores (2003) analyzes the increase of VAT on food and giving cash&#45;transfers to the lower groups in the distribution of income. Barcelata&#45;Chavez (2012) argues that conceiving a reform of indirect taxes, points out to gaps and living standards as simple rules for the policy maker.</font></p>  	    <p align="justify"><font face="verdana" size="2">When the tax&#45;burden on distributive criteria is well designed, however, what is required is to minimize the loss for the low&#45;income households and tax&#45;payers. It is important to recall that indirect taxes (such as VAT) have been criticized as a tool that affects negatively the population. In this sense, Bird and Gendron (2011) try to explain why people keep the belief that indirect taxes, such as VAT, are usually regressive. Furthermore, they indicate that a well&#45;designed VAT may be more progressive than a direct (on income) tax, because the latter strategy only affects a portion of the taxable base (Bird and Gendron, 2011: 75).</font></p>  	    <p align="justify"><font face="verdana" size="2">In the previous line, Huesca and Serrano (2005) explore an application for VAT in Mexico. Their work focuses on the contribution of VAT to revenues and the redistribution of income giving insights that is weakly progressive and with low fundraising potential. Their results indicate that the Mexican VAT contributes to VE, but the problem arises to reduce the HI existing in that country due to the exemptions and zero rates on food, books, public transportation, drug medications as well as rents for leasing, giving a low taxable base for this tax figure.</font></p>  	    <p align="justify"><font face="verdana" size="2">Using a static approach, Vargas (2006) estimates the evolution and distribution of income in Mexico in the long term. He found the tax system to be progressive because there is a high concentration of the tax burden in the top income households in the period 1992&#45;2002. For 2008 and 2010, Scott (2014) finds a situation described as a "fiscal system trapped in a low&#45;revenue&#45;low&#45;benefits equilibrium" where this limitation arises from low levels of tax productivity, instead from low tax rates. Lustig, Pessino and Scott (2014), and Scott (2014) processes the tax figures and transfers in their databases with income&#45;expenditure surveys, but both studies still use local estimations with the concentration approach and progressivity indices (such as Kakwani (1977) and Reynolds&#45;Smolensky (1977)). They combine total taxes and benefits to obtain market income and its horizontal and vertical effects on the post&#45;fiscal incomes (see Lambert (1985) local approach). Unfortunately, they do not provide, in detail, the main sources from global progressivity or regressivity, nor even the reranking implied in the process. One of the novelty tasks on this application we develop for Mexico, in this article using the DJA (2003) methodology.</font></p>  	    ]]></body>
<body><![CDATA[<p>&nbsp;</p>  	    <p align="justify"><font face="verdana" size="2"><b>II. Methodology of Local and global approaches: Kakwani index and DJA</b></font></p>  	    <p align="justify"><font face="verdana" size="2"><b>1. <i>Testing progressivity in the fiscal system</i></b></font></p>  	    <p align="justify"><font face="verdana" size="2">We proceed to simplify, theoretically, the measurement of impact (negative or positive) from the tax&#45;system on gross incomes in 3 steps: 1. The progressivity in the fiscal system is assessed with a local approach (Liability progression &#150;LP&#150; and Residual progression &#150;RP&#150;); 2. We produce a comparison of progressivity with a global approach for each scenario (Tax redistribution &#150;TR&#150;); and 3. The distributive impact of the fiscal system is computed according to DJA (2003). According to Musgrave and Thin (1948) we propose the use of the liability progression and residual progression approaches, following Duclos and Araar (2006) notation as follows:</font></p>  	    <p align="justify"><font face="verdana" size="2"><b>Theorem 1.</b> <i>With the liability progression measurement, a fiscal system with tax T and transfer B is locally progressive if and only if:</i></font></p>  	    <p align="center"><font face="verdana" size="2"><img src="/img/revistas/etp/n43/a5e1.jpg"></font></p>  	    <p align="justify"><font face="verdana" size="2">Let <i>V</i> (<i>x</i>) be the final impact on gross income (<i>x</i>) as <i>V</i>(<i>x</i>) = <i>B</i>(<i>x</i>) &#150; <i>T</i>(<i>x</i>); where <i>&#949;<sub>T</sub></i><sub>(<i>x</i>)</sub> and<i><sub>B</sub></i><sub>(<i>x</i>)</sub> refer to the elasticity of tax <i>T</i> and transfer <i>B</i> with respect to income <i>x</i> respectively.</font></p>  	    <p align="justify"><font face="verdana" size="2"><b>Proof.</b> This condition can be easily derived starting from the initial condition of local progressivity of the net benefit, which is <i>&#949;<sub>V</sub></i><sub>(<i>x</i>)</sub>&lt; 1.</font></p>  	    <p align="justify"><font face="verdana" size="2">Then, a fiscal system measured with <i>Residual progression</i> with tax <i>T</i> and transfers <i>B</i> will be locally progressive if and only if:</font></p>  	    <p align="center"><font face="verdana" size="2"><img src="/img/revistas/etp/n43/a5e2.jpg"></font></p>  	    ]]></body>
<body><![CDATA[<p align="justify"><font face="verdana" size="2">&#949;<sub><i>N</i></sub>(x) refers to the elasticity of the net income <i>N</i>(x) with respect to income <i>x</i>.</font></p>  	    <p align="justify"><font face="verdana" size="2">To test the global progressivity we use two dual approaches: The first is the <i>tax redistribution</i> (TR) and the second the <i>income redistribution</i> (IR).</font></p>  	    <p align="justify"><font face="verdana" size="2"><b>Theorem 2.</b> <i>A fiscal system with tax</i> T <i>and transfer</i> B <i>is globally progressive if and only if:</i></font></p>  	    <p align="center"><font face="verdana" size="2"><img src="/img/revistas/etp/n43/a5e3.jpg"></font></p>  	    <p align="justify"><font face="verdana" size="2">where <i>Lx</i>(<i>p</i>) and <i>Cx</i>(<i>p</i>) denote the Lorenz and concentration curves respectively at percentile (<i>p</i>), where and are the average tax and average transfer respectively.</font></p>  	    <p align="justify"><font face="verdana" size="2"><b>Proof.</b> The link between concentration curves and progressivity was already described by Kakwani (1977) and Duclos and Araar (2006): The hybrid curve is equal to the change in Lorenz curve with a marginal change in taxes and transfers, progressivity curves are displayed respecting this condition for any percentile level.</font></p>  	    <p align="justify"><font face="verdana" size="2"><b>Corollary.</b> <i>A fiscal system with Tax</i> T <i>and transfer</i> B <i>is progressive if the index of progressivity:</i></font></p>  	    <p align="center"><font face="verdana" size="2"><img src="/img/revistas/etp/n43/a5e4.jpg"></font></p>  	    <p align="justify"><font face="verdana" size="2">where <i>IG</i> and <i>IC</i> are the Gini and concentrations ratios respectively. For the IR approach, one can recall that the fiscal system is ir progressive if:</font></p>  	    <p align="center"><font face="verdana" size="2"><img src="/img/revistas/etp/n43/a5e5.jpg"></font></p>  	    ]]></body>
<body><![CDATA[<p align="justify"><font face="verdana" size="2">using Gini and concentration ratios, it can be recall that the fiscal system is progressive if:</font></p>  	    <p align="center"><font face="verdana" size="2"><img src="/img/revistas/etp/n43/a5e6.jpg"></font></p>  	    <p align="justify"><font face="verdana" size="2">At the end, one must recall that a tax (benefit) is progressive if the tax burden (benefit incidence) of the low&#45;income group is relatively lower (higher) than that of the top&#45;group.</font></p>  	    <p align="justify"><font face="verdana" size="2"><b>2. <i>Local approach: Kakwani and marginal tax&#45;benefit evaluation</i></b></font></p>  	    <p align="justify"><font face="verdana" size="2">A tax is found to be progressive if it burdens more the non&#45;poor group. This implies a decrease in inequality and a rise in the share for the net income in the poor group of households. In the literature of progressivity, there are two main distinct concepts of progressivity: the local and the global ones. In the work pioneered by Musgrave and Thin (1948), two main approaches were proposed for the measurement of local progressivity, which are the liability progression and residual progression. Kakwani (1977) and Duclos and Tabi (1996) have addressed a serious criticism to this approach since the latter looks only for the extent of local progressivity.</font></p>  	    <p align="justify"><font face="verdana" size="2">Kakwani proposed an index of progressivity for taxes that is equal to the difference between the concentration index for the tax and the Gini ratio of gross income.<sup><a href="#nota">1</a></sup> When we denote the inequality index of gross income limited to the interval &#91;0, 1&#93; and the index from the concentration of any given tax or benefit, by <i>IC</i><sub><i>T,B</i></sub> which is bound on the interval &#91;&#45;1, 1&#93;, the formula for the Kakwani index is written in the expression (7):</font></p>  	    <p align="center"><font face="verdana" size="2"><img src="/img/revistas/etp/n43/a5e7.jpg"></font></p>  	    <p align="justify"><font face="verdana" size="2">is the Kakwani index of progressivity of tax , such technique is standard and has been applied in a wide range of empirical works. Besides, the quantification method of progressivity, a dominance stochastic approach can also be used to take a judgment about the progressivity of a given tax (see Yitzhaki and Thirsk, 1990; Yitzhaki and Slemrod, 1991).</font></p>  	    <p align="justify"><font face="verdana" size="2"><b>3. <i>Duclos&#45;Jalbert&#45;Araar (DJA) global approach</i></b></font></p>  	    <p align="justify"><font face="verdana" size="2">"<i>Equals must be treated equally</i>" an ethical value which is easily defendable. Through HI we would like to show the extent of unequally tax treatment of equals (those that have the same level of gross income). By <i>reranking</i> (R) we refer to the impact of change in gross income rank caused by the tax/benefit system. By the term VE, we refer to the impact of a tax/benefit system on inequality where equals are treated equally. Duclos, Jalbert and Araar (2003) have proposed a pleasant method to decompose the redistribution effect or change in inequality into these three components. First, the redistributive change in inequality that results from the effect of taxes and transfers can be expressed as:</font></p>  	    ]]></body>
<body><![CDATA[<p align="center"><font face="verdana" size="2"><img src="/img/revistas/etp/n43/a5e8.jpg"></font></p>  	    <p align="justify"><font face="verdana" size="2">Here is generically an Atkinson class inequality and normative index (Atkinson, 1970) and is defined as the concentration index of purged net income from local inequality (where each individual have the expected value of net income according to the level of his gross income). With this application, we can deconstruct the difference between gross income <i>X</i>, and net income <i>N</i> inequalities as written in the formula (9):</font></p>  	    <p align="center"><font face="verdana" size="2"><img src="/img/revistas/etp/n43/a5e9.jpg"></font></p>  	    <p align="justify"><font face="verdana" size="2">where (<i>&#949;, &#961;</i>) is the Gini&#45;Atkinson index.<sup><a href="#nota">2</a></sup> <img src="/img/revistas/etp/n43/a5s6.jpg" align="absmiddle">stands for the coefficient of concentration of <i>N</i> when the ranking variable is <i>X</i>(<i>p</i>) and as the concentration index of purged net income from local inequality. Next, we explain how each of the three components captures the extent of what they are proposed to assess:</font></p>  	    <blockquote> 		    <p align="justify"><font face="verdana" size="2">&bull; <i>Horizontal inequity</i> <img src="/img/revistas/etp/n43/a5s1.jpg" align="absmiddle">: In the case where there is no local inequality in net incomes, we have that, <img src="/img/revistas/etp/n43/a5s2.jpg" align="absmiddle"> and the horizontal inequality is nil. The more the local inequality of net incomes at percentile <i>p</i>, the lower is the local social welfare <img src="/img/revistas/etp/n43/a5s3.jpg" align="absmiddle"> and the higher is and then the component <i>horizontal inequity</i>.</font></p>  		    <p align="justify"><font face="verdana" size="2">&bull; <i>Reranking</i> <img src="/img/revistas/etp/n43/a5s4.jpg" align="absmiddle">: In the case where the rank based on gross income is similar to that based on net incomes, we have then: <img src="/img/revistas/etp/n43/a5s2.jpg" align="absmiddle"> and the reranking component is nil. The more the re&#45;ranking the lower is <img src="/img/revistas/etp/n43/a5s6.jpg" align="absmiddle">, and then, the higher is the re&#45;ranking component.</font></p>  		    <p align="justify"><font face="verdana" size="2">&bull; <i>Vertical Equity</i> <img src="/img/revistas/etp/n43/a5s7.jpg" align="absmiddle"> This component captures the change in inequality after removing the cost of horizontal inequality. The more the tax/benefit system equalizes net income, the higher is the vertical equity.</font></p> 	</blockquote>  	    <p align="justify"><font face="verdana" size="2"><b>4. <i>The Mexican tax system with the 2012 ENIGH database</i></b></font></p>  	    <p align="justify"><font face="verdana" size="2">In the context of the current government administration and the fiscal reform initiated by President Enrique Pe&ntilde;a Nieto, we proceed to illustrate the possible redistribution achieved in the country by the previous tax system of the year 2012, with the tax rules of that same year (called Initial situation). Then, we proceed with a scenario of the tax reform that allows us to project its possible effects. We consider the 2012 database using the new tax rules in the year 2014 (Simulation 1); finally, we add a situation where the VAT is applied over all products and services, with 16 percent as the general rate (Simulation 2).</font></p>  	    ]]></body>
<body><![CDATA[<p align="justify"><font face="verdana" size="2">For the empirical exercise, the 2012 ENIGH (INEGI, 2013) is used, with a sample of 9 002 households and about 31 million expanded. Based on the information provided by its microdata we proceed to build the distribution according to per capita units of income following both, direct and indirect identification methods (Lustig, <i>et al</i>, 2014). Once disposable household income (denoted by <i>N</i>) is obtained, it is possible to calculate the figures shown in <a href="#c1">Chart 1</a> to rebuild the pre&#45;fiscal (Market income) denoted by <i>X</i>. In order to produce a comparison, we replicate some estimates with a sub&#45;sample for the north border of the country considering the municipalities located in this geographical area included in the survey.</font></p>  	    <p align="center"><font face="verdana" size="2"><a name="c1"></a></font></p>  	    <p align="center"><font face="verdana" size="2"><img src="/img/revistas/etp/n43/a5c1.jpg"></font></p>  	    <p align="justify"><font face="verdana" size="2">When the vector on <i>N</i> is obtained after taxes, the current tax rules per each source of income are applied. Thus, different tax brackets were taken into account for the taxpayers, tax credits and tax allowances per wage&#45;earners were used as well. In order to rebuild the fiscal system from <i>N</i> in the surveys the tax translation hypothesis in Pechman (1985) are considered. For the empirical exercise, we use the income tax from both wage&#45;earners and individuals that reported income sources as benefits obtained from business, so we are able of estimating the progressivity and incidence for these sorts of direct taxes in the survey as well. The Mexican tax system has a scheme of limits and quotas for the assessment of the income tax (ISR) with 8 brackets of income in 2012 (11 for 2014). Each bracket must pay the corresponding annual income fee in Mexican pesos (MXN) &#91;0.00, 114.24, 2 966.76, 7 130.88, 9 438.60, 13 087.44, 39 929.04, 73 703.40&#93;, (also 180 850.82, 260 850.81, 940 850.81 in the 2014 rules) as well as a percentage of the salary for the marginal income tax ranging from 1.92 percent up to 30 percent in the most current fiscal year of 2012 (1.92 percent up to 35 percent in 2014 rules). The survey allows obtaining sources of incomes (up to 81 sources) and we use the four corresponding to address ISR.<sup><a href="#nota">3</a></sup></font></p>  	    <p align="justify"><font face="verdana" size="2">In the case of indirect taxes, there were taken VAT and IEPS (special tax on production and services), these being the two largest tax figures after ISR. For the indirect taxes, we estimate VAT and special tax on goods and services (IEPS) according to the tax rules, those controlled by informal activities related to the place of purchase provided by the same survey.<sup><a href="#nota">4</a></sup></font></p>  	    <p align="justify"><font face="verdana" size="2">The survey also allows analysis of 726 products and generic services, from which 27 add to VAT, at a rate general of 16%; In addition to the 27 goods and services that generate VAT, 10 of those are taxed with IEPS, with rates of up to 160 percent for tobacco products. The border with the United States (US) had a special VAT treatment different from the rest of the country in 2012, so this has been normalized as well, applying the 11% to the expenditures located in all these cities included in the survey. We believe this process do not add taxes beyond the actual ones paid by taxpayers.</font></p>  	    <p align="justify"><font face="verdana" size="2">In the case of benefits (which are not only for the poor)<sup><a href="#nota">5</a></sup> we collect them at the household level from the same survey using the following: Scholarships and cash transfers for education, Oportunidades social assistance program, 70 and more (for the elderly without pension); Programa de Apoyo Alimentario (PAL, program for food assistance); transfer for temporary employment (PET); PROCAMPO, as aid for agriculture activities, and other assistance programs.<sup><a href="#nota">6</a></sup></font></p>  	    <p align="justify"><font face="verdana" size="2">Market (gross) income is estimated just adding the total taxes and federal contributions from wages to the social security system (SSC) minus the pensions and the benefits received per household as follows:</font></p>  	    <p align="center"><font face="verdana" size="2"><img src="/img/revistas/etp/n43/a5e10.jpg"></font></p>  	    <p align="justify"><font face="verdana" size="2">where <i>X</i> stands for the pre&#45;fiscal or market income, <i>N</i> as the post&#45;fiscal income, <i>T</i> as the total tax burden, <i>P</i> the pensions, <i>SSC</i> as the social security contributions and <i>B</i> are the benefits (See <a href="#c1">table 1</a>). We do not consider transfers at a more aggregated level such as public education or health care, since our purpose is to determine progressivity isolated from the taxes paid as well as from the benefits received directly in a microeconomic perspective. Also for indirect taxes, we do not use a system of demand elasticity estimation to assess the marginal economic efficiency of various sources of tax payments, instead, we propose to use non&#45;parametrical techniques leaving the information to "speak by itself" as the analysis focus on a static comparative framework (Duclos and Araar, 2006).</font></p>  	    ]]></body>
<body><![CDATA[<p align="justify"><font face="verdana" size="2">Therefore, we describe the corresponding equations as follows:</font></p>  	    <p align="center"><font face="verdana" size="2"><img src="/img/revistas/etp/n43/a5e11.jpg"></font></p>  	    <p align="justify"><font face="verdana" size="2">Using the local linear approach based on a local OLS estimation where is a Gaussian kernel function, <i>X</i> as the market income, <i>v</i> a random component and the estimates are then given by:</font></p>  	    <p align="center"><font face="verdana" size="2"><img src="/img/revistas/etp/n43/a5e12.jpg"></font></p>  	    <p align="justify"><font face="verdana" size="2">and the marginal tax rates as,</font></p>  	    <p align="center"><font face="verdana" size="2"><img src="/img/revistas/etp/n43/a5e13.jpg"></font></p>  	    <p align="justify"><font face="verdana" size="2"><b>a) <i>Unit of analysis and indicator of welfare</i></b></font></p>  	    <p align="justify"><font face="verdana" size="2">In order to ensure an accurate estimation of welfare for household members, there is a consensus on the relevance of using the individual as the main unit of analysis. Hence, the primary step is to assess welfare of individuals and one has to adjust the total household income by the family size and its composition. The simplest method is to use income per capita, that is, to divide the household income by the household size. In our case, we use the equivalence scale from Consejo Nacional de Evaluaci&oacute;n de la Pol&iacute;tica de Desarrollo Social (CONEVAL) to account for social welfare which considers four different values to equalize income according to the value of one for the household head plus the corresponding values for the ages of each member in the household, ranging as follows: &#91;0&#45;5&#93; = 0.7, &#91;6&#45;12&#93; = 0.74, &#91;13&#45;18&#93; = 0.71, and &#91;19&#45;65+&#93; = 0.99. In this sense, we are comparing equal units affecting the shape on the distribution when giving the corresponding weight to each household member as well as assigning the respective weighs of the official economies of scale for the Mexican households.</font></p>  	    <p>&nbsp;</p>  	    <p align="justify"><font face="verdana" size="2"><b>III. The impact on fiscal system redistribution: empirical exercise</b></font></p>  	    ]]></body>
<body><![CDATA[<p align="justify"><font face="verdana" size="2">First, we would declare as a hypothesis that the payments on total taxation are slightly progressive in Mexico where the low&#45;income earners have a low tax&#45;burden, and this progressivity becomes lightened through the high HI effect, which reverses the positive outcome allowed by the scenario of the new fiscal reform in the country. Then, the negative impact of HI on the redistributive mechanism effect must be such as high that fiscal policy intervention may not reduce income disparities.</font></p>  	    <p align="justify"><font face="verdana" size="2">Second, we proceed to estimate the impact for each scenario with the effective marginal rate of taxes and benefits, then, in the next part, we present the DJA decomposition to obtain the redistributive effect and be able to give more accurate policy recommendations.</font></p>  	    <p align="justify"><font face="verdana" size="2"><b>1. <i>Progressivity in the fiscal system: Local approach.</i></b></font></p>  	    <p align="justify"><font face="verdana" size="2">We start our discussion by showing the progression in the effective marginal tax/benefit rates (LP and RP approaches) using equation (13) for the calculations. First, let us recall that for a given level of gross income, the effective tax rate shows the expected total taxes (direct and indirect taxes) for an additional earned peso, results for current and the two scenarios are shown in <a href="#g1">Graph 1</a>.<sup><a href="#nota">7</a></sup> For instance, in 2012 those individuals with an equivalent gross income of MXN 3 800, must pay for an additional earned unit of income a total tax of almost 15 cents. <a href="#g1">Graph 1</a> shows that this effective tax rate would increase drastically taking into account simulations 1 and 2.</font></p>  	    <p align="center"><font face="verdana" size="2"><a name="g1"></a></font></p>  	    <p align="center"><font face="verdana" size="2"><img src="/img/revistas/etp/n43/a5g1.jpg"></font></p>  	    <p align="justify"><font face="verdana" size="2">The first simulation (rules of 2014), shows, for the same level of income, the increase in revenues in about 15 cents for an additional earned income unit. It depicts the trajectory of the new tax reform; for the second simulation, a much stronger effect on public revenues and a tax&#45;burden of almost 18 cents per unit of income earned can be seen. An interesting feature for the middle&#45;income earners is found, when the pressure is almost the same along the level of income. It seems those agents located below MXN 5 000, would present a greater pressure than the counterpart agents do; secondly, the marginal burden of taxes is much higher for Simulation 2, where a general VAT rate is applied.</font></p>  	    <p align="justify"><font face="verdana" size="2">This can be explained by a set of combined empirical and normative factors such as:</font></p>  	    <blockquote> 		    <p align="justify"><font face="verdana" size="2">&bull; The increase in VAT on all goods and services (including those for food and medicines) in the second simulation.</font></p>  		    ]]></body>
<body><![CDATA[<p align="justify"><font face="verdana" size="2">&bull; The increase in the informal sector (which allow people to avoid direct taxes and regulations for some agents);</font></p>  		    <p align="justify"><font face="verdana" size="2">&bull; Corporate tax evasion and ineffective corporate tax alleviation that reduces the income tax&#45;burden, even for the formal workers, as confirmed by Kumler, Verhoogen and Fr&iacute;as (2013).</font></p> 	</blockquote>  	    <p align="justify"><font face="verdana" size="2">In either way, our results so far tell us about the urgent need of revision in the Mexican tax systems to enhance its effectiveness. On this matter, Rawls (1971) establishes that unfairness develops when some normative conditions are forced and those are supposed to be fair. These normative criteria should agree with the expectations of any individual regardless their position in distributive terms. Our empirical evidence so far can be linked to this argument as well as that exposed by Atkinson (1970), where compliance with the payment of taxes should be the reason why any person must trust one another, and this, could provide good reasons to deny any right when expectations are not fulfilled.</font></p>  	    <p align="justify"><font face="verdana" size="2">In <a href="#g2">Graph 2</a>, we show the effective marginal tax rate for the border of the country. It can be seen in this graph that the marginal taxation increases faster than in the country, giving raise for an additional tax pressure on the households located in this region. For each earned income unit, the average effective marginal rate would take 20 cents at the maximum level, particularly due to the general VAT rate. As it was stated, benefits are held constant in the simulations, so that benefits are inducing the same effect for the considered scenarios. In the limit, the poverty line of welfare from CONEVAL in 2012 (MXN 2 400) the tax burden begin to increase and it exceeds considerably the pressure above MXN 4 000.</font></p>  	    <p align="center"><font face="verdana" size="2"><a name="g2"></a></font></p>  	    <p align="center"><font face="verdana" size="2"><img src="/img/revistas/etp/n43/a5g2.jpg"></font></p>  	    <p align="justify"><font face="verdana" size="2"><a href="#c2">Chart 2</a> presents the Kakwani rates of redistribution with the local approach. In general, the 2012 fiscal situation shows a progressive condition. It depicts a positive index of <i>K</i> = 4.1 as long as taxes includes both direct and indirect figures. It can be checked that just adding indirect taxes, the progressivity decreases by an index of 1.73, and how the second simulation presents the least effect on progressivity in the fiscal system, still remaining positive due to the effect induced through the benefits.</font></p>  	    <p align="center"><font face="verdana" size="2"><a name="c2"></a></font></p>  	    <p align="center"><font face="verdana" size="2"><img src="/img/revistas/etp/n43/a5c2.jpg"></font></p>  	    <p align="justify"><font face="verdana" size="2">In the simulation of 2014, the progressivity decreases in a minor amount, due to the new brackets configuration (3 more brackets were added) plus, the elimination of the 5 percent in VAT reduction in the bordering municipalities. The index becomes negative when the effects on an increase of VAT widespread in all products and services with no exemptions. As benefits are held constant in the simulations it can be seen those produce the most of the progressivity incidence in the fiscal system with the highest Kakwani rate of 96.32. As this approach is local we proceed in the next section to estimate the redistribution effect and incidence of the tax&#45;benefit system using the global non&#45;parametrical approach.</font></p>  	    ]]></body>
<body><![CDATA[<p align="justify"><font face="verdana" size="2"><b>2. <i>Redistributive effect in the fiscal system (DJA Global approach)</i></b></font></p>  	    <p align="justify"><font face="verdana" size="2">In order to determine the overall effect for the tax&#45;benefit system on inequality and to show the different redistributive components we use the DJA model in this section. First, we proceed with a prediction of the simulated reforms using a nonparametric local regression (see Section 3.4) and subsequently the results of the DJA approach. It is important to recall for the estimation that the fiscal system profiles are shown according to the initial position on its gross income. As it can be observed in <a href="#g3">Graph 3</a>, the expected net incomes were found to be well below the 45&deg; line for each scenario as a consequence or the redistribution effects induced by the fiscal reforms.</font></p>  	    <p align="center"><font face="verdana" size="2"><a name="g3"></a></font></p>  	    <p align="center"><font face="verdana" size="2"><img src="/img/revistas/etp/n43/a5g3.jpg"></font></p>  	    <p align="justify"><font face="verdana" size="2">
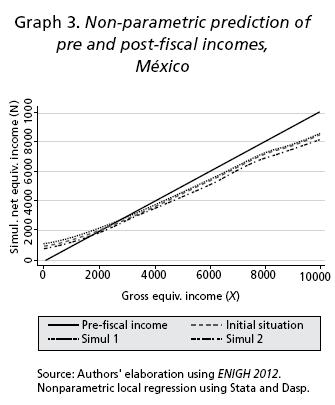
It is easy to detect that the fiscal scenario with the fiscal rules 2014, has the same trend over all the distribution than the 2012 situation. Meanwhile, the scenario where only VAT was added sets much more pressure on the contributors in the system as it post&#45;fiscal income is located below the initial scenario as well as from the fiscal reform 2014. This result can give insights related to Rawls (1971) for the output in the taxpayers of the Border region. The VAT increased much more in this area of the country than individuals' welfare could offset it. Any individual can feel this situation in the border region as deterioration, not compensated by the impact induced from benefits and progressivity condition cannot be achieved.</font></p>  	    <p align="justify"><font face="verdana" size="2">The other relevant feature stands at the very bottom of the income earners, where the three scenarios presents pretty much the same pattern because of the high redistributive mechanism from the benefits in this part of the distribution. Atkinson (1970) and Rawls (1971) put much more emphasis on this part of the income distribution, but in our empirical exercise, the lower part of the distribution exhibits less pressure from direct taxes, not from VAT.</font></p>  	    <p align="justify"><font face="verdana" size="2">In the top part of the distribution is easy to see a large amount of collected resources, which corroborates the progressivity in the fiscal system in general. In <a href="#g4">Graph 4</a> the expected net incomes for the Mexican border are shown with an increase in the general VAT rate of 5 percent. The trend is similar to the overall country; there is just a small gap in the scenario 2012 and that with rules of 2014 according to the extra pressure added in these cities related with the elimination of this reduction and leveling it with the general rate applied in the country. Even in this graphical analysis, it would be hard to tell which scenario presents the greater progressivity with the least negative effects on reranking. <a href="#c3">Chart 3</a> shows the DJA decomposition for each simulation, giving more details about the redistribution effects.</font></p>  	    <p align="center"><font face="verdana" size="2"><a name="g4"></a></font></p>  	    <p align="center"><font face="verdana" size="2"><img src="/img/revistas/etp/n43/a5g4.jpg"></font></p>  	    <p align="center"><font face="verdana" size="2"><a name="c3"></a></font></p>  	    ]]></body>
<body><![CDATA[<p align="center"><font face="verdana" size="2"><img src="/img/revistas/etp/n43/a5c3.jpg"></font></p>  	    <p align="justify"><font face="verdana" size="2">Vertical equity component of the tax/benefit system is important and reacts with a decrease of about 20.37 percent of the Gin&#45;Atkinson index of inequality. However, the HI reduces the VE by about 34.36 percent, which is in our view relatively huge. The reranking component reverses the positive effect by 19.46 percent, which is a signal that the initial fiscal condition moves the position of equal households affecting their initial position on the distribution after taxes and benefits have been applied. Then, the positive redistributive effects with 12.71 points of VE decreases by the sum of the components HI and R reduces its impact in 6.83 points.</font></p>  	    <p align="justify"><font face="verdana" size="2">In the simulated scenarios; the second simulation where all goods and services are taxed in the general rate (16%) without exemptions, would increase HI and R lessen the effect of VE, this situation implies that the tax burden would fall on low&#45;income earners and treat them as "equals" in relation to the middle and top earners in the distribution. In addition, this simulation had the lowest RE with 15.49 percent.</font></p>  	    <p align="justify"><font face="verdana" size="2">The simulation of 2014 shows a similar pattern to 2012, with a small increase of VE and R and a small reduction of HI, finally the redistributive effect would be almost unchanged (<i>&#916;I</i> = 0.0004). These results have been estimated using the parameters for the Gini&#45;Atkinson ratios in a moderate condition of aversion (<i>&#949;</i> = 0.5, &#961; = 2) highly recommended in the literature (Duclos, Jalbert and Araar, 2003); at the same time, our results can be comparable with those from countries such as Slovenia and Croatia, as described by Cok, Urban and Verbic (2013). While for these countries it can be seen initial inequality is lower than in Mexico, its redistributive effects reduce over 10 percent of inequality, whereas in the current situation (and the scenarios considered) for the Mexican case the tax system just reduced inequality in 5.86, 5.90 and 2.98 points of inequality respectively.</font></p>  	    <p align="justify"><font face="verdana" size="2"><b>3. <i>Redistributive effect with progressivity curves: TR approach</i></b></font></p>  	    <p align="justify"><font face="verdana" size="2">In this section, we proceed to calculate the progressivity curves for each scenario at both, the national level and in the border of the country, to detect any possible different effect on the degree of progressivity due to the 2014 fiscal reform with the global and TR approach. Are the total benefits more progressive than total tax&#45;es in each case, regardless the scenario considered in this analysis? It can be seen that for both, the whole country and the border area the total system is said to be progressive but with different incidences. For the country the progressivity is much greater than in the border, the three curves are located above those estimated for the border, even in the simulation 2 where a general VAT is applied.</font></p>  	    <p align="center"><font face="verdana" size="2"><img src="/img/revistas/etp/n43/a5g5.jpg"></font></p>  	    <p align="center"><font face="verdana" size="2"><img src="/img/revistas/etp/n43/a5g6.jpg"></font></p>  	    <p align="justify"><font face="verdana" size="2">An interesting feature is the initial situation and the first simulation, where both cases remained unchanged below the 40<sup>th</sup> percentile, as a result that 2014 reform will not change position, nor induce reranking for those households located in this part of the distribution. On the other hand, it can be seen that both curves begin to separate above the 40<sup>th</sup> percentile and, it is more pronounced above the 50<sup>th</sup> as a reason due to the more progressive income taxes applied on the top incomes. Lastly, for the country it can be said that a fiscal reform including a general 16 percent VAT would deteriorate the progressivity by the sum of all the area below the corresponding curves and seemingly distressing the lower incomes on the distribution.</font></p>  	    <p align="justify"><font face="verdana" size="2">In the border of the country, a lower level of progressivity can be seen because the height of the progressivity curves for any simulation is lower than its counterparts for Mexico. The extreme simulation with VAT on all products and services would deteriorate progressivity of the fiscal system and its effect on this region with more intensity.</font></p>  	    ]]></body>
<body><![CDATA[<p align="justify"><font face="verdana" size="2"><b>4. <i>Revenue effects from total Taxes</i></b></font></p>  	    <p align="justify"><font face="verdana" size="2">In general, the situation during 2012&#45;2013 in Mexico was not as progressive as it is under the new fiscal reform of 2014; it also would not produce a high level of reranking with the HI component seemingly decreasing less than 1%. This could lead policy makers to have more resources available to compensate the contributors through a more generous set of benefit programs; this situation would aim at reducing the HI component allowing those agents to offset the negative new tax schemes.</font></p>  	    <p align="justify"><font face="verdana" size="2">Comparing the total amount and fundraising that would allow the 2014 fiscal reform, it is observed in terms of the considered tax figures that ISR would achieve an increase of up to 5.2 percent of GDP (0.4 more points with respect to its initial level). VAT would increase up to 3.7 percent of GDP in the first simulation, but it would make a pronounced increased for the second simulation up to 8.3 points in terms of GDP. Finally but not less important, IEPS shows to increase its participation as a tax figure up to 1.2 point of GDP, due to the tax schedule induced to burden more soft, energetic drinks and poultry for dogs as well.</font></p>  	    <p align="justify"><font face="verdana" size="2">In the second simulation, the VAT increase revenues by MXN 710 926.30 million, a rate of 31.36 percent with respect to its initial level, but this reform will imply a lesser RE effect. This amount is lower than that estimated by Secretar&iacute;a de Hacienda y Cr&eacute;dito Publico (SHCP, 2014) of MXN 809 441 million estimated by the SHCP for the 2014 tax exercise, under the assumption of a VAT estimate with a general rate of 16%. Even with this extreme scenario, it seems to be the less preferred in terms of welfare, but it could be the healthier in terms of fiscal normative speech. It would not be the best one used by the Mexican political elite. This empirical application provides some insights of having the confidence in the speech of whether or not increase VAT, to the range of goods and services (including food and medicines). Simulation number 2 would reduce the impact on inequality in near 3 points, once the negative effect of the components HI and a reranking effect have been considered. Precisely, this last component increases up to represent 25.62 percent of the groups of households who moved their position (and deteriorated) in ranking.</font></p>  	    <p align="center"><font face="verdana" size="2"><img src="/img/revistas/etp/n43/a5c4.jpg"></font></p>  	    <p align="justify"><font face="verdana" size="2">Our findings for Mexico are in line with those by Huesca and Araar (2014). While these authors estimated a reranking of 14.9, our estimate of 19.46, which is higher, due to the unit of income used from CONEVAL equivalent scale; when the former study implemented income units per capita. This difference highlights the relevance of using different income units on this topic as long as per capita figures will tend to underestimate the progressivity effects.</font></p>  	    <p>&nbsp;</p>  	    <p align="justify"><font face="verdana" size="2"><b>Conclusion</b></font></p>  	    <p align="justify"><font face="verdana" size="2">This paper focuses on the study of the redistributive effect and progressivity of the tax&#45;benefit system in Mexico using the new fiscal reform in 2014 to work with simulations on micro&#45;data in 2012 from ENIGH. Serious distributive failures might be induced even when the economic efficiency requires more free markets or even more participation from the public sector side. We answer a question that seems to be quite complex: Is it the Mexican tax system progressive? The answer is affirmative. When benefits are applied to the total tax burden, the system becomes more progressive in words of Rawls (1971). We summarize the main findings of this research:</font></p>  	    <blockquote> 		    ]]></body>
<body><![CDATA[<p align="justify"><font face="verdana" size="2">&bull; An issue of importance related to pre and post&#45;fiscal inequality, which remains high despite that the fiscal system induces an improvement on VE (redistribution) in about 5 points according to DJA decomposition.</font></p>  		    <p align="justify"><font face="verdana" size="2">&bull; DJA decomposition shows a deterioration in the position of the equals, when re&#45;ranking index increased by 31.6 percent.</font></p>  		    <p align="justify"><font face="verdana" size="2">&bull; DJA estimates give a decreasing redistributive total effect of the fiscal system when comparing current situation with simulation two, by almost 50 percent of VE.</font></p>  		    <p align="justify"><font face="verdana" size="2">&bull; The 2014 tax reform induces improvement and equity in the treatment of "equals", but a reduced advance on marginal efficiency from taxes is found.</font></p>  		    <p align="justify"><font face="verdana" size="2">&bull; 2014 versus 2012 improves progressivity and revenues (1 percent of GDP), except for the treatment of the bottom&#45;income groups which remains the same (those located below the 40th percentile in the distribution).</font></p>  		    <p align="justify"><font face="verdana" size="2">&bull; The second simulation with general VAT on all goods and services can increase revenues border region of Mexico, where this case would deteriorate progressivity of the fiscal system with more intensity than in the country.</font></p>  		    <p align="justify"><font face="verdana" size="2">&bull; We cannot conclude that the 2014 reform is welfare dominant over the previous tax system because it would not improve the situation of the "equals" in the bottom part of the distribution of households.</font></p> 	</blockquote>  	    <p align="justify"><font face="verdana" size="2">This novelty approach is aimed at supporting the evaluation for policy makers or even for the tax authorities in the country, such as the work in the Congress or that of CONEVAL, to provide monitoring and be able to determine the most viable fiscal adjustment on taxes and benefits in terms of their distributional effects and their fiscal costs. Finally, we want this research to inspire future work that investigate the impacts of a wide spectrum of taxes and benefits on specific groups of contributors and households, or even for the poor, in order to improve both, the fiscal equity and the social policy agenda.</font></p>  	    <p align="center"><font face="verdana" size="2"><a href="/img/revistas/etp/n43/html/a5appen1.htm" target="_blank">Appendix 1. Basic statistics of the database</a></font></p>  	    <p>&nbsp;</p>  	    ]]></body>
<body><![CDATA[<p align="justify"><font face="verdana" size="2"><b>References</b></font></p>  	    <!-- ref --><p align="justify"><font face="verdana" size="2">Araar, Abdelkrim (2008) Social classes, inequality and Redistributive policies in Canada. Cahier de recherch&eacute;/Working paper 08&#45;17, CIRPEE, Universit&eacute; Laval. August.    &nbsp;&nbsp;&nbsp;&nbsp;&nbsp;&nbsp;&nbsp;&nbsp;[&#160;<a href="javascript:void(0);" onclick="javascript: window.open('/scielo.php?script=sci_nlinks&ref=2964239&pid=S0188-3380201500020000500001&lng=','','width=640,height=500,resizable=yes,scrollbars=1,menubar=yes,');">Links</a>&#160;]<!-- end-ref --></font></p>  	    <!-- ref --><p align="justify"><font face="verdana" size="2">Araar, Abdelkrim, and Duclos, Jean&#45;Yves (2013). <i>DASP: Distributive Analysis Stata Package, User Manual, Version 2.3.</i> np: Universit&eacute; Laval/PEP/CIRPEE/Banco Mundial.    &nbsp;&nbsp;&nbsp;&nbsp;&nbsp;&nbsp;&nbsp;&nbsp;[&#160;<a href="javascript:void(0);" onclick="javascript: window.open('/scielo.php?script=sci_nlinks&ref=2964241&pid=S0188-3380201500020000500002&lng=','','width=640,height=500,resizable=yes,scrollbars=1,menubar=yes,');">Links</a>&#160;]<!-- end-ref --></font></p>  	    <!-- ref --><p align="justify"><font face="verdana" size="2">Atkinson, Anthony, B. (1970). On the Measurement of Inequality. <i>Journal of Economic Theory</i>, 0 (2), pp. 244&#45;263.    &nbsp;&nbsp;&nbsp;&nbsp;&nbsp;&nbsp;&nbsp;&nbsp;[&#160;<a href="javascript:void(0);" onclick="javascript: window.open('/scielo.php?script=sci_nlinks&ref=2964243&pid=S0188-3380201500020000500003&lng=','','width=640,height=500,resizable=yes,scrollbars=1,menubar=yes,');">Links</a>&#160;]<!-- end-ref --></font></p>  	    <!-- ref --><p align="justify"><font face="verdana" size="2">Barcelata Chavez, Hilario (2012). <i>Desarrollo, pobreza y pol&iacute;tica social en M&eacute;xico. Textos de Julio Boltvinik.</i> Spain: eumed.net,/Universidad de M&aacute;laga.    &nbsp;&nbsp;&nbsp;&nbsp;&nbsp;&nbsp;&nbsp;&nbsp;[&#160;<a href="javascript:void(0);" onclick="javascript: window.open('/scielo.php?script=sci_nlinks&ref=2964245&pid=S0188-3380201500020000500004&lng=','','width=640,height=500,resizable=yes,scrollbars=1,menubar=yes,');">Links</a>&#160;]<!-- end-ref --></font></p>  	    <!-- ref --><p align="justify"><font face="verdana" size="2">Bibi, Sami, and Duclos, Jean&#45;Yves (2010). A Comparison of the Poverty Impact of Transfers, Taxes and Market Income across Five OECD Countries. <i>Bulletin of Economic Research</i>, 62(4), 387&#45;406.    &nbsp;&nbsp;&nbsp;&nbsp;&nbsp;&nbsp;&nbsp;&nbsp;[&#160;<a href="javascript:void(0);" onclick="javascript: window.open('/scielo.php?script=sci_nlinks&ref=2964247&pid=S0188-3380201500020000500005&lng=','','width=640,height=500,resizable=yes,scrollbars=1,menubar=yes,');">Links</a>&#160;]<!-- end-ref --></font></p>  	    <!-- ref --><p align="justify"><font face="verdana" size="2">Bird, Richard, M., and Gendron, Pierre P. (2011). Equity and the Informal Sector. In: R. Bird and P. Gendron. <i>The VAT in Developing and Transitional Countries</i>. New York: Cambridge University Press, pp. 70&#45;80.    &nbsp;&nbsp;&nbsp;&nbsp;&nbsp;&nbsp;&nbsp;&nbsp;[&#160;<a href="javascript:void(0);" onclick="javascript: window.open('/scielo.php?script=sci_nlinks&ref=2964249&pid=S0188-3380201500020000500006&lng=','','width=640,height=500,resizable=yes,scrollbars=1,menubar=yes,');">Links</a>&#160;]<!-- end-ref --></font></p>  	    <!-- ref --><p align="justify"><font face="verdana" size="2">Boltvinik, Julio (2004a). Pol&iacute;ticas focalizadas de combate a la pobreza en M&eacute;xico. El Progresa/Oportunidades. In: J. Boltvinik and A. Araceli (coords.). <i>La pobreza en M&eacute;xico y el mundo.</i> <i>Realidades y desaf&iacute;os.</i> Tamaulipas (M&eacute;xico): Siglo XXI, pp. 315&#45;347.    &nbsp;&nbsp;&nbsp;&nbsp;&nbsp;&nbsp;&nbsp;&nbsp;[&#160;<a href="javascript:void(0);" onclick="javascript: window.open('/scielo.php?script=sci_nlinks&ref=2964251&pid=S0188-3380201500020000500007&lng=','','width=640,height=500,resizable=yes,scrollbars=1,menubar=yes,');">Links</a>&#160;]<!-- end-ref --></font></p>  	    <!-- ref --><p align="justify"><font face="verdana" size="2">&#45;&#45;&#45;&#45;&#45;&#45;&#45;&#45;&#45;&#45; (2004b). M&eacute;todos de medici&oacute;n de la pobreza. Una tipolog&iacute;a. Limitaciones de los m&eacute;todos tradicionales y problemas de los combinados. In: J. Boltvinik and A. Araceli (coords.). <i>La pobreza en M&eacute;xico y el mundo</i>. <i>Realidades y desaf&iacute;os.</i> Tamaulipas (M&eacute;xico): Siglo XXI, pp. 437&#45;475.    &nbsp;&nbsp;&nbsp;&nbsp;&nbsp;&nbsp;&nbsp;&nbsp;[&#160;<a href="javascript:void(0);" onclick="javascript: window.open('/scielo.php?script=sci_nlinks&ref=2964253&pid=S0188-3380201500020000500008&lng=','','width=640,height=500,resizable=yes,scrollbars=1,menubar=yes,');">Links</a>&#160;]<!-- end-ref --></font></p>  	    <!-- ref --><p align="justify"><font face="verdana" size="2">Bracamontes, Joaqu&iacute;n, and Camberos, Mario (2012). <i>Las transferencias monetarias de Oportunidades y su impacto en la pobreza de las regiones de M&eacute;xico</i>. M&eacute;xico: AM/CIAD.    &nbsp;&nbsp;&nbsp;&nbsp;&nbsp;&nbsp;&nbsp;&nbsp;[&#160;<a href="javascript:void(0);" onclick="javascript: window.open('/scielo.php?script=sci_nlinks&ref=2964255&pid=S0188-3380201500020000500009&lng=','','width=640,height=500,resizable=yes,scrollbars=1,menubar=yes,');">Links</a>&#160;]<!-- end-ref --></font></p>  	    <!-- ref --><p align="justify"><font face="verdana" size="2">Claus, Iris; Mart&iacute;nez&#45;Vazquez, Jorge, and Vulovic, Violeta (2013). Coping with Rising Inequality in Asia: How Effective Are Fiscal Policies? <i>Asian Economic Papers</i>: 0 (12), pp. 1&#45;33.    &nbsp;&nbsp;&nbsp;&nbsp;&nbsp;&nbsp;&nbsp;&nbsp;[&#160;<a href="javascript:void(0);" onclick="javascript: window.open('/scielo.php?script=sci_nlinks&ref=2964257&pid=S0188-3380201500020000500010&lng=','','width=640,height=500,resizable=yes,scrollbars=1,menubar=yes,');">Links</a>&#160;]<!-- end-ref --></font></p>  	    <!-- ref --><p align="justify"><font face="verdana" size="2">Cok, Mitja; Urban, Ivica, and Verbic, Miroslav (2013). Income redistribution through taxes and social benefits: the case of Slovenia and Croatia, <i>Panoeconomicus</i>, 0 (60), pp. 667&#45;686.    &nbsp;&nbsp;&nbsp;&nbsp;&nbsp;&nbsp;&nbsp;&nbsp;[&#160;<a href="javascript:void(0);" onclick="javascript: window.open('/scielo.php?script=sci_nlinks&ref=2964259&pid=S0188-3380201500020000500011&lng=','','width=640,height=500,resizable=yes,scrollbars=1,menubar=yes,');">Links</a>&#160;]<!-- end-ref --></font></p>  	    <!-- ref --><p align="justify"><font face="verdana" size="2">Davidson, Russell, and Duclos, Jean&#45;Yves (1997). Statistical Inference for the Measurement of the Incidence of Taxes and Transfers. <i>Econometrica</i>, 0 (65), pp. 1453&#45;1465.    &nbsp;&nbsp;&nbsp;&nbsp;&nbsp;&nbsp;&nbsp;&nbsp;[&#160;<a href="javascript:void(0);" onclick="javascript: window.open('/scielo.php?script=sci_nlinks&ref=2964261&pid=S0188-3380201500020000500012&lng=','','width=640,height=500,resizable=yes,scrollbars=1,menubar=yes,');">Links</a>&#160;]<!-- end-ref --></font></p>  	    <!-- ref --><p align="justify"><font face="verdana" size="2">Dougherty, Sean, and Escobar, Octavio (2013). The Determinants of Informality in Mexico's States. OECD Economics Department Working Papers 1043.    &nbsp;&nbsp;&nbsp;&nbsp;&nbsp;&nbsp;&nbsp;&nbsp;[&#160;<a href="javascript:void(0);" onclick="javascript: window.open('/scielo.php?script=sci_nlinks&ref=2964263&pid=S0188-3380201500020000500013&lng=','','width=640,height=500,resizable=yes,scrollbars=1,menubar=yes,');">Links</a>&#160;]<!-- end-ref --></font></p>  	    <!-- ref --><p align="justify"><font face="verdana" size="2">Duclos, Jean&#45;Yves, and Araar, Abdelkrim (2006). Measuring Progressivity and Vertical Equity. In: J. Y. Duclos and A. Araar, <i>Poverty and Equity. Measurement, Policy, and Estimation with DAD.</i> New&#45;York: , Springer, pp. 127&#45;132.    &nbsp;&nbsp;&nbsp;&nbsp;&nbsp;&nbsp;&nbsp;&nbsp;[&#160;<a href="javascript:void(0);" onclick="javascript: window.open('/scielo.php?script=sci_nlinks&ref=2964265&pid=S0188-3380201500020000500014&lng=','','width=640,height=500,resizable=yes,scrollbars=1,menubar=yes,');">Links</a>&#160;]<!-- end-ref --></font></p>  	    <!-- ref --><p align="justify"><font face="verdana" size="2">Duclos, Jean&#45;Yves, and Tabi, Martin (1996). The measurement of progressivity, with an application to Canada. <i>The Canadian Journal of Economics</i>, 29 (1), pp. s165&#45;s170.    &nbsp;&nbsp;&nbsp;&nbsp;&nbsp;&nbsp;&nbsp;&nbsp;[&#160;<a href="javascript:void(0);" onclick="javascript: window.open('/scielo.php?script=sci_nlinks&ref=2964267&pid=S0188-3380201500020000500015&lng=','','width=640,height=500,resizable=yes,scrollbars=1,menubar=yes,');">Links</a>&#160;]<!-- end-ref --></font></p>  	    <!-- ref --><p align="justify"><font face="verdana" size="2">Duclos, Jean&#45;Yves; Jalbert, Vincent, and Araar, Abdelkrim (2003). Classical horizontal inequity and reranking: an integrated approach. <i>Research on Economic Inequality</i>, 8 (10), pp. 65&#45;100.    &nbsp;&nbsp;&nbsp;&nbsp;&nbsp;&nbsp;&nbsp;&nbsp;[&#160;<a href="javascript:void(0);" onclick="javascript: window.open('/scielo.php?script=sci_nlinks&ref=2964269&pid=S0188-3380201500020000500016&lng=','','width=640,height=500,resizable=yes,scrollbars=1,menubar=yes,');">Links</a>&#160;]<!-- end-ref --></font></p>  	    <!-- ref --><p align="justify"><font face="verdana" size="2">Duclos, Jean&#45;Yves; Makdissi, Paul, and Araar, Abdelkrim (2010). Pro&#45;Poor Tax Reforms, with an Application to Mexico. Cahier de Reherche/Working Papers 10&#45;01, CIRPEE/Universit&eacute; Laval, January.    &nbsp;&nbsp;&nbsp;&nbsp;&nbsp;&nbsp;&nbsp;&nbsp;[&#160;<a href="javascript:void(0);" onclick="javascript: window.open('/scielo.php?script=sci_nlinks&ref=2964271&pid=S0188-3380201500020000500017&lng=','','width=640,height=500,resizable=yes,scrollbars=1,menubar=yes,');">Links</a>&#160;]<!-- end-ref --></font></p>  	    <!-- ref --><p align="justify"><font face="verdana" size="2">Duclos, Jean&#45;Yves; Makdissi, Paul, and Wodon, Quentin (2005). Poverty&#45;dominant program reforms: the role of targeting and allocation rules. <i>Journal of Development Economics</i>, 0 (77), pp. 53&#45;73.    &nbsp;&nbsp;&nbsp;&nbsp;&nbsp;&nbsp;&nbsp;&nbsp;[&#160;<a href="javascript:void(0);" onclick="javascript: window.open('/scielo.php?script=sci_nlinks&ref=2964273&pid=S0188-3380201500020000500018&lng=','','width=640,height=500,resizable=yes,scrollbars=1,menubar=yes,');">Links</a>&#160;]<!-- end-ref --></font></p>  	    <!-- ref --><p align="justify"><font face="verdana" size="2">Duncan, Denvil (2010). Essays on Personal Income Taxation and Income Inequality. Economics Dissertations, Scholar Works, Georgia State University, paper 62.    &nbsp;&nbsp;&nbsp;&nbsp;&nbsp;&nbsp;&nbsp;&nbsp;[&#160;<a href="javascript:void(0);" onclick="javascript: window.open('/scielo.php?script=sci_nlinks&ref=2964275&pid=S0188-3380201500020000500019&lng=','','width=640,height=500,resizable=yes,scrollbars=1,menubar=yes,');">Links</a>&#160;]<!-- end-ref --></font></p>  	    <!-- ref --><p align="justify"><font face="verdana" size="2">Flores, Daniel (2003). Un incremento en la tasa del IVA sobre los alimentos: &iquest;eficiencia, equidad o recaudaci&oacute;n? <i>Ensayos de Econom&iacute;a</i>, 23 (2), pp. 1&#45;14.    &nbsp;&nbsp;&nbsp;&nbsp;&nbsp;&nbsp;&nbsp;&nbsp;[&#160;<a href="javascript:void(0);" onclick="javascript: window.open('/scielo.php?script=sci_nlinks&ref=2964277&pid=S0188-3380201500020000500020&lng=','','width=640,height=500,resizable=yes,scrollbars=1,menubar=yes,');">Links</a>&#160;]<!-- end-ref --></font></p>  	    <!-- ref --><p align="justify"><font face="verdana" size="2">Hern&aacute;ndez, D., M&oacute;nica, and V&aacute;zquez, Sirenia (2005). La focalizaci&oacute;n como estrategia de pol&iacute;tica p&uacute;blica. Serie de Documentos de Investigaci&oacute;n, SEDESOL (November).    &nbsp;&nbsp;&nbsp;&nbsp;&nbsp;&nbsp;&nbsp;&nbsp;[&#160;<a href="javascript:void(0);" onclick="javascript: window.open('/scielo.php?script=sci_nlinks&ref=2964279&pid=S0188-3380201500020000500021&lng=','','width=640,height=500,resizable=yes,scrollbars=1,menubar=yes,');">Links</a>&#160;]<!-- end-ref --></font></p>  	    <!-- ref --><p align="justify"><font face="verdana" size="2">Huesca, Luis, and Serrano, Alfredo (2005). Impacto fiscal redistributivo desagregado del Impuesto al Valor Agregado en M&eacute;xico: V&iacute;as de reforma. <i>Investigaci&oacute;n Econ&oacute;mica</i>, 64 (253), pp. 89&#45;122.    &nbsp;&nbsp;&nbsp;&nbsp;&nbsp;&nbsp;&nbsp;&nbsp;[&#160;<a href="javascript:void(0);" onclick="javascript: window.open('/scielo.php?script=sci_nlinks&ref=2964281&pid=S0188-3380201500020000500022&lng=','','width=640,height=500,resizable=yes,scrollbars=1,menubar=yes,');">Links</a>&#160;]<!-- end-ref --></font></p>  	    <!-- ref --><p align="justify"><font face="verdana" size="2">INEGI (2013). <i>Encuesta Nacional de Ingresos y Gastos de los Hogares, 2012. ENIGH</i>: M&eacute;xico: INEGI.    &nbsp;&nbsp;&nbsp;&nbsp;&nbsp;&nbsp;&nbsp;&nbsp;[&#160;<a href="javascript:void(0);" onclick="javascript: window.open('/scielo.php?script=sci_nlinks&ref=2964283&pid=S0188-3380201500020000500023&lng=','','width=640,height=500,resizable=yes,scrollbars=1,menubar=yes,');">Links</a>&#160;]<!-- end-ref --></font></p>  	    <!-- ref --><p align="justify"><font face="verdana" size="2">INEGI (2014). Data: Cuadro Resumen Indicadores de ocupaci&oacute;n y empleo al cuarto trimestre de 2013. Available at: <a href="http://www.inegi.org.mx" target="_blank">http://inegi.org.mx</a>. &#91;Accesed February 25, 2014&#93;    &nbsp;&nbsp;&nbsp;&nbsp;&nbsp;&nbsp;&nbsp;&nbsp;[&#160;<a href="javascript:void(0);" onclick="javascript: window.open('/scielo.php?script=sci_nlinks&ref=2964285&pid=S0188-3380201500020000500024&lng=','','width=640,height=500,resizable=yes,scrollbars=1,menubar=yes,');">Links</a>&#160;]<!-- end-ref -->.</font></p>  	    <!-- ref --><p align="justify"><font face="verdana" size="2">Kaplanoglou, Georgia, and Newberry, David M. (2008). Horizontal Inequity and Vertical Redistribution with Indirect Taxes: The Greek Case. <i>Fiscal Studies</i>, 29 (2), pp. 257&#45;284.    &nbsp;&nbsp;&nbsp;&nbsp;&nbsp;&nbsp;&nbsp;&nbsp;[&#160;<a href="javascript:void(0);" onclick="javascript: window.open('/scielo.php?script=sci_nlinks&ref=2964287&pid=S0188-3380201500020000500025&lng=','','width=640,height=500,resizable=yes,scrollbars=1,menubar=yes,');">Links</a>&#160;]<!-- end-ref --></font></p>  	    <!-- ref --><p align="justify"><font face="verdana" size="2">Kakwani, Nanak (1977). Measurement of tax progressivity: An international comparison. <i>The Economic Journal</i>, 0 (87), pp. 71&#45;80.    &nbsp;&nbsp;&nbsp;&nbsp;&nbsp;&nbsp;&nbsp;&nbsp;[&#160;<a href="javascript:void(0);" onclick="javascript: window.open('/scielo.php?script=sci_nlinks&ref=2964289&pid=S0188-3380201500020000500026&lng=','','width=640,height=500,resizable=yes,scrollbars=1,menubar=yes,');">Links</a>&#160;]<!-- end-ref --></font></p>  	    <!-- ref --><p align="justify"><font face="verdana" size="2">Kumler, Todd; Verhoogen, Eric, and Fr&iacute;as, Judith. A. (2013). Enlisting Employees in Improving Pay roll tax Compliance: Evidence from Mexico. IZA Discussion Papers 7591.    &nbsp;&nbsp;&nbsp;&nbsp;&nbsp;&nbsp;&nbsp;&nbsp;[&#160;<a href="javascript:void(0);" onclick="javascript: window.open('/scielo.php?script=sci_nlinks&ref=2964291&pid=S0188-3380201500020000500027&lng=','','width=640,height=500,resizable=yes,scrollbars=1,menubar=yes,');">Links</a>&#160;]<!-- end-ref --></font></p>  	    <!-- ref --><p align="justify"><font face="verdana" size="2">Lambert, Peter, J. (1985). On the redistributive effect of taxes and benefits, <i>Scottish Journal of Political Economy</i>, 32(1), pp. 39&#45;54.    &nbsp;&nbsp;&nbsp;&nbsp;&nbsp;&nbsp;&nbsp;&nbsp;[&#160;<a href="javascript:void(0);" onclick="javascript: window.open('/scielo.php?script=sci_nlinks&ref=2964293&pid=S0188-3380201500020000500028&lng=','','width=640,height=500,resizable=yes,scrollbars=1,menubar=yes,');">Links</a>&#160;]<!-- end-ref --></font></p>  	    <!-- ref --><p align="justify"><font face="verdana" size="2">Lustig, Nora; Pessino, Carola, and Scott, John (2014). The Impact of Taxes and Social Spending on Inequality and Poverty in Argentina, Bolivia, Brazil, Mexico, Peru, and Uruguay: Introduction to the Special Issue. <i>Public Finance Review</i>, 0 (42), 287&#45;303.    &nbsp;&nbsp;&nbsp;&nbsp;&nbsp;&nbsp;&nbsp;&nbsp;[&#160;<a href="javascript:void(0);" onclick="javascript: window.open('/scielo.php?script=sci_nlinks&ref=2964295&pid=S0188-3380201500020000500029&lng=','','width=640,height=500,resizable=yes,scrollbars=1,menubar=yes,');">Links</a>&#160;]<!-- end-ref --></font></p>  	    <!-- ref --><p align="justify"><font face="verdana" size="2">Makdissi, Paul, and Wodon, Quentin (2002). Migration, Poverty, and Housing: Welfare comparisons Using Sequential Stochastic Dominance. Departement d'Economique de la Faculte d'administration &agrave; l'Universite de Sherbrooke in its series Cahiers de recherche, with number 01&#45;01.    &nbsp;&nbsp;&nbsp;&nbsp;&nbsp;&nbsp;&nbsp;&nbsp;[&#160;<a href="javascript:void(0);" onclick="javascript: window.open('/scielo.php?script=sci_nlinks&ref=2964297&pid=S0188-3380201500020000500030&lng=','','width=640,height=500,resizable=yes,scrollbars=1,menubar=yes,');">Links</a>&#160;]<!-- end-ref --></font></p>  	    <!-- ref --><p align="justify"><font face="verdana" size="2">Musgrave, Richard (1990). Horizontal Equity, Once More. <i>National Tax Journal</i>, 43 (2), pp. 113&#45;122.    &nbsp;&nbsp;&nbsp;&nbsp;&nbsp;&nbsp;&nbsp;&nbsp;[&#160;<a href="javascript:void(0);" onclick="javascript: window.open('/scielo.php?script=sci_nlinks&ref=2964299&pid=S0188-3380201500020000500031&lng=','','width=640,height=500,resizable=yes,scrollbars=1,menubar=yes,');">Links</a>&#160;]<!-- end-ref --></font></p>  	    <!-- ref --><p align="justify"><font face="verdana" size="2">&#45;&#45;&#45;&#45;&#45;&#45;&#45;&#45;&#45;&#45; (2001). Fiscal Tasks. In: J. Buchanan and R, A. Musgrave,<i> Public Finance and Public Choice: Two Contrasting Visions of the State</i>.np: Massachusetts Institute of Technology, pp. 63&#45;82.    &nbsp;&nbsp;&nbsp;&nbsp;&nbsp;&nbsp;&nbsp;&nbsp;[&#160;<a href="javascript:void(0);" onclick="javascript: window.open('/scielo.php?script=sci_nlinks&ref=2964301&pid=S0188-3380201500020000500032&lng=','','width=640,height=500,resizable=yes,scrollbars=1,menubar=yes,');">Links</a>&#160;]<!-- end-ref --></font></p>  	    <!-- ref --><p align="justify"><font face="verdana" size="2">Musgrave, Richard, and Thin, T. (1948). Income tax progression. <i>Journal of Political Economy</i>, 0 (56), pp. 498&#45;514.    &nbsp;&nbsp;&nbsp;&nbsp;&nbsp;&nbsp;&nbsp;&nbsp;[&#160;<a href="javascript:void(0);" onclick="javascript: window.open('/scielo.php?script=sci_nlinks&ref=2964303&pid=S0188-3380201500020000500033&lng=','','width=640,height=500,resizable=yes,scrollbars=1,menubar=yes,');">Links</a>&#160;]<!-- end-ref --></font></p>  	    <!-- ref --><p align="justify"><font face="verdana" size="2">Pechman, Joseph A. (1985). <i>Who pays the taxes, 1966&#45;1985?</i> Studies of Government Finance, 2nd Series. Washington, DC: Brookings Institution,    &nbsp;&nbsp;&nbsp;&nbsp;&nbsp;&nbsp;&nbsp;&nbsp;[&#160;<a href="javascript:void(0);" onclick="javascript: window.open('/scielo.php?script=sci_nlinks&ref=2964305&pid=S0188-3380201500020000500034&lng=','','width=640,height=500,resizable=yes,scrollbars=1,menubar=yes,');">Links</a>&#160;]<!-- end-ref --></font></p>  	    <!-- ref --><p align="justify"><font face="verdana" size="2">Pechman, Joseph A., and Okner, B. (1974). <i>Who Bears the Tax Burden?</i> Washington, DC: Brookings Institution.    &nbsp;&nbsp;&nbsp;&nbsp;&nbsp;&nbsp;&nbsp;&nbsp;[&#160;<a href="javascript:void(0);" onclick="javascript: window.open('/scielo.php?script=sci_nlinks&ref=2964307&pid=S0188-3380201500020000500035&lng=','','width=640,height=500,resizable=yes,scrollbars=1,menubar=yes,');">Links</a>&#160;]<!-- end-ref --></font></p>  	    <!-- ref --><p align="justify"><font face="verdana" size="2">Reynolds, Morgan, and Smolensky, Eugene (1977). <i>Public expenditure, taxes and the distribution of income: The United States. 1950, 1961, 1970</i>. New York: Academic Press.    &nbsp;&nbsp;&nbsp;&nbsp;&nbsp;&nbsp;&nbsp;&nbsp;[&#160;<a href="javascript:void(0);" onclick="javascript: window.open('/scielo.php?script=sci_nlinks&ref=2964309&pid=S0188-3380201500020000500036&lng=','','width=640,height=500,resizable=yes,scrollbars=1,menubar=yes,');">Links</a>&#160;]<!-- end-ref --></font></p>  	    <!-- ref --><p align="justify"><font face="verdana" size="2">Scott, John (2014). Redistributive Impact and Efficiency of Mexico's fiscal system. <i>Public Finance Review</i>, 0 (42), 368&#45;390.    &nbsp;&nbsp;&nbsp;&nbsp;&nbsp;&nbsp;&nbsp;&nbsp;[&#160;<a href="javascript:void(0);" onclick="javascript: window.open('/scielo.php?script=sci_nlinks&ref=2964311&pid=S0188-3380201500020000500037&lng=','','width=640,height=500,resizable=yes,scrollbars=1,menubar=yes,');">Links</a>&#160;]<!-- end-ref --></font></p>  	    <!-- ref --><p align="justify"><font face="verdana" size="2">Valero&#45;Gil, Jorge (2002). La distribuci&oacute;n de los bienes en M&eacute;xico. <i>Problemas del Desarrollo</i>, 33 (130), pp. 7&#45;34.    &nbsp;&nbsp;&nbsp;&nbsp;&nbsp;&nbsp;&nbsp;&nbsp;[&#160;<a href="javascript:void(0);" onclick="javascript: window.open('/scielo.php?script=sci_nlinks&ref=2964313&pid=S0188-3380201500020000500038&lng=','','width=640,height=500,resizable=yes,scrollbars=1,menubar=yes,');">Links</a>&#160;]<!-- end-ref --></font></p>  	    <!-- ref --><p align="justify"><font face="verdana" size="2">&#45;&#45;&#45;&#45;&#45;&#45;&#45;&#45;&#45;&#45; (2006). Estimaci&oacute;n de elasticidades e impuestos &oacute;ptimos a los bienes m&aacute;s consumidos en M&eacute;xico. <i>Estudios Econ&oacute;micos</i>, 21 (2), pp. 127&#45;176.    &nbsp;&nbsp;&nbsp;&nbsp;&nbsp;&nbsp;&nbsp;&nbsp;[&#160;<a href="javascript:void(0);" onclick="javascript: window.open('/scielo.php?script=sci_nlinks&ref=2964315&pid=S0188-3380201500020000500039&lng=','','width=640,height=500,resizable=yes,scrollbars=1,menubar=yes,');">Links</a>&#160;]<!-- end-ref --></font></p>  	    <!-- ref --><p align="justify"><font face="verdana" size="2">Vargas, C&eacute;sar O., (2006). Incidencia fiscal y del gasto sobre la renta familiar: un enfoque de microdatos para M&eacute;xico 1984&#45;2002. Thesis, Universidad Aut&oacute;noma de Barcelona, Departamento de Econom&iacute;a Aplicada, Barcelona, Spain.    &nbsp;&nbsp;&nbsp;&nbsp;&nbsp;&nbsp;&nbsp;&nbsp;[&#160;<a href="javascript:void(0);" onclick="javascript: window.open('/scielo.php?script=sci_nlinks&ref=2964317&pid=S0188-3380201500020000500040&lng=','','width=640,height=500,resizable=yes,scrollbars=1,menubar=yes,');">Links</a>&#160;]<!-- end-ref --></font></p>  	    <!-- ref --><p align="justify"><font face="verdana" size="2">Yitzhaki, Shlomo, and Slemrod, Joel (1991). Welfare Dominance: An Application to Commodity Taxation. <i>American Economic Review</i>, 81 (3), pp. 480&#150;96.    &nbsp;&nbsp;&nbsp;&nbsp;&nbsp;&nbsp;&nbsp;&nbsp;[&#160;<a href="javascript:void(0);" onclick="javascript: window.open('/scielo.php?script=sci_nlinks&ref=2964319&pid=S0188-3380201500020000500041&lng=','','width=640,height=500,resizable=yes,scrollbars=1,menubar=yes,');">Links</a>&#160;]<!-- end-ref --></font></p>  	    <!-- ref --><p align="justify"><font face="verdana" size="2">Yitzhaki, Shlomo, and Thirsk, Wayne (1990). Welfare Dominance and the Design of Excise Taxation in the Cote D'Ivoire. <i>Journal of Development Economics</i>, 0 (33), pp. 1&#45;18.    &nbsp;&nbsp;&nbsp;&nbsp;&nbsp;&nbsp;&nbsp;&nbsp;[&#160;<a href="javascript:void(0);" onclick="javascript: window.open('/scielo.php?script=sci_nlinks&ref=2964321&pid=S0188-3380201500020000500042&lng=','','width=640,height=500,resizable=yes,scrollbars=1,menubar=yes,');">Links</a>&#160;]<!-- end-ref --></font></p>  	    <p>&nbsp;</p>  	    <p align="justify"><font face="verdana" size="2"><b><a name="nota"></a>Notas</b></font></p>  	    <p align="justify"><font face="verdana" size="2"><sup>1</sup> Duclos and Tabi (1996) report that local progressivity can induce the same conclusion of global progressivity if and only if local progressivity is observed elsewhere.</font></p>  	    <p align="justify"><font face="verdana" size="2"><sup>2</sup> See Araar and Duclos (2013) to understand the definition of the Atkinson&#45;Gini index and its formalization.</font></p>  	    <p align="justify"><font face="verdana" size="2"><sup>3</sup> The five main sources of income addressing to income tax are: 1. Wages and salaries, income from subordinates, benefits, commissions, incentives; 2. Income from business and profits; 3. Income from business and activities in the primary sector; 4. Financial and capital earnings (includes insurance and other payments); and 5. Income from self&#45;employment.</font></p>  	    ]]></body>
<body><![CDATA[<p align="justify"><font face="verdana" size="2"><sup>4</sup> In order to meet the indirect taxes and the 15 different places where at least five do not collect VAT or IEPS, two scripts from STATA do&#45;files are available upon request from the authors.</font></p>  	    <p align="justify"><font face="verdana" size="2"><sup>5</sup> Mexican empirical evidence indicates errors in social transfer programs, both in omission and exclusion of poor households. Those are identified as type I and II respectively. This issue has persisted throughout the country's history for various social programs. Boltvinik (2004a; 2004b) have identified this problem for a variety of social programs, and indicate that social policy should be evaluated periodically. Hern&aacute;ndez, <i>et al.</i> (2005) and Bracamontes and Camberos (2012) evaluate in detail a strategy targeting public social programs.</font></p>  	    <p align="justify"><font face="verdana" size="2"><sup>6</sup> As in the case of Cok, <i>et al</i> (2013) and Lustig, <i>et al</i> (2014) we do not add retirement and pensions as a benefit component because of its contributive nature, but this is included in the net income figure.</font></p>  	    <p align="justify"><font face="verdana" size="2"><sup>7</sup> The estimation of these curves are based on the local linear approach. See the Section II.4 for more information concerning the estimation.</font></p>  	    <p>&nbsp;</p>  	    <p align="justify"><font face="verdana" size="2"><b>Informaci&oacute;n sobre los autores</b></font></p>  	    <p align="justify"><font face="verdana" size="2"><b>Luis Huesca Reynoso</b>. Doctor en Econom&iacute;a por la Universidad Aut&oacute;noma de Barcelona y miembro nivel 2 del SNI. Egres&oacute; de la Licenciatura en Econom&iacute;a en la Universidad de Sonora (UNISON) en 1994. Es profesor&#45;investigador titular del Centro de Investigaci&oacute;n en Alimentaci&oacute;n y Desarrollo, AC (CIAD). Tambi&eacute;n es acad&eacute;mico visitante en la Universit&eacute; Laval en Queb&eacute;c, Canada, Departament d'&eacute;conomique e imparte cursos de Econom&iacute;a P&uacute;blica y Econom&iacute;a Laboral. Con su tesis doctoral obtuvo el primer lugar en el IX Premio Nacional a la Investigaci&oacute;n Laboral 2006, otorgado por la Secretar&iacute;a del Trabajo y Previsi&oacute;n Social y el Banco Interamericano de Desarrollo. Fue responsable de la Evaluaci&oacute;n Nacional del Programa de Apoyo Alimentario 2011&#45;2012 de la Secretar&iacute;a de Desarrollo Social y colabora como asesor con el Consejo Nacional de Evaluaci&oacute;n de la Pol&iacute;tica de Desarrollo Social.</font></p>  	    <p align="justify"><font face="verdana" size="2"><b>Arturo Robles Valencia</b>. Doctorado en Ciencias por el CIAD, obtuvo la Licenciatura Econom&iacute;a en la UNISON. Profesor titular A en el Departamento de Econom&iacute;a de dicha universidad. Miembro en el nivel de candidatura del SNI. Sus &aacute;reas de inter&eacute;s versan sobre la distribuci&oacute;n del ingreso, la econom&iacute;a p&uacute;blica y temas de nutrici&oacute;n humana. Colabora en proyectos de ciencia b&aacute;sica, as&iacute; como con la Evaluaci&oacute;n Nacional del Programa de Apoyo Alimentario 2011&#45;2012 de la Secretaria de Desarrollo Social y el CIAD.</font></p>  	    <p align="justify"><font face="verdana" size="2"><b>Abdelkrim Araar.</b> Doctor en Econom&iacute;a por la Universit&eacute; Laval, Departement d'&eacute;conomique, y profesor asociado en la Universit&eacute; Laval en Queb&eacute;c, Canada, Departament d'&eacute;conomique. Miembro del Centro de Investigaci&oacute;n del Riesgo, las Pol&iacute;ticas Econ&oacute;micas y el Empleo (CIRPEE, por siglas en franc&eacute;s), as&iacute; como colaborador de The Partnership for Economic Policy (<a href="http://www.pep-net.org" target="_blank">www.pep&#45;net.org</a>) con financiamiento del Department for International Development of the United Kingdom, and Government of Canada, a trav&eacute;s del Centro del Desarrollo Internacional de Investigaci&oacute;n (IDRC, por siglas en ingl&eacute;s). Imparte cursos y talleres a trav&eacute;s del CIRPEE y es consultor en temas de pobreza y distribuci&oacute;n del ingreso para el Banco Mundial.</font></p>      ]]></body><back>
<ref-list>
<ref id="B1">
<nlm-citation citation-type="book">
<person-group person-group-type="author">
<name>
<surname><![CDATA[Araar]]></surname>
<given-names><![CDATA[Abdelkrim]]></given-names>
</name>
</person-group>
<source><![CDATA[Social classes, inequality and Redistributive policies in Canada]]></source>
<year>2008</year>
<publisher-name><![CDATA[CIRPEE, Université Laval]]></publisher-name>
</nlm-citation>
</ref>
<ref id="B2">
<nlm-citation citation-type="book">
<person-group person-group-type="author">
<name>
<surname><![CDATA[Araar]]></surname>
<given-names><![CDATA[Abdelkrim]]></given-names>
</name>
<name>
<surname><![CDATA[Duclos]]></surname>
<given-names><![CDATA[Jean-Yves]]></given-names>
</name>
</person-group>
<source><![CDATA[DASP: Distributive Analysis Stata Package, User Manual, Version 2.3]]></source>
<year>2013</year>
<publisher-name><![CDATA[Université LavalPEPCIRPEEBanco Mundial]]></publisher-name>
</nlm-citation>
</ref>
<ref id="B3">
<nlm-citation citation-type="journal">
<person-group person-group-type="author">
<name>
<surname><![CDATA[Atkinson]]></surname>
<given-names><![CDATA[Anthony, B.]]></given-names>
</name>
</person-group>
<article-title xml:lang="en"><![CDATA[On the Measurement of Inequality]]></article-title>
<source><![CDATA[Journal of Economic Theory]]></source>
<year>1970</year>
<volume>0</volume>
<numero>2</numero>
<issue>2</issue>
<page-range>244-263</page-range></nlm-citation>
</ref>
<ref id="B4">
<nlm-citation citation-type="book">
<person-group person-group-type="author">
<name>
<surname><![CDATA[Barcelata Chavez]]></surname>
<given-names><![CDATA[Hilario]]></given-names>
</name>
</person-group>
<source><![CDATA[Desarrollo, pobreza y política social en México. Textos de Julio Boltvinik]]></source>
<year>2012</year>
<publisher-name><![CDATA[eumed.net,/Universidad de Málaga]]></publisher-name>
</nlm-citation>
</ref>
<ref id="B5">
<nlm-citation citation-type="journal">
<person-group person-group-type="author">
<name>
<surname><![CDATA[Bibi]]></surname>
<given-names><![CDATA[Sami]]></given-names>
</name>
<name>
<surname><![CDATA[Duclos]]></surname>
<given-names><![CDATA[Jean-Yves]]></given-names>
</name>
</person-group>
<article-title xml:lang="en"><![CDATA[A Comparison of the Poverty Impact of Transfers, Taxes and Market Income across Five OECD Countries]]></article-title>
<source><![CDATA[Bulletin of Economic Research]]></source>
<year>2010</year>
<volume>62</volume>
<numero>4</numero>
<issue>4</issue>
<page-range>387-406</page-range></nlm-citation>
</ref>
<ref id="B6">
<nlm-citation citation-type="book">
<person-group person-group-type="author">
<name>
<surname><![CDATA[Bird]]></surname>
<given-names><![CDATA[Richard, M.]]></given-names>
</name>
<name>
<surname><![CDATA[Gendron]]></surname>
<given-names><![CDATA[Pierre P.]]></given-names>
</name>
</person-group>
<article-title xml:lang="en"><![CDATA[Equity and the Informal Sector]]></article-title>
<person-group person-group-type="editor">
<name>
<surname><![CDATA[Bird]]></surname>
<given-names><![CDATA[R.]]></given-names>
</name>
<name>
<surname><![CDATA[Gendron]]></surname>
<given-names><![CDATA[P.]]></given-names>
</name>
</person-group>
<source><![CDATA[The VAT in Developing and Transitional Countries]]></source>
<year>2011</year>
<page-range>70-80</page-range><publisher-loc><![CDATA[New York ]]></publisher-loc>
<publisher-name><![CDATA[Cambridge University Press]]></publisher-name>
</nlm-citation>
</ref>
<ref id="B7">
<nlm-citation citation-type="book">
<person-group person-group-type="author">
<name>
<surname><![CDATA[Boltvinik]]></surname>
<given-names><![CDATA[Julio]]></given-names>
</name>
</person-group>
<article-title xml:lang="es"><![CDATA[Políticas focalizadas de combate a la pobreza en México. El Progresa/Oportunidades]]></article-title>
<person-group person-group-type="editor">
<name>
<surname><![CDATA[Boltvinik]]></surname>
<given-names><![CDATA[J.]]></given-names>
</name>
<name>
<surname><![CDATA[Araceli]]></surname>
<given-names><![CDATA[A.]]></given-names>
</name>
</person-group>
<source><![CDATA[La pobreza en México y el mundo. Realidades y desafíos]]></source>
<year>2004</year>
<month>a</month>
<page-range>315-347</page-range><publisher-loc><![CDATA[^eTamaulipas Tamaulipas]]></publisher-loc>
<publisher-name><![CDATA[Siglo XXI]]></publisher-name>
</nlm-citation>
</ref>
<ref id="B8">
<nlm-citation citation-type="book">
<person-group person-group-type="author">
<name>
<surname><![CDATA[Boltvinik]]></surname>
<given-names><![CDATA[Julio]]></given-names>
</name>
</person-group>
<article-title xml:lang="es"><![CDATA[Métodos de medición de la pobreza. Una tipología. Limitaciones de los métodos tradicionales y problemas de los combinados]]></article-title>
<person-group person-group-type="editor">
<name>
<surname><![CDATA[Boltvinik]]></surname>
<given-names><![CDATA[J.]]></given-names>
</name>
<name>
<surname><![CDATA[Araceli]]></surname>
<given-names><![CDATA[A.]]></given-names>
</name>
</person-group>
<source><![CDATA[La pobreza en México y el mundo. Realidades y desafíos]]></source>
<year>2004</year>
<month>b</month>
<page-range>437-475</page-range><publisher-loc><![CDATA[^eTamaulipas Tamaulipas]]></publisher-loc>
<publisher-name><![CDATA[Siglo XXI]]></publisher-name>
</nlm-citation>
</ref>
<ref id="B9">
<nlm-citation citation-type="book">
<person-group person-group-type="author">
<name>
<surname><![CDATA[Bracamontes]]></surname>
<given-names><![CDATA[Joaquín]]></given-names>
</name>
<name>
<surname><![CDATA[Camberos]]></surname>
<given-names><![CDATA[Mario]]></given-names>
</name>
</person-group>
<source><![CDATA[Las transferencias monetarias de Oportunidades y su impacto en la pobreza de las regiones de México]]></source>
<year>2012</year>
<publisher-loc><![CDATA[México ]]></publisher-loc>
<publisher-name><![CDATA[AMCIAD]]></publisher-name>
</nlm-citation>
</ref>
<ref id="B10">
<nlm-citation citation-type="journal">
<person-group person-group-type="author">
<name>
<surname><![CDATA[Claus]]></surname>
<given-names><![CDATA[Iris]]></given-names>
</name>
<name>
<surname><![CDATA[Martínez-Vazquez]]></surname>
<given-names><![CDATA[Jorge]]></given-names>
</name>
<name>
<surname><![CDATA[Vulovic]]></surname>
<given-names><![CDATA[Violeta]]></given-names>
</name>
</person-group>
<article-title xml:lang="en"><![CDATA[Coping with Rising Inequality in Asia: How Effective Are Fiscal Policies?]]></article-title>
<source><![CDATA[Asian Economic Papers]]></source>
<year>2013</year>
<volume>0</volume>
<numero>12</numero>
<issue>12</issue>
<page-range>1-33</page-range></nlm-citation>
</ref>
<ref id="B11">
<nlm-citation citation-type="journal">
<person-group person-group-type="author">
<name>
<surname><![CDATA[Cok]]></surname>
<given-names><![CDATA[Mitja]]></given-names>
</name>
<name>
<surname><![CDATA[Urban]]></surname>
<given-names><![CDATA[Ivica]]></given-names>
</name>
<name>
<surname><![CDATA[Verbic]]></surname>
<given-names><![CDATA[Miroslav]]></given-names>
</name>
</person-group>
<article-title xml:lang="en"><![CDATA[Income redistribution through taxes and social benefits: the case of Slovenia and Croatia]]></article-title>
<source><![CDATA[Panoeconomicus]]></source>
<year>2013</year>
<volume>0</volume>
<numero>60</numero>
<issue>60</issue>
<page-range>667-686</page-range></nlm-citation>
</ref>
<ref id="B12">
<nlm-citation citation-type="journal">
<person-group person-group-type="author">
<name>
<surname><![CDATA[Davidson]]></surname>
<given-names><![CDATA[Russell]]></given-names>
</name>
<name>
<surname><![CDATA[Duclos]]></surname>
<given-names><![CDATA[Jean-Yves]]></given-names>
</name>
</person-group>
<article-title xml:lang="en"><![CDATA[Statistical Inference for the Measurement of the Incidence of Taxes and Transfers]]></article-title>
<source><![CDATA[Econometrica]]></source>
<year>1997</year>
<volume>0</volume>
<numero>65</numero>
<issue>65</issue>
<page-range>1453-1465</page-range></nlm-citation>
</ref>
<ref id="B13">
<nlm-citation citation-type="">
<person-group person-group-type="author">
<name>
<surname><![CDATA[Dougherty]]></surname>
<given-names><![CDATA[Sean]]></given-names>
</name>
<name>
<surname><![CDATA[Escobar]]></surname>
<given-names><![CDATA[Octavio]]></given-names>
</name>
</person-group>
<source><![CDATA[The Determinants of Informality in Mexico's States]]></source>
<year>2013</year>
</nlm-citation>
</ref>
<ref id="B14">
<nlm-citation citation-type="book">
<person-group person-group-type="author">
<name>
<surname><![CDATA[Duclos]]></surname>
<given-names><![CDATA[Jean-Yves]]></given-names>
</name>
<name>
<surname><![CDATA[Araar]]></surname>
<given-names><![CDATA[Abdelkrim]]></given-names>
</name>
</person-group>
<article-title xml:lang="en"><![CDATA[Measuring Progressivity and Vertical Equity]]></article-title>
<person-group person-group-type="editor">
<name>
<surname><![CDATA[Duclos]]></surname>
<given-names><![CDATA[J. Y.]]></given-names>
</name>
<name>
<surname><![CDATA[Araar]]></surname>
<given-names><![CDATA[A.]]></given-names>
</name>
</person-group>
<source><![CDATA[Poverty and Equity. Measurement, Policy, and Estimation with DAD]]></source>
<year>2006</year>
<page-range>127-132</page-range><publisher-loc><![CDATA[New-York ]]></publisher-loc>
<publisher-name><![CDATA[Springer]]></publisher-name>
</nlm-citation>
</ref>
<ref id="B15">
<nlm-citation citation-type="journal">
<person-group person-group-type="author">
<name>
<surname><![CDATA[Duclos]]></surname>
<given-names><![CDATA[Jean-Yves]]></given-names>
</name>
<name>
<surname><![CDATA[Tabi]]></surname>
<given-names><![CDATA[Martin]]></given-names>
</name>
</person-group>
<article-title xml:lang="en"><![CDATA[The measurement of progressivity, with an application to Canada]]></article-title>
<source><![CDATA[The Canadian Journal of Economics]]></source>
<year>1996</year>
<volume>29</volume>
<numero>1</numero>
<issue>1</issue>
<page-range>s165-s170</page-range></nlm-citation>
</ref>
<ref id="B16">
<nlm-citation citation-type="journal">
<person-group person-group-type="author">
<name>
<surname><![CDATA[Duclos]]></surname>
<given-names><![CDATA[Jean-Yves]]></given-names>
</name>
<name>
<surname><![CDATA[Jalbert]]></surname>
<given-names><![CDATA[Vincent]]></given-names>
</name>
<name>
<surname><![CDATA[Araar]]></surname>
<given-names><![CDATA[Abdelkrim]]></given-names>
</name>
</person-group>
<article-title xml:lang="en"><![CDATA[Classical horizontal inequity and reranking: an integrated approach]]></article-title>
<source><![CDATA[Research on Economic Inequality]]></source>
<year>2003</year>
<volume>8</volume>
<numero>10</numero>
<issue>10</issue>
<page-range>65-100</page-range></nlm-citation>
</ref>
<ref id="B17">
<nlm-citation citation-type="book">
<person-group person-group-type="author">
<name>
<surname><![CDATA[Duclos]]></surname>
<given-names><![CDATA[Jean-Yves]]></given-names>
</name>
<name>
<surname><![CDATA[Makdissi]]></surname>
<given-names><![CDATA[Paul]]></given-names>
</name>
<name>
<surname><![CDATA[Araar]]></surname>
<given-names><![CDATA[Abdelkrim]]></given-names>
</name>
</person-group>
<source><![CDATA[Pro-Poor Tax Reforms, with an Application to Mexico]]></source>
<year>2010</year>
<publisher-name><![CDATA[CIRPEE/Université Laval]]></publisher-name>
</nlm-citation>
</ref>
<ref id="B18">
<nlm-citation citation-type="journal">
<person-group person-group-type="author">
<name>
<surname><![CDATA[Duclos]]></surname>
<given-names><![CDATA[Jean-Yves]]></given-names>
</name>
<name>
<surname><![CDATA[Makdissi]]></surname>
<given-names><![CDATA[Paul]]></given-names>
</name>
<name>
<surname><![CDATA[Wodon]]></surname>
<given-names><![CDATA[Quentin]]></given-names>
</name>
</person-group>
<article-title xml:lang="en"><![CDATA[Poverty-dominant program reforms: the role of targeting and allocation rules]]></article-title>
<source><![CDATA[Journal of Development Economics]]></source>
<year>2005</year>
<volume>0</volume>
<numero>77</numero>
<issue>77</issue>
<page-range>53-73</page-range></nlm-citation>
</ref>
<ref id="B19">
<nlm-citation citation-type="book">
<person-group person-group-type="author">
<name>
<surname><![CDATA[Duncan]]></surname>
<given-names><![CDATA[Denvil]]></given-names>
</name>
</person-group>
<source><![CDATA[Essays on Personal Income Taxation and Income Inequality]]></source>
<year>2010</year>
<publisher-name><![CDATA[Georgia State University]]></publisher-name>
</nlm-citation>
</ref>
<ref id="B20">
<nlm-citation citation-type="journal">
<person-group person-group-type="author">
<name>
<surname><![CDATA[Flores]]></surname>
<given-names><![CDATA[Daniel]]></given-names>
</name>
</person-group>
<article-title xml:lang="es"><![CDATA[Un incremento en la tasa del IVA sobre los alimentos: ¿eficiencia, equidad o recaudación?]]></article-title>
<source><![CDATA[Ensayos de Economía]]></source>
<year>2003</year>
<volume>23</volume>
<numero>2</numero>
<issue>2</issue>
<page-range>1-14</page-range></nlm-citation>
</ref>
<ref id="B21">
<nlm-citation citation-type="book">
<person-group person-group-type="author">
<name>
<surname><![CDATA[Hernández]]></surname>
<given-names><![CDATA[D.]]></given-names>
</name>
<name>
<surname><![CDATA[Vázquez]]></surname>
<given-names><![CDATA[Sirenia]]></given-names>
</name>
</person-group>
<source><![CDATA[La focalización como estrategia de política pública]]></source>
<year>2005</year>
<publisher-name><![CDATA[SEDESOL]]></publisher-name>
</nlm-citation>
</ref>
<ref id="B22">
<nlm-citation citation-type="journal">
<person-group person-group-type="author">
<name>
<surname><![CDATA[Huesca]]></surname>
<given-names><![CDATA[Luis]]></given-names>
</name>
<name>
<surname><![CDATA[Serrano]]></surname>
<given-names><![CDATA[Alfredo]]></given-names>
</name>
</person-group>
<article-title xml:lang="es"><![CDATA[Impacto fiscal redistributivo desagregado del Impuesto al Valor Agregado en México: Vías de reforma]]></article-title>
<source><![CDATA[Investigación Económica]]></source>
<year>2005</year>
<volume>64</volume>
<numero>253</numero>
<issue>253</issue>
<page-range>89-122</page-range></nlm-citation>
</ref>
<ref id="B23">
<nlm-citation citation-type="book">
<collab>INEGI</collab>
<source><![CDATA[Encuesta Nacional de Ingresos y Gastos de los Hogares, 2012. ENIGH]]></source>
<year>2013</year>
<publisher-loc><![CDATA[México ]]></publisher-loc>
<publisher-name><![CDATA[INEGI]]></publisher-name>
</nlm-citation>
</ref>
<ref id="B24">
<nlm-citation citation-type="">
<collab>INEGI</collab>
<source><![CDATA[Data: Cuadro Resumen Indicadores de ocupación y empleo al cuarto trimestre de 2013]]></source>
<year>2014</year>
</nlm-citation>
</ref>
<ref id="B25">
<nlm-citation citation-type="journal">
<person-group person-group-type="author">
<name>
<surname><![CDATA[Kaplanoglou]]></surname>
<given-names><![CDATA[Georgia]]></given-names>
</name>
<name>
<surname><![CDATA[Newberry]]></surname>
<given-names><![CDATA[David M.]]></given-names>
</name>
</person-group>
<article-title xml:lang="en"><![CDATA[Horizontal Inequity and Vertical Redistribution with Indirect Taxes: The Greek Case]]></article-title>
<source><![CDATA[Fiscal Studies]]></source>
<year>2008</year>
<volume>29</volume>
<numero>2</numero>
<issue>2</issue>
<page-range>257-284</page-range></nlm-citation>
</ref>
<ref id="B26">
<nlm-citation citation-type="journal">
<person-group person-group-type="author">
<name>
<surname><![CDATA[Kakwani]]></surname>
<given-names><![CDATA[Nanak]]></given-names>
</name>
</person-group>
<article-title xml:lang="en"><![CDATA[Measurement of tax progressivity: An international comparison]]></article-title>
<source><![CDATA[The Economic Journal]]></source>
<year>1977</year>
<volume>0</volume>
<numero>87</numero>
<issue>87</issue>
<page-range>71-80</page-range></nlm-citation>
</ref>
<ref id="B27">
<nlm-citation citation-type="">
<person-group person-group-type="author">
<name>
<surname><![CDATA[Kumler]]></surname>
<given-names><![CDATA[Todd]]></given-names>
</name>
<name>
<surname><![CDATA[Verhoogen]]></surname>
<given-names><![CDATA[Eric]]></given-names>
</name>
<name>
<surname><![CDATA[Frías]]></surname>
<given-names><![CDATA[Judith. A.]]></given-names>
</name>
</person-group>
<source><![CDATA[Enlisting Employees in Improving Pay roll tax Compliance: Evidence from Mexico]]></source>
<year>2013</year>
</nlm-citation>
</ref>
<ref id="B28">
<nlm-citation citation-type="journal">
<person-group person-group-type="author">
<name>
<surname><![CDATA[Lambert]]></surname>
<given-names><![CDATA[Peter, J.]]></given-names>
</name>
</person-group>
<article-title xml:lang="en"><![CDATA[On the redistributive effect of taxes and benefits]]></article-title>
<source><![CDATA[Scottish Journal of Political Economy]]></source>
<year>1985</year>
<volume>32</volume>
<numero>1</numero>
<issue>1</issue>
<page-range>39-54</page-range></nlm-citation>
</ref>
<ref id="B29">
<nlm-citation citation-type="journal">
<person-group person-group-type="author">
<name>
<surname><![CDATA[Lustig]]></surname>
<given-names><![CDATA[Nora]]></given-names>
</name>
<name>
<surname><![CDATA[Pessino]]></surname>
<given-names><![CDATA[Carola]]></given-names>
</name>
<name>
<surname><![CDATA[Scott]]></surname>
<given-names><![CDATA[John]]></given-names>
</name>
</person-group>
<article-title xml:lang="en"><![CDATA[The Impact of Taxes and Social Spending on Inequality and Poverty in Argentina, Bolivia, Brazil, Mexico, Peru, and Uruguay: Introduction to the Special Issue]]></article-title>
<source><![CDATA[Public Finance Review]]></source>
<year>2014</year>
<volume>0</volume>
<numero>42</numero>
<issue>42</issue>
<page-range>287-303</page-range></nlm-citation>
</ref>
<ref id="B30">
<nlm-citation citation-type="book">
<person-group person-group-type="author">
<name>
<surname><![CDATA[Makdissi]]></surname>
<given-names><![CDATA[Paul]]></given-names>
</name>
<name>
<surname><![CDATA[Wodon]]></surname>
<given-names><![CDATA[Quentin]]></given-names>
</name>
</person-group>
<source><![CDATA[Migration, Poverty, and Housing: Welfare comparisons Using Sequential Stochastic Dominance]]></source>
<year>2002</year>
<publisher-name><![CDATA[Departement d'Economique de la Faculte d'administration à l'Universite de Sherbrooke]]></publisher-name>
</nlm-citation>
</ref>
<ref id="B31">
<nlm-citation citation-type="journal">
<person-group person-group-type="author">
<name>
<surname><![CDATA[Musgrave]]></surname>
<given-names><![CDATA[Richard]]></given-names>
</name>
</person-group>
<article-title xml:lang="en"><![CDATA[Horizontal Equity, Once More]]></article-title>
<source><![CDATA[National Tax Journal]]></source>
<year>1990</year>
<volume>43</volume>
<numero>2</numero>
<issue>2</issue>
<page-range>113-122</page-range></nlm-citation>
</ref>
<ref id="B32">
<nlm-citation citation-type="book">
<person-group person-group-type="author">
<name>
<surname><![CDATA[Musgrave]]></surname>
<given-names><![CDATA[Richard]]></given-names>
</name>
</person-group>
<article-title xml:lang="en"><![CDATA[Fiscal Tasks]]></article-title>
<person-group person-group-type="editor">
<name>
<surname><![CDATA[Buchanan]]></surname>
<given-names><![CDATA[J.]]></given-names>
</name>
<name>
<surname><![CDATA[A. Musgrave]]></surname>
<given-names><![CDATA[R]]></given-names>
</name>
</person-group>
<source><![CDATA[Public Finance and Public Choice: Two Contrasting Visions of the State]]></source>
<year>2001</year>
<page-range>63-82</page-range><publisher-name><![CDATA[Massachusetts Institute of Technology]]></publisher-name>
</nlm-citation>
</ref>
<ref id="B33">
<nlm-citation citation-type="journal">
<person-group person-group-type="author">
<name>
<surname><![CDATA[Musgrave]]></surname>
<given-names><![CDATA[Richard]]></given-names>
</name>
<name>
<surname><![CDATA[Thin]]></surname>
<given-names><![CDATA[T.]]></given-names>
</name>
</person-group>
<article-title xml:lang="en"><![CDATA[Income tax progression]]></article-title>
<source><![CDATA[Journal of Political Economy]]></source>
<year>1948</year>
<volume>0</volume>
<numero>56</numero>
<issue>56</issue>
<page-range>498-514</page-range></nlm-citation>
</ref>
<ref id="B34">
<nlm-citation citation-type="book">
<person-group person-group-type="author">
<name>
<surname><![CDATA[Pechman]]></surname>
<given-names><![CDATA[Joseph A.]]></given-names>
</name>
</person-group>
<source><![CDATA[Who pays the taxes, 1966-1985?]]></source>
<year>1985</year>
<publisher-loc><![CDATA[Washington^eDC DC]]></publisher-loc>
<publisher-name><![CDATA[Brookings Institution]]></publisher-name>
</nlm-citation>
</ref>
<ref id="B35">
<nlm-citation citation-type="book">
<person-group person-group-type="author">
<name>
<surname><![CDATA[Pechman]]></surname>
<given-names><![CDATA[Joseph A.]]></given-names>
</name>
<name>
<surname><![CDATA[Okner]]></surname>
<given-names><![CDATA[B.]]></given-names>
</name>
</person-group>
<source><![CDATA[Who Bears the Tax Burden?]]></source>
<year>1974</year>
<publisher-loc><![CDATA[Washington^eDC DC]]></publisher-loc>
<publisher-name><![CDATA[Brookings Institution]]></publisher-name>
</nlm-citation>
</ref>
<ref id="B36">
<nlm-citation citation-type="book">
<person-group person-group-type="author">
<name>
<surname><![CDATA[Reynolds]]></surname>
<given-names><![CDATA[Morgan]]></given-names>
</name>
<name>
<surname><![CDATA[Smolensky]]></surname>
<given-names><![CDATA[Eugene]]></given-names>
</name>
</person-group>
<source><![CDATA[Public expenditure, taxes and the distribution of income: The United States. 1950, 1961, 1970]]></source>
<year>1977</year>
<publisher-loc><![CDATA[New York ]]></publisher-loc>
<publisher-name><![CDATA[Academic Press]]></publisher-name>
</nlm-citation>
</ref>
<ref id="B37">
<nlm-citation citation-type="journal">
<person-group person-group-type="author">
<name>
<surname><![CDATA[Scott]]></surname>
<given-names><![CDATA[John]]></given-names>
</name>
</person-group>
<article-title xml:lang="en"><![CDATA[Redistributive Impact and Efficiency of Mexico's fiscal system]]></article-title>
<source><![CDATA[Public Finance Review]]></source>
<year>2014</year>
<volume>0</volume>
<numero>42</numero>
<issue>42</issue>
<page-range>368-390</page-range></nlm-citation>
</ref>
<ref id="B38">
<nlm-citation citation-type="journal">
<person-group person-group-type="author">
<name>
<surname><![CDATA[Valero-Gil]]></surname>
<given-names><![CDATA[Jorge]]></given-names>
</name>
</person-group>
<article-title xml:lang="es"><![CDATA[La distribución de los bienes en México]]></article-title>
<source><![CDATA[Problemas del Desarrollo]]></source>
<year>2002</year>
<volume>33</volume>
<numero>130</numero>
<issue>130</issue>
<page-range>7-34</page-range></nlm-citation>
</ref>
<ref id="B39">
<nlm-citation citation-type="journal">
<person-group person-group-type="author">
<name>
<surname><![CDATA[Valero-Gil]]></surname>
<given-names><![CDATA[Jorge]]></given-names>
</name>
</person-group>
<article-title xml:lang="es"><![CDATA[Estimación de elasticidades e impuestos óptimos a los bienes más consumidos en México]]></article-title>
<source><![CDATA[Estudios Económicos]]></source>
<year>2006</year>
<volume>21</volume>
<numero>2</numero>
<issue>2</issue>
<page-range>127-176</page-range></nlm-citation>
</ref>
<ref id="B40">
<nlm-citation citation-type="book">
<person-group person-group-type="author">
<name>
<surname><![CDATA[Vargas]]></surname>
<given-names><![CDATA[César O.]]></given-names>
</name>
</person-group>
<source><![CDATA[Incidencia fiscal y del gasto sobre la renta familiar: un enfoque de microdatos para México 1984-2002]]></source>
<year>2006</year>
<publisher-loc><![CDATA[Barcelona ]]></publisher-loc>
<publisher-name><![CDATA[Universidad Autónoma de Barcelona, Departamento de Economía Aplicada]]></publisher-name>
</nlm-citation>
</ref>
<ref id="B41">
<nlm-citation citation-type="journal">
<person-group person-group-type="author">
<name>
<surname><![CDATA[Yitzhaki]]></surname>
<given-names><![CDATA[Shlomo]]></given-names>
</name>
<name>
<surname><![CDATA[Slemrod]]></surname>
<given-names><![CDATA[Joel]]></given-names>
</name>
</person-group>
<article-title xml:lang="en"><![CDATA[Welfare Dominance: An Application to Commodity Taxation]]></article-title>
<source><![CDATA[American Economic Review]]></source>
<year>1991</year>
<volume>81</volume>
<numero>3</numero>
<issue>3</issue>
<page-range>480-96</page-range></nlm-citation>
</ref>
<ref id="B42">
<nlm-citation citation-type="journal">
<person-group person-group-type="author">
<name>
<surname><![CDATA[Yitzhaki]]></surname>
<given-names><![CDATA[Shlomo]]></given-names>
</name>
<name>
<surname><![CDATA[Thirsk]]></surname>
<given-names><![CDATA[Wayne]]></given-names>
</name>
</person-group>
<article-title xml:lang="en"><![CDATA[Welfare Dominance and the Design of Excise Taxation in the Cote D'Ivoire]]></article-title>
<source><![CDATA[Journal of Development Economics]]></source>
<year>1990</year>
<volume>0</volume>
<numero>33</numero>
<issue>33</issue>
<page-range>1-18</page-range></nlm-citation>
</ref>
</ref-list>
</back>
</article>
