<?xml version="1.0" encoding="ISO-8859-1"?><article xmlns:mml="http://www.w3.org/1998/Math/MathML" xmlns:xlink="http://www.w3.org/1999/xlink" xmlns:xsi="http://www.w3.org/2001/XMLSchema-instance">
<front>
<journal-meta>
<journal-id>0187-6236</journal-id>
<journal-title><![CDATA[Atmósfera]]></journal-title>
<abbrev-journal-title><![CDATA[Atmósfera]]></abbrev-journal-title>
<issn>0187-6236</issn>
<publisher>
<publisher-name><![CDATA[Universidad Nacional Autónoma de México, Instituto de Ciencias de la Atmósfera y Cambio Climático]]></publisher-name>
</publisher>
</journal-meta>
<article-meta>
<article-id>S0187-62362011000300002</article-id>
<title-group>
<article-title xml:lang="en"><![CDATA[May the NAO index be used to forecast rain in Spain?]]></article-title>
</title-group>
<contrib-group>
<contrib contrib-type="author">
<name>
<surname><![CDATA[CASTRO]]></surname>
<given-names><![CDATA[A.]]></given-names>
</name>
</contrib>
<contrib contrib-type="author">
<name>
<surname><![CDATA[VIDAL]]></surname>
<given-names><![CDATA[M. I.]]></given-names>
</name>
</contrib>
<contrib contrib-type="author">
<name>
<surname><![CDATA[CALVO]]></surname>
<given-names><![CDATA[A. I.]]></given-names>
</name>
</contrib>
<contrib contrib-type="author">
<name>
<surname><![CDATA[FERNÁNDEZ-RAGA]]></surname>
<given-names><![CDATA[M.]]></given-names>
</name>
</contrib>
<contrib contrib-type="author">
<name>
<surname><![CDATA[FRAILE]]></surname>
<given-names><![CDATA[R.]]></given-names>
</name>
</contrib>
</contrib-group>
<aff id="A01">
<institution><![CDATA[,Universidad de León Facultad de Ciencias Biológicas y Ambientales Departamento de Física]]></institution>
<addr-line><![CDATA[León ]]></addr-line>
<country>España</country>
</aff>
<aff id="A02">
<institution><![CDATA[,Universidade de Aveiro Centro de Estudos do Ambiente e do Mar (CESAM) ]]></institution>
<addr-line><![CDATA[Aveiro ]]></addr-line>
<country>Portugal</country>
</aff>
<aff id="A03">
<institution><![CDATA[,Universidad de León Facultad de Ciencias Biológicas y Ambientales Departamento de Física]]></institution>
<addr-line><![CDATA[León ]]></addr-line>
<country>España</country>
</aff>
<pub-date pub-type="pub">
<day>00</day>
<month>07</month>
<year>2011</year>
</pub-date>
<pub-date pub-type="epub">
<day>00</day>
<month>07</month>
<year>2011</year>
</pub-date>
<volume>24</volume>
<numero>3</numero>
<fpage>251</fpage>
<lpage>265</lpage>
<copyright-statement/>
<copyright-year/>
<self-uri xlink:href="http://www.scielo.org.mx/scielo.php?script=sci_arttext&amp;pid=S0187-62362011000300002&amp;lng=en&amp;nrm=iso"></self-uri><self-uri xlink:href="http://www.scielo.org.mx/scielo.php?script=sci_abstract&amp;pid=S0187-62362011000300002&amp;lng=en&amp;nrm=iso"></self-uri><self-uri xlink:href="http://www.scielo.org.mx/scielo.php?script=sci_pdf&amp;pid=S0187-62362011000300002&amp;lng=en&amp;nrm=iso"></self-uri><abstract abstract-type="short" xml:lang="es"><p><![CDATA[Este trabajo estudia la influencia de la Oscilación del Atlántico Norte (NAO) en el régimen de precipitaciones mensuales, estacionales y anuales de la España Peninsular. Para ello se han utilizado los datos mensuales de precipitación de 325 estaciones pluviométricas repartidas homogéneamente y los índices mensuales del índice NAO desde 1961 a 1998; se han usado un total de 5525 series de precipitación. El estudio se ha realizado mediante correlaciones lineales simples o múltiples entre estas variables utilizando diferentes combinaciones. Se trata de ver si se podría predecir la precipitación mensual, estacional o bien anual a partir de datos previos de precipitación y del índice NAO. Se han representado espacialmente las zonas geográficas cuyos observatorios manifiestan una correlación estadísticamente significativa. Los resultados difieren del tipo de correlación elegido, pero en general los mejores resultados se encuentran en los meses de invierno. Por último, se ha aplicado esta metodología al Valle del Ebro y se ha observado que una combinación del índice NAO de primavera y verano, junto con la precipitación registrada en esas dos estaciones podría ser útil para predecir la precipitación de otoño.]]></p></abstract>
<abstract abstract-type="short" xml:lang="en"><p><![CDATA[This paper studies the influence of the North Atlantic Oscillation (NAO) on monthly, seasonal and annual precipitation regimes in continental Spain. The data used for this study include the monthly rain series of 325 meteorological stations distributed homogeneously over the study zone, and the monthly NAO indices from 1961 to 1998. A total of 5525 rain series were employed for the analysis. Simple and multiple linear correlations were established between these variables in different combinations. The main aim was to check whether monthly, seasonal or annual precipitation data could be predicted using earlier precipitation data and the NAO index. The geographical areas where the stations have shown a statistically significant correlation have been represented on maps. The results differ depending on the correlation, but, in general, the best results have been found in the fall and winter months. Finally, a practical application of the method was carried out in the Ebro Valley and it was observed that the combination of the NAO index for spring and summer and the precipitation registered in those two seasons may be useful to forecast rain in the fall.]]></p></abstract>
<kwd-group>
<kwd lng="en"><![CDATA[North Atlantic Oscillation (NAO)]]></kwd>
<kwd lng="en"><![CDATA[precipitation]]></kwd>
<kwd lng="en"><![CDATA[forecasting]]></kwd>
<kwd lng="en"><![CDATA[Spain]]></kwd>
<kwd lng="en"><![CDATA[Ebro Valle]]></kwd>
</kwd-group>
</article-meta>
</front><body><![CDATA[ <p align="center"><font face="verdana" size="4"><b>May the NAO index be used to forecast rain in Spain?</b></font></p>     <p align="center"><font face="verdana" size="2">&nbsp;</font></p>     <p align="center"><font face="verdana" size="2"><b>A. CASTRO, M. I. VIDAL    <br> </b><i>Departamento de F&iacute;sica, Facultad de Ciencias Biol&oacute;gicas y Ambientales, Universidad de Le&oacute;n, 24071 Le&oacute;n, Espa&ntilde;a</i></font></p>     <p align="center"><font face="verdana" size="2">&nbsp;</font></p>     <p align="center"><font face="verdana" size="2"><b>A. I. CALVO    <br> </b><i>Centro de Estudos do Ambiente e do Mar (CESAM), Universidade de Aveiro, Aveiro, Portugal</i></font></p>     <p align="center"><font face="verdana" size="2">&nbsp;</font></p>     <p align="center"><font face="verdana" size="2"><b>M. FERN&Aacute;NDEZ&#150;RAGA and R. FRAILE    <br> </b><i>Departamento de F&iacute;sica, Facultad de Ciencias Biol&oacute;gicas y Ambientales, Universidad de Le&oacute;n, 24071 Le&oacute;n, Espa&ntilde;a. Corresponding author: R. Fraile; e&#150;mail:</i> <a href="mailto:roberto.fraile@unileon.es">roberto.fraile@unileon.es</a>.</font></p>     ]]></body>
<body><![CDATA[<p align="center"><font face="verdana" size="2">&nbsp;</font></p>     <p align="center"><font face="verdana" size="2">Received February 2, 2010; accepted September 15, 2010</font></p>     <p align="justify"><font face="verdana" size="2">&nbsp;</font></p>     <p align="justify"><font face="verdana" size="2"><b>RESUMEN</b></font></p>     <p align="justify"><font face="verdana" size="2">Este trabajo estudia la influencia de la Oscilaci&oacute;n del Atl&aacute;ntico Norte (NAO) en el r&eacute;gimen de precipitaciones mensuales, estacionales y anuales de la Espa&ntilde;a Peninsular. Para ello se han utilizado los datos mensuales de precipitaci&oacute;n de 325 estaciones pluviom&eacute;tricas repartidas homog&eacute;neamente y los &iacute;ndices mensuales del &iacute;ndice NAO desde 1961 a 1998; se han usado un total de 5525 series de precipitaci&oacute;n. El estudio se ha realizado mediante correlaciones lineales simples o m&uacute;ltiples entre estas variables utilizando diferentes combinaciones. Se trata de ver si se podr&iacute;a predecir la precipitaci&oacute;n mensual, estacional o bien anual a partir de datos previos de precipitaci&oacute;n y del &iacute;ndice NAO. Se han representado espacialmente las zonas geogr&aacute;ficas cuyos observatorios manifiestan una correlaci&oacute;n estad&iacute;sticamente significativa. Los resultados difieren del tipo de correlaci&oacute;n elegido, pero en general los mejores resultados se encuentran en los meses de invierno. Por &uacute;ltimo, se ha aplicado esta metodolog&iacute;a al Valle del Ebro y se ha observado que una combinaci&oacute;n del &iacute;ndice NAO de primavera y verano, junto con la precipitaci&oacute;n registrada en esas dos estaciones podr&iacute;a ser &uacute;til para predecir la precipitaci&oacute;n de oto&ntilde;o.</font></p>     <p align="justify"><font face="verdana" size="2">&nbsp;</font></p>     <p align="justify"><font face="verdana" size="2"><b>ABSTRACT</b></font></p>     <p align="justify"><font face="verdana" size="2">This paper studies the influence of the North Atlantic Oscillation (NAO) on monthly, seasonal and annual precipitation regimes in continental Spain. The data used for this study include the monthly rain series of 325 meteorological stations distributed homogeneously over the study zone, and the monthly NAO indices from 1961 to 1998. A total of 5525 rain series were employed for the analysis. Simple and multiple linear correlations were established between these variables in different combinations. The main aim was to check whether monthly, seasonal or annual precipitation data could be predicted using earlier precipitation data and the NAO index. The geographical areas where the stations have shown a statistically significant correlation have been represented on maps. The results differ depending on the correlation, but, in general, the best results have been found in the fall and winter months. Finally, a practical application of the method was carried out in the Ebro Valley and it was observed that the combination of the NAO index for spring and summer and the precipitation registered in those two seasons may be useful to forecast rain in the fall.</font></p>     <p align="justify"><font face="verdana" size="2"><b>Keywords:</b> North Atlantic Oscillation (NAO), precipitation, forecasting, Spain, Ebro Valley.</font></p>     <p align="justify"><font face="verdana" size="2">&nbsp;</font></p>     ]]></body>
<body><![CDATA[<p align="justify"><font size="2" face="verdana"><b>1.Introduction</b></font></p>     <p align="justify"><font size="2" face="verdana">In the past few years the number of studies on the NAO index has increased considerably. This index influences the climate in Western Europe in particular (Wanner <i>et al.</i>, 2001). The strong positive trend of the NAO detected over the past 30 years has been the focus of many scientific analyses. The most outstanding anomalies were registered in the winter of 1989 (Hurrell, 1995; Walsh, 1996; Thompson and Wallace, 1998; Watanabe and Nitta, 1999). One of the climatic consequences observed are regional changes in the precipitation patterns (Hurrell, 1995; Hurrell and van Loon, 1997; Dai <i>et al.</i>, 1997; Garc&iacute;a <i>et al.</i>, 2005).</font></p>     <p align="justify"><font face="verdana" size="2">Studies on global climatic change carried out by the IPCC (2001) show that during the 20th century the average annual rainfall has increased between 7 and 12% in regions between 30 and 85 &deg;N, while it tends to decrease in latitudes under 30 &deg;N. The most recent report (IPCC, 2007), comments that the annual precipitation has increased in most of northern Europe and decreased in most of the Mediterranean area, where there was a decrease also in the annual number of precipitation days. In addition, southern Europe and parts of central Europe as well as North Africa are characterized by a drier winter during the positive phase of the NAO, while the reverse is true in the British Isles, Fennoscandia and northwestern Russia. Changes in the precipitation regimes have also been detected in the past few decades in continental Spain (Mossmann <i>et al.</i>, 2004; del R&iacute;o <i>et al.</i>, 2005). Bearing in mind these data, the questions that arise are the following: Is the NAO the cause of these changes in the rainfall in Western Europe? Is there a way to forecast the amount of rain that will fall using the NAO index?</font></p>     <p align="justify"><font face="verdana" size="2">The aim of this paper is to analyze the influence of the NAO on the rainfall regime in Spain. Linear correlations have been established between monthly rainfall data and monthly NAO indices for different months. Several combinations have been considered. Similar correlations have been established with seasonal rainfall data and seasonal NAO values, again in various combinations.</font></p>     <p align="justify"><font face="verdana" size="2">In those cases where the correlations are statistically significant, it will be possible to forecast the monthly or seasonal precipitation by using the variables it correlates well with (precipitation data in the previous months or seasons and NAO values). As an example, one of these linear models will be applied onto the rainfall regime in the Ebro Valley, Spain.</font></p>     <p align="justify"><font face="verdana" size="2">&nbsp;</font></p>     <p align="justify"><font face="verdana" size="2"><b>2. Databases</b></font></p>     <p align="justify"><font face="verdana" size="2"><i>2.1 Precipitation</i></font></p>     <p align="justify"><font face="verdana" size="2">
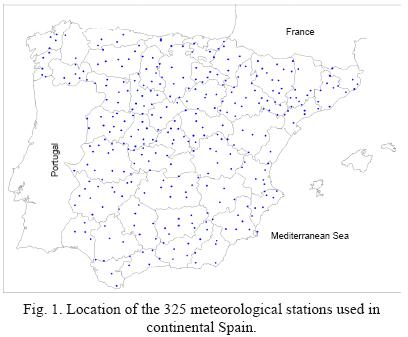
This study has been carried out in the Spanish part of the Iberian Peninsula, i.e. continental Spain (<a href="#f1">Fig. 1</a>). Monthly rainfall series from 325 meteorological stations were used (a density of one rainfall station per 2000 km&sup2;). The data were provided by the National Institute for Meteorology in Spain for the period between 1961 and 1998.</font></p>     <p align="center"><font size="2" face="verdana"><a name="f1"></a></font></p>     ]]></body>
<body><![CDATA[<p align="center"><font size="2" face="verdana"><img src="/img/revistas/atm/v24n3/a2f1.jpg"></font></p>     <p align="justify"><font face="verdana" size="2">The methodology and working procedure used were the following:</font></p>     <p align="justify"><font face="verdana" size="2"><i>2.1.1 Filling gaps</i></font></p>     <p align="justify"><font face="verdana" size="2">The normal&#150;ratio interpolation method was used for filling the gaps in those stations where there were missing data in some series (Paulus and Kohler, 1952). Among the various gap&#150;filling methods available, this particular one has proved to work adequately for rain series (Tang <i>et al.</i>, 1996).</font></p>     <p align="justify"><font face="verdana" size="2"><i>2.1.2 Series homogeneity</i></font></p>     <p align="justify"><font face="verdana" size="2">Once the series were complete, the series with climatic variations or trends were distinguished from those series that presented non&#150;climatic variations. The methodology employed for this study did not take into account non&#150;climatic variations. The non&#150;parametric Kruskal&#150;Wallis homogeneity test was applied (Essenwanger, 1986) for a significance level of 5% (&#945; = 0.05). Each series consisted of 38 data. The threshold value of the H statistic for accepting the null hypothesis was of 52.16 for 37 degrees of freedom (Lindey and Scott, 1984). The results showed that there were 325 weather stations with homogeneous monthly rainfall series.</font></p>     <p align="justify"><font face="verdana" size="2"><i>2.1.3 Rainfall series</i></font></p>     <p align="justify"><font face="verdana" size="2">Apart from the monthly rainfall series, the four seasonal series were also added (spring, summer, fall and winter), as well as the annual series. Thus, 17 rain series were analyzed for each meteorological station (12 monthly series, 4 seasonal series and 1 annual series). March, April and May have been grouped together as spring; June, July and August as summer; September, October and November as fall; and December, January and February as winter months. All in all, 5525 series were used for this study. Mossmann (2002) describes further details on the databases.</font></p>     <p align="justify"><font face="verdana" size="2"><i>2.2 North Atlantic Oscillation</i></font></p>     <p align="justify"><font face="verdana" size="2">The NAO index is traditionally defined as the normalized pressure difference at sea level between a station on the Azores and one on Iceland. This index takes on different values depending on the stations used to calculate it. Stykkisholmur (Iceland) is the most widely used northern weather station, although Akureyri is sometimes chosen. On the other hand, Ponta Delgada (Azores), Lisbon or Gibraltar may be used as southern stations. In this study the NAO index has been calculated using the data from Ponta Delgada and Stykkisholmur.</font></p>     ]]></body>
<body><![CDATA[<p align="justify"><font face="verdana" size="2">The necessary data to establish the NAO index have been kindly provided by James W. Hurrell (Climate Analysis Section from the National Center for Atmospheric Research, in Boulder, Colorado). These data were also used to establish the average seasonal and annual NAO. The units used for the NAO index are hPa.</font></p>     <p align="justify"><font face="verdana" size="2">&nbsp;</font></p>     <p align="justify"><font size="2" face="verdana"><b>3. Methodology</b></font></p>     <p align="justify"><font size="2" face="verdana">Two procedures were followed to obtain the results: on the one hand, the linear regressions between the rainfall series and the NAO were processed; on the other hand, contour maps were drawn for every individual study in order to represent the spatial correlations and facilitate the interpretation of the results.</font></p>     <p align="justify"><font size="2" face="verdana"><i>3.1 Linear regressions between rainfall series and NAO</i></font></p>     <p align="justify"><font size="2" face="verdana">Linear regressions of four types were carried out depending on the number of variables involved:</font></p>     <p align="justify"><font size="2" face="verdana">a) linear regressions type <i>y = ax + b</i> between:</font></p>        <p align="justify"><font face="verdana" size="2">NAO for a particular month (variable <i>x</i>) and rainfall in that month (variable <i>y</i>);</font></p>       <p align="justify"><font face="verdana" size="2">NAO for a particular season (variable<i> x</i>) and rainfall in that season (variable <i>y</i>);</font></p>       <p align="justify"><font face="verdana" size="2">NAO for a particular year (variable<i> x</i>) and rainfall in that year (variable <i>y</i>);</font></p>       ]]></body>
<body><![CDATA[<p align="justify"><font face="verdana" size="2">NAO for a particular month (variable<i> x</i>) and rainfall in the following month (variable <i>y</i>);</font></p>       <p align="justify"><font face="verdana" size="2">NAO for a particular season (variable<i> x</i>) and rainfall in the following season (variable <i>y</i>).</font></p>      <p align="justify"><font face="verdana" size="2">b) multiple linear regressions type <i>z = ax + by + c</i> between:</font></p>        <p align="justify"><font face="verdana" size="2">NAO for two consecutive seasons (variables <i>x</i> and <i>y</i>) and rainfall in the following season (variable <i>z</i>);</font></p>       <p align="justify"><font face="verdana" size="2">NAO for a particular month (variable<i> x</i>) and rainfall in that month (variable <i>y</i>) and in the following one (variable <i>z</i>);</font></p>       <p align="justify"><font face="verdana" size="2">NAO for a particular season (variable<i> x</i>) and rainfall in that season (variable <i>y</i>) and in the following one (variable <i>z</i>).</font></p>      <p align="justify"><font face="verdana" size="2">c) multiple linear regressions type <i>w = ax + by + cz + d</i> between:</font></p>  	 	      <p align="justify"><font face="verdana" size="2">NAO for three consecutive seasons (variables <i>x, y, z</i>) and rainfall in the following season (variable <i>w</i>).</font></p>  	    <p align="justify"><font face="verdana" size="2">d) multiple linear regressions type <i>v = ax + by + cz + dw + e</i> between:</font></p>  	 	      <p align="justify"><font face="verdana" size="2">NAO for two consecutive seasons (variables <i>x</i>, <i>y</i>) and rainfall in these two consecutive seasons (variables <i>z, w</i>) in order to forecast the precipitation in the following season (variable <i>v</i>).</font></p>  	    ]]></body>
<body><![CDATA[<p align="justify"><font face="verdana" size="2">Once the constants that define the linear equation have been calculated (a, b, c, d or e) what we have is, depending on the case, a sort of &lsquo;rainfall forecast&rsquo; for the following month, season or year, if the NAO values are known (and the rainfall in previous months or seasons are known, if they were also taken into account).</font></p> 	    <p align="justify"><font face="verdana" size="2">In each linear regression, simple or multiple, the correlation coefficient R was calculated with an explained variance of R<sup>2</sup>. The significant correlations for &#945; = 0.05 were selected when the Pearson R threshold (with N&#150;1 degrees of freedom, and N=38) to accept the null hypothesis was of 0.3165, 0.3206, 0.3246 and 0.3444, for the cases a), b) c) and d), respectively. The meteorological stations that fulfill this condition were represented on maps.</font></p> 	    <p align="justify"><font face="verdana" size="2">The R<sup>2</sup> corresponding to the above mentioned values are about 0.10. Consequently, the contour maps will show positive or negative significant correlations when the squared correlation coefficient exceeds 0.10.</font></p> 	    <p align="justify"><font face="verdana" size="2">A whole of 325 correlations were studied in each analysis, one for each meteorological station. R<sup>2</sup> data are available in 325 places over continental Spain. These data were used to draw the contour maps that represent the spatial distributions of the correlations.</font></p> 	    <p align="justify"><font face="verdana" size="2"><i>3.2 Spatial distribution of rainfall&#150;NAO correlations</i></font></p> 	    <p align="justify"><font face="verdana" size="2">The R<sup>2</sup> values obtained in the different linear regressions for each of the 325 weather stations and the NAO index in each of the 17 monthly, seasonal and annual series from 1961 to 1998 were used to draw contour maps. The aim was to identify relationships between rainfall and NAO and extract relevant conclusions.</font></p> 	    <p align="justify"><font face="verdana" size="2">Areas with a similar R<sup>2</sup> were represented on maps drawing contour lines with the same correlation between rainfall data and NAO. The Kriging interpolation method was used to draw the maps (Isaaks and Srivastava, 1989). The lines in the figures are the boundaries of the geographical areas affected in the same way by the North Atlantic Oscillation in their monthly, seasonal and annual rainfall rates. The correlations are represented using a range of colors, but only so in the case of significant correlation coefficients. Non&#150;significant R<sup>2</sup> have not been represented, in order to highlight the significant geographical areas.</font></p> 	    <p align="justify"><font face="verdana" size="2">But what exactly does R<sup>2</sup> measure? There is an algebraic relationship between R and the regression variance: R<sup>2</sup> (determination coefficient) is the part of the variation of the variable y that is explained by the regression. Thus, R<sup>2</sup> accounts for the explanatory power of the linear model. In this case, it indicates whether the precipitation forecasts using NAO data are statistically acceptable or not, and the explanatory force of the NAO in these forecasts.</font></p> 	    <p align="justify"><font face="verdana" size="2">The sections below describe the most important results found in continental Spain with respect to the relationship between each of the 17 time series analyzed and the NAO index from different points of view. </font></p> 	    <p align="justify"><font face="verdana" size="2">&nbsp;</font></p> 	    ]]></body>
<body><![CDATA[<p align="justify"><font face="verdana" size="2"><b>4. Results</b></font></p> 	    <p align="justify"><font face="verdana" size="2">Only the linear correlations with statistically significant relationships will be commented here.</font></p> 	    <p align="justify"><font face="verdana" size="2"><i>4.1 Correlation between monthly NAO and monthly rainfall</i></font></p> 	    <p align="justify"><font face="verdana" size="2">The analysis indicates that:</font></p> 	 	      <p align="justify"><font face="verdana" size="2">&bull; in October and November (first row in <a href="/img/revistas/atm/v24n3/a2f2.jpg" target="_blank">Fig. 2</a>) there is a significant correlation in wide areas of Spain. However, in October there is a considerable lack of correlation in the eastern part of the country as well as in part of the southern border of the Peninsula. In November there is no significant correlation in the Mediterranean zones and the north of the Peninsula. It can be noted that the areas with good correlations grow gradually every month until they reach their maximum in the winter months;</font></p> 	      <p align="justify"><font face="verdana" size="2">&bull; there is a very significant correlation in the winter months (December, January, Februar<i>y</i>), and also in March, in practically the whole of the study zone, except in the Mediterranean areas and in the north. It is precisely during these months that the effect of the NAO is most clearly observable on the north Atlantic coasts. Therefore, its influence on the Iberian Peninsula can also be felt more intensely during the winter. It may be pointed out that there is no significant correlation in any coastal areas of Spain (see rows 2 and 3 in <a href="/img/revistas/atm/v24n3/a2f2.jpg" target="_blank">Fig. 2</a>);</font></p> 	      <p align="justify"><font face="verdana" size="2">&bull; a significant correlation can also be observed during the spring, but the areas affected by the NAO are smaller. The correlation tends to be less strong as the season advances;</font></p> 	      <p align="justify"><font face="verdana" size="2">&bull; in July and August the correlation between rainfall and NAO is significant in only very few small areas scattered over the country. September shows a correlation in isolated areas mainly in the south of the Peninsula. In these months most of the precipitation is of convective origin and we cannot establish a correlation between the likelihood of storms with rain and the NAO in these months.</font></p>  	    <p align="justify"><font face="verdana" size="2">Summing up, it can be stated that the correlation between rainfall in a particular month and the NAO index in that month varies greatly along the year. There is a good correlation in winter months and in March, whereas the correlation is poor in summer. The correlation decreases as convective precipitation increases, since this type of precipitation is highly localized and does not depend on Atlantic pressures. This ties in with the observations carried out by Mu&ntilde;oz&#150;D&iacute;az and Rodrigo (2003), who have also found a good correlation between precipitation and the NAO index in Spain.</font></p> 	    <p align="justify"><font face="verdana" size="2"><i>4.2 Correlation between seasonal NAO and seasonal rainfall</i></font></p> 	    ]]></body>
<body><![CDATA[<p align="justify"><font face="verdana" size="2">The results in <a href="/img/revistas/atm/v24n3/a2f3.jpg" target="_blank">Figure 3</a> indicate that:</font></p> 	 	      <p align="justify"><font face="verdana" size="2">&bull; there is a good significant correlation in winter over the whole of continental Spain, but not in the northern and eastern coasts;</font></p> 	      <p align="justify"><font face="verdana" size="2">&bull; in spring the geographical areas with significant correlations are smaller, but they still cover the center of the Peninsula. The areas with lack of correlation grow larger in the north and the east;</font></p> 	      <p align="justify"><font face="verdana" size="2">&bull; in summer there is hardly any significant correlation, apart from small isolated areas scattered over the Peninsula;</font></p> 	      <p align="justify"><font face="verdana" size="2">&bull; the correlation increases in fall, but in general it is still not significant in continental Spain. Only a few isolated areas in the center and the south show good correlations between the NAO and fall precipitation.</font></p>  	    <p align="justify"><font face="verdana" size="2">Summing up, the NAO indices for winter and spring correlate very well (although with negative correlation) with the precipitation regime found in those two seasons, but the same cannot be said for the summer and fall.</font></p>  	    <p align="justify"><font face="verdana" size="2"><i>
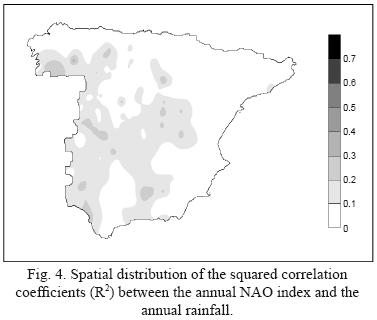
4.3 Correlation between annual NAO and annual rainfall</i></font></p> 	    <p align="justify"><font face="verdana" size="2">It has been found that the annual rainfall correlates significantly with the annual NAO index in some isolated zones of the Peninsula (<a href="#f4">Fig. 4</a>).</font></p> 	    <p align="center"><font size="2" face="verdana"><a name="f4"></a></font></p> 	    <p align="center"><font size="2" face="verdana"><img src="/img/revistas/atm/v24n3/a2f4.jpg"></font></p> 	    ]]></body>
<body><![CDATA[<p align="justify"><font face="verdana" size="2"><i>4.4 Correlation between seasonal NAO and rainfall in the following season</i></font></p> 	    <p align="justify"><font face="verdana" size="2">The authors considered the possibility of forecasting the rainfall in a particular season using the NAO index for the previous season. However, no clear relationship between these two variables was found, indicating that the NAO index is not a good rainfall forecaster in this sense.</font></p> 	    <p align="justify"><font face="verdana" size="2"><i>4.5 Correlation between the NAO of two consecutive seasons and the rainfall in the following season</i></font></p> 	    <p align="justify"><font face="verdana" size="2">Forecasting the rainfall of a particular season by using the NAO indices of the two previous seasons is only acceptable in the case of the fall by using NAO indices for spring and summer. However, this was only found to be applicable to a small part of the Iberian Peninsula.</font></p> 	    <p align="justify"><font face="verdana" size="2"><i>4.6 Correlation between the NAO indices of three consecutive seasons and the rainfall in the following season</i></font></p> 	    <p align="justify"><font face="verdana" size="2">The correlations of the NAO indices of three consecutive seasons to forecast the rainfall in the following season are not good in most of the meteorological stations in Spain. There are only significant correlations in a few small areas. This means that the NAO indices of the three previous seasons do not generally help in forecasting the rainfall in the following season.</font></p> 	    <p align="justify"><font face="verdana" size="2"><i>4.7 Correlation between monthly NAO and the rainfall in the following month</i></font></p> 	    <p align="justify"><font face="verdana" size="2">As in the case of seasons, no significant correlations were found between the monthly NAO index and the rainfall in the next month. This means that the monthly rain forecast by using the NAO index of the previous month is not useful, except in the months of February, March, November and January in small isolated zones.</font></p> 	    <p align="justify"><font face="verdana" size="2">In any case, the best correlations occur again in the winter months.</font></p> 	    <p align="justify"><font face="verdana" size="2"><i>4.8 Correlation between monthly rainfall + monthly NAO and the rainfall of the following month</i></font></p> 	    ]]></body>
<body><![CDATA[<p align="justify"><font face="verdana" size="2">For example, the rainfall in May would be forecast using the NAO index and the rainfall in April. It has been found that (see <a href="/img/revistas/atm/v24n3/a2f5.jpg" target="_blank">Fig. 5</a>):</font></p> 	 	      <p align="justify"><font face="verdana" size="2"> in January and February there is a significant correlation stretching from the north&#150;east to the south&#150;west of the Peninsula. It must be pointed out that there is no significant correlation in the Mediterranean coast or in the northern coast;</font></p> 	      <p align="justify"><font face="verdana" size="2">&bull; the correlation used to forecast the rainfall in March was significant in the northern half of the Peninsula. The northern coast shows a particularly good correlation.</font></p>  	    <p align="justify"><font face="verdana" size="2">The spatial representation of the correlations for the rainfall forecast in April, May, June, July, August and September showed that:</font></p> 	 	      <p align="justify"><font face="verdana" size="2">&bull; from April on the significant correlations occur only in isolated zones;</font></p> 	      <p align="justify"><font face="verdana" size="2">&bull; there is no good correlation in April, it improves in May with a higher number of zones, and it keeps the same in June, July, August and September;</font></p> 	      <p align="justify"><font face="verdana" size="2">&bull; the reason may be the fact that &#150; especially in the summer months &#150; precipitation is mainly convective. This type of precipitation is highly localized and does not depend on Atlantic pressures;</font></p> 	      <p align="justify"><font face="verdana" size="2">&bull; in October there is an increase in the significant correlations, which continues in November and December;</font></p> 	      <p align="justify"><font face="verdana" size="2">&bull; in October the best correlations are located in isolated zones of the southern plateau;</font></p> 	      <p align="justify"><font face="verdana" size="2">&bull; in November, the correlation spreads over the Peninsula, and the isolated zones are larger. The long line between the northeast and the southwest shows a good correlation, together with additional zones in the northern plateau;</font></p> 	      ]]></body>
<body><![CDATA[<p align="justify"><font face="verdana" size="2">&bull; the significant correlations found to forecast the rainfall in December are located in small isolated areas in the south&#150;west of the Peninsula;</font></p>  	    <p align="justify"><font face="verdana" size="2">It may be concluded that the forecasts that can be made using precipitation data and the NAO index for a particular month, to forecast the rainfall in the following month are relatively good in several months of the year, especially in January, February and March. The correlations are not good in spring and summer months, especially in the summer, due to the presence of convective precipitation.</font></p> 	    <p align="justify"><font face="verdana" size="2"><i>4.9 Correlation between seasonal rainfall + seasonal NAO and the rainfall in the following season</i></font></p> 	    <p align="justify"><font face="verdana" size="2">In general, there are no significant correlations in enough places to produce a reliable forecast of the rainfall in a particular season.</font></p> 	    <p align="justify"><font face="verdana" size="2"><i>4.10 Correlation between rainfall for two seasons + NAO for two seasons and rainfall in the following season</i></font></p> 	    <p align="justify"><font face="verdana" size="2">It has been observed that:</font></p> 	    <p align="justify"><font face="verdana" size="2">The top left&#150;hand side map (<a href="#f6">Fig. 6</a>) shows that there is a high number of isolated zones scattered all over the Peninsula with significant correlations, which indicates that summer precipitation can be forecasted. However, the spatial discontinuity of these areas reduces the reliability of any forecast.</font></p> 	    <p align="center"><font size="2" face="verdana"><a name="f6"></a></font></p> 	    <p align="center"><font size="2" face="verdana"><img src="/img/revistas/atm/v24n3/a2f6.jpg"></font></p> 	    <p align="justify"><font face="verdana" size="2">
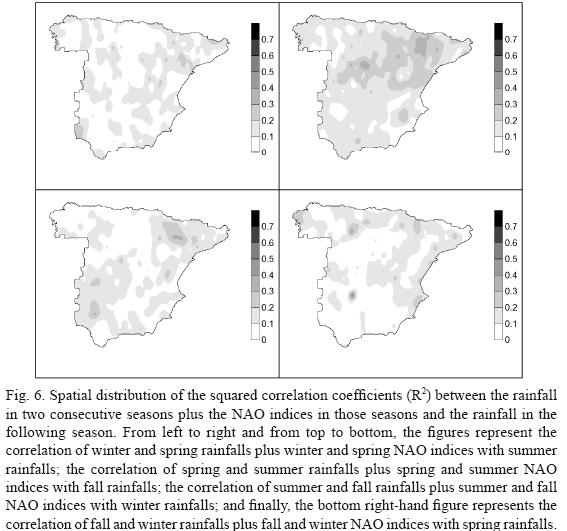
In the case of forecasts for fall rain (top right&#150;hand side map), it was found that there was a very significant correlation in the whole Peninsula. The different areas are not isolated anymore, but rather form a continuum. However, the correlation decreases in most of the Peninsula when winter rain is forecasted, the only exception being the south&#150;west, where the correlation increases somewhat. The rainfall rates in fall and winter, together with the NAO index for fall and winter, have been found to be relatively poor for forecasting spring rainfalls (bottom right&#150;hand side map). Summing up, the rainfall forecasts in a particular season based on rainfall rates and NAO indices of the two previous seasons are good, especially in the fall.
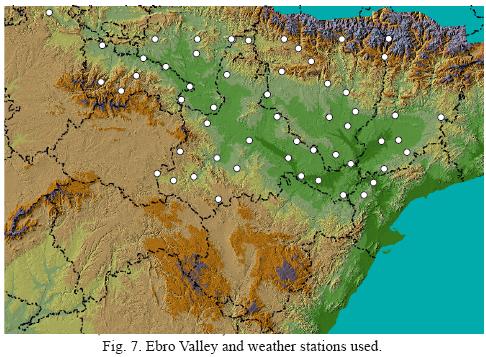
</font></p> 	    ]]></body>
<body><![CDATA[<p align="justify"><font face="verdana" size="2">Bearing in mind these results, it was decided to carry out a detailed analysis in the Ebro Valley to confirm the possibility of forecasting rain during the fall. The present study may be considered complementary to the one published by Trigo <i>et al.</i> (2004) on the influence of NAO on the precipitation regime in the main Atlantic basins of the Iberian Peninsula.</font></p> 	    <p align="justify"><font face="verdana" size="2">The Ebro Valley is the main Mediterranean basin in the Peninsula. <a href="#f7">Fig. 7</a> is a map of the valley and the 54 weather stations used in the study. <a href="#f6">Fig. 6</a> shows that in the north&#150;east the best correlation for rain forecast is registered in the fall. This was confirmed numerically while analyzing the data of the 54 stations in the Ebro Valley.</font></p> 	    <p align="center"><font size="2" face="verdana"><a name="f7"></a></font></p> 	    <p align="center"><font size="2" face="verdana"><img src="/img/revistas/atm/v24n3/a2f7.jpg"></font></p> 	    <p align="justify"><font face="verdana" size="2">
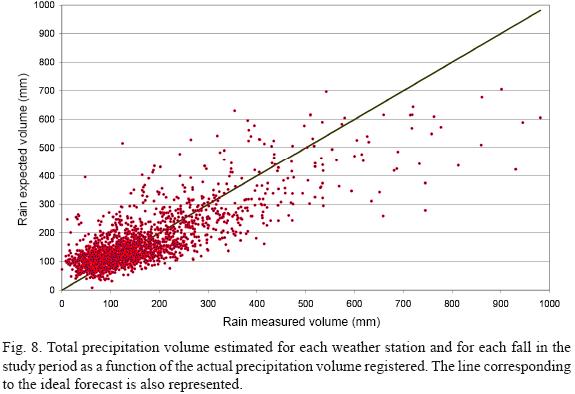
Using the linear correlation described above, the total rain volume was calculated for each station and each fall in the study period. Thus, the study included 38 falls &times; 54 stations = 2052 figures of estimated rain. <a href="#f8">Fig. 8</a> compares these data with the real measurement. The line corresponding to the ideal forecast is also represented (y = x). It can be noted that there is a certain dispersion of the expected amount of rain, but most of the dots are grouped along the line of ideal forecast. Calculating the residual variance (Essenwanger, 1986), it may be established that the percentage of variance accounted (or percentage reduction) is 42.8%. Even though this is not a very high value, it must be taken into account that:</font></p> 	 	      <p align="justify"><font face="verdana" size="2">&bull; similar and even smaller values have been found for the explained variance in correlations between NAO and the precipitation in the same month (Romero <i>et al.</i>, 1998, 1999; Mu&ntilde;oz&#150;D&iacute;az and Rodrigo, 2003);</font></p> 	      <p align="justify"><font face="verdana" size="2">&bull; the present paper does not deal with the correlation NAO&#150;precipitation in the same month, but rather aims at setting up a simple forecast model, which is clearly much more complicated. Therefore, the explained variance enables us to consider the forecast model a useful tool in the case of the Ebro Valley.</font></p> 	      <p align="center"><font face="verdana" size="2"><a name="f8"></a></font></p> 	      <p align="center"><font face="verdana" size="2"><img src="/img/revistas/atm/v24n3/a2f8.jpg"></font></p> 	      <p align="justify"><font face="verdana" size="2">&nbsp;</font></p>      	    ]]></body>
<body><![CDATA[<p align="justify"><font face="verdana" size="2"><b>5. Conclusions</b></font></p> 	    <p align="justify"><font face="verdana" size="2">The correlations found between monthly rainfalls and the NAO index of the same month show that the NAO considerably affects rainfalls in the Iberian Peninsula, especially in winter and spring. It affects annual rainfalls as well.</font></p> 	    <p align="justify"><font face="verdana" size="2">On the other hand, the correlation between the NAO indices and the rainfall of the following month is not significant in most of the Peninsula, except in some winter months. As a result, there are generally few possibilities of forecasting monthly rainfalls with linear models in Spain using the NAO index of the previous month. The same happens when using seasonal NAO indices and seasonal rainfall rates.</font></p> 	    <p align="justify"><font face="verdana" size="2">However, in the months of January, February and March it is possible to forecast the monthly rainfall using the NAO index and the rainfall rate of the previous month.</font></p> 	    <p align="justify"><font face="verdana" size="2">In addition, the NAO index may be used, together with data from recent rainfalls, to suggest reliable forecasts of seasonal precipitation, especially fall precipitation. For example, in the Ebro Valley it is possible to use the data for the NAO in spring and summer plus the precipitation registered in those two seasons in order to forecast the amount of rain that will be falling between September and November.</font></p> 	    <p align="justify"><font face="verdana" size="2">&nbsp;</font></p> 	    <p align="justify"><font face="verdana" size="2"><b>Acknowlegements</b></font></p> 	    <p align="justify"><font face="verdana" size="2">The authors are grateful to Dra. Noelia Ram&oacute;n for translating the paper into English. The study was supported by the Consejer&iacute;a de Educaci&oacute;n y Cultura, Junta de Castilla y Le&oacute;n (Grants LE014A07 and LE039A10&#150;2).</font></p> 	    <p align="justify"><font face="verdana" size="2">&nbsp;</font></p> 	    <p align="justify"><font size="2" face="verdana"><b>References</b></font></p> 	    ]]></body>
<body><![CDATA[<!-- ref --><p align="justify"><font size="2" face="verdana">Dai A., I. Y. Fung and A. D. Del Genio, 1997. Surface observed global land precipitation variations during 1900&#150;88. <i>J. Climate</i> <b>10</b>, 2943&#150;2962.    &nbsp;&nbsp;&nbsp;&nbsp;&nbsp;&nbsp;&nbsp;&nbsp;[&#160;<a href="javascript:void(0);" onclick="javascript: window.open('/scielo.php?script=sci_nlinks&ref=1287368&pid=S0187-6236201100030000200001&lng=','','width=640,height=500,resizable=yes,scrollbars=1,menubar=yes,');">Links</a>&#160;]<!-- end-ref --></font></p> 	    <!-- ref --><p align="justify"><font face="verdana" size="2">del R&iacute;o S., A. Penas and R. Fraile, 2005. Analysis of recent climatic variations in Castile and Leon (Spain). <i><i>Atmos. Res</i>.</i> 73, 69&#150;85.    &nbsp;&nbsp;&nbsp;&nbsp;&nbsp;&nbsp;&nbsp;&nbsp;[&#160;<a href="javascript:void(0);" onclick="javascript: window.open('/scielo.php?script=sci_nlinks&ref=1287370&pid=S0187-6236201100030000200002&lng=','','width=640,height=500,resizable=yes,scrollbars=1,menubar=yes,');">Links</a>&#160;]<!-- end-ref --></font></p> 	    <!-- ref --><p align="justify"><font face="verdana" size="2">Essenwanger O. M., 1986. <i>Word survey of climatology</i>, Vol. 1B: Elements of statistical analysis. Elsevier Science Publising Company, Ing., Amsterdam, 532 pp.    &nbsp;&nbsp;&nbsp;&nbsp;&nbsp;&nbsp;&nbsp;&nbsp;[&#160;<a href="javascript:void(0);" onclick="javascript: window.open('/scielo.php?script=sci_nlinks&ref=1287372&pid=S0187-6236201100030000200003&lng=','','width=640,height=500,resizable=yes,scrollbars=1,menubar=yes,');">Links</a>&#160;]<!-- end-ref --></font></p> 	    <!-- ref --><p align="justify"><font face="verdana" size="2">Garc&iacute;a N. O., L. Gimeno, L. de la Torre, R. Nieto and J. A. A&ntilde;el, 2005. North Atlantic Oscillation (NAO) and precipitation in Galicia (Spain). <i>Atm&oacute;sfera</i> <b>18</b>, 25&#150;32.    &nbsp;&nbsp;&nbsp;&nbsp;&nbsp;&nbsp;&nbsp;&nbsp;[&#160;<a href="javascript:void(0);" onclick="javascript: window.open('/scielo.php?script=sci_nlinks&ref=1287374&pid=S0187-6236201100030000200004&lng=','','width=640,height=500,resizable=yes,scrollbars=1,menubar=yes,');">Links</a>&#160;]<!-- end-ref --></font></p> 	    <!-- ref --><p align="justify"><font face="verdana" size="2">Hurrell J. W., 1995. Decadal trends in the North Atlantic Oscillation: regional temperatures and precipitation. <i>Science</i> <b>269</b>, 676&#150;679.    &nbsp;&nbsp;&nbsp;&nbsp;&nbsp;&nbsp;&nbsp;&nbsp;[&#160;<a href="javascript:void(0);" onclick="javascript: window.open('/scielo.php?script=sci_nlinks&ref=1287376&pid=S0187-6236201100030000200005&lng=','','width=640,height=500,resizable=yes,scrollbars=1,menubar=yes,');">Links</a>&#160;]<!-- end-ref --></font></p> 	    ]]></body>
<body><![CDATA[<!-- ref --><p align="justify"><font face="verdana" size="2">Hurrell J. W. and H. van Loon, 1997. Decadal variations in climate associated with the North Atlantic Oscillation. In: <i>Climate Change.</i> Proceedings International Workshop on Climatic Change at High Elevation Sites, Wengen, Switzerland, pp. 302&#150;326.    &nbsp;&nbsp;&nbsp;&nbsp;&nbsp;&nbsp;&nbsp;&nbsp;[&#160;<a href="javascript:void(0);" onclick="javascript: window.open('/scielo.php?script=sci_nlinks&ref=1287378&pid=S0187-6236201100030000200006&lng=','','width=640,height=500,resizable=yes,scrollbars=1,menubar=yes,');">Links</a>&#160;]<!-- end-ref --></font></p> 	    <!-- ref --><p align="justify"><font face="verdana" size="2">IPCC, 2001. Climate Change 2001. The Scientific Basis. Contribution of Working Group I to the Third Assessment Report of the Intergovernmental Pannel on Climate Change (J. T. Houghton, Y. Ding, D. J. Griggs, M. Noguer, P. J. van der Linden, X. Dai, K. Maskell, and C.A. Johnson, Eds.). Cambridge University Press, Cambridge, United Kingdom and New York, NY, USA.    &nbsp;&nbsp;&nbsp;&nbsp;&nbsp;&nbsp;&nbsp;&nbsp;[&#160;<a href="javascript:void(0);" onclick="javascript: window.open('/scielo.php?script=sci_nlinks&ref=1287380&pid=S0187-6236201100030000200007&lng=','','width=640,height=500,resizable=yes,scrollbars=1,menubar=yes,');">Links</a>&#160;]<!-- end-ref --></font></p> 	    <!-- ref --><p align="justify"><font face="verdana" size="2">IPCC, 2007. Climate Change 2007: The Physical Science Basis. Contribution of Working Group I to the Four Assessment Report of the Intergovernmental Pannel on Climate Change (S. Solomon, D. Quin, M. Manning, Z. Chen, M. Marquis, K. B. Averyt and H. L. Miller, Eds.). Cambridge University Press, Cambridge, United Kingdom and New York, NY, USA.    &nbsp;&nbsp;&nbsp;&nbsp;&nbsp;&nbsp;&nbsp;&nbsp;[&#160;<a href="javascript:void(0);" onclick="javascript: window.open('/scielo.php?script=sci_nlinks&ref=1287382&pid=S0187-6236201100030000200008&lng=','','width=640,height=500,resizable=yes,scrollbars=1,menubar=yes,');">Links</a>&#160;]<!-- end-ref --></font></p> 	    <!-- ref --><p align="justify"><font face="verdana" size="2">Isaaks E. H. and R. M. Srivastava, 1989. <i>An introduction to applied geostatistics</i>. Oxford University Press, NY, 592 pp.    &nbsp;&nbsp;&nbsp;&nbsp;&nbsp;&nbsp;&nbsp;&nbsp;[&#160;<a href="javascript:void(0);" onclick="javascript: window.open('/scielo.php?script=sci_nlinks&ref=1287384&pid=S0187-6236201100030000200009&lng=','','width=640,height=500,resizable=yes,scrollbars=1,menubar=yes,');">Links</a>&#160;]<!-- end-ref --></font></p> 	    <!-- ref --><p align="justify"><font face="verdana" size="2">Lindey D. V. and W. F. Scott, 1984. New Cambridge elementary statistical tables. Cambridge University Press, Cambridge, United Kingdom and New York, NY, USA, 96 pp.    &nbsp;&nbsp;&nbsp;&nbsp;&nbsp;&nbsp;&nbsp;&nbsp;[&#160;<a href="javascript:void(0);" onclick="javascript: window.open('/scielo.php?script=sci_nlinks&ref=1287386&pid=S0187-6236201100030000200010&lng=','','width=640,height=500,resizable=yes,scrollbars=1,menubar=yes,');">Links</a>&#160;]<!-- end-ref --></font></p> 	    ]]></body>
<body><![CDATA[<!-- ref --><p align="justify"><font face="verdana" size="2">Mossmann V. L. F., 2002. An&aacute;lise especial e temporal das tend&ecirc;ncies das precipita&ccedil;&otilde;es na Espanha Peninsular. Ph. D. Thesis. Universidad de Le&oacute;n, Le&oacute;n, Spain, 342 pp.    &nbsp;&nbsp;&nbsp;&nbsp;&nbsp;&nbsp;&nbsp;&nbsp;[&#160;<a href="javascript:void(0);" onclick="javascript: window.open('/scielo.php?script=sci_nlinks&ref=1287388&pid=S0187-6236201100030000200011&lng=','','width=640,height=500,resizable=yes,scrollbars=1,menubar=yes,');">Links</a>&#160;]<!-- end-ref --></font></p> 	    <!-- ref --><p align="justify"><font face="verdana" size="2">Mossmann V. L. F., A. Castro, R. Fraile, J. Dessens and J. L. S&aacute;nchez, 2004. Detection of statistically significant trends in the summer precipitation of mainland Spain. <i>Atmos. Res</i>. 70, 43&#150;53.    &nbsp;&nbsp;&nbsp;&nbsp;&nbsp;&nbsp;&nbsp;&nbsp;[&#160;<a href="javascript:void(0);" onclick="javascript: window.open('/scielo.php?script=sci_nlinks&ref=1287390&pid=S0187-6236201100030000200012&lng=','','width=640,height=500,resizable=yes,scrollbars=1,menubar=yes,');">Links</a>&#160;]<!-- end-ref --></font></p> 	    <!-- ref --><p align="justify"><font face="verdana" size="2">Mu&ntilde;oz&#150;D&iacute;az D. and F. S. Rodrigo, 2003. Effects of the North Atlantic Oscillation on the probability for climatic categories of local monthly rainfall in southern Spain. <i>Int. J. Climatol</i>. 23, 381&#150;397.    &nbsp;&nbsp;&nbsp;&nbsp;&nbsp;&nbsp;&nbsp;&nbsp;[&#160;<a href="javascript:void(0);" onclick="javascript: window.open('/scielo.php?script=sci_nlinks&ref=1287392&pid=S0187-6236201100030000200013&lng=','','width=640,height=500,resizable=yes,scrollbars=1,menubar=yes,');">Links</a>&#160;]<!-- end-ref --></font></p> 	    <!-- ref --><p align="justify"><font face="verdana" size="2">Paulus J. L. H. and M. A. Kohler, 1952. Interpolation of missing precipitation records. <i>Mon. Wea. Rev.</i> <b>80</b>, 129&#150;133.    &nbsp;&nbsp;&nbsp;&nbsp;&nbsp;&nbsp;&nbsp;&nbsp;[&#160;<a href="javascript:void(0);" onclick="javascript: window.open('/scielo.php?script=sci_nlinks&ref=1287394&pid=S0187-6236201100030000200014&lng=','','width=640,height=500,resizable=yes,scrollbars=1,menubar=yes,');">Links</a>&#160;]<!-- end-ref --></font></p> 	    <!-- ref --><p align="justify"><font face="verdana" size="2">Romero R., J. A. Guijarro, C. Ramis and S. Alonso, 1998. A 30 years (1964&#150;1993) daily rainfall data base for the Spanish Mediterranean regions: first exploratory study. Int. J. Climatol. <b>18</b>, 541&#150;560.    &nbsp;&nbsp;&nbsp;&nbsp;&nbsp;&nbsp;&nbsp;&nbsp;[&#160;<a href="javascript:void(0);" onclick="javascript: window.open('/scielo.php?script=sci_nlinks&ref=1287396&pid=S0187-6236201100030000200015&lng=','','width=640,height=500,resizable=yes,scrollbars=1,menubar=yes,');">Links</a>&#160;]<!-- end-ref --></font></p> 	    ]]></body>
<body><![CDATA[<!-- ref --><p align="justify"><font face="verdana" size="2">Romero R., G. Sumner, C. Ramis and A. Genov&eacute;s, 1999. A classification of the atmospheric circulation in patterns producing significant daily rainfall in the Spanish Mediterranean area. <i>Int. J. Climatol.</i> <b>19</b>, 765&#150;785.    &nbsp;&nbsp;&nbsp;&nbsp;&nbsp;&nbsp;&nbsp;&nbsp;[&#160;<a href="javascript:void(0);" onclick="javascript: window.open('/scielo.php?script=sci_nlinks&ref=1287398&pid=S0187-6236201100030000200016&lng=','','width=640,height=500,resizable=yes,scrollbars=1,menubar=yes,');">Links</a>&#160;]<!-- end-ref --></font></p> 	    <!-- ref --><p align="justify"><font face="verdana" size="2">Tang W. Y., A. H. M. Kassim and S. H. Abubakar, 1996. Comparative studies of various missing data treatment methods &#150; Malaysian experience. <i>Atmos. Res</i>. 42, 247&#150;262.    &nbsp;&nbsp;&nbsp;&nbsp;&nbsp;&nbsp;&nbsp;&nbsp;[&#160;<a href="javascript:void(0);" onclick="javascript: window.open('/scielo.php?script=sci_nlinks&ref=1287400&pid=S0187-6236201100030000200017&lng=','','width=640,height=500,resizable=yes,scrollbars=1,menubar=yes,');">Links</a>&#160;]<!-- end-ref --></font></p> 	    <!-- ref --><p align="justify"><font face="verdana" size="2">Thompson D. W. J. and J. M. Wallace, 1998. The Arctic Oscillation signature in the wintertime geopotential height and temperature fields. <i>Geophys. Res. Lett</i>. <b>25</b>, 1297&#150;1300.    &nbsp;&nbsp;&nbsp;&nbsp;&nbsp;&nbsp;&nbsp;&nbsp;[&#160;<a href="javascript:void(0);" onclick="javascript: window.open('/scielo.php?script=sci_nlinks&ref=1287402&pid=S0187-6236201100030000200018&lng=','','width=640,height=500,resizable=yes,scrollbars=1,menubar=yes,');">Links</a>&#160;]<!-- end-ref --></font></p> 	    <!-- ref --><p align="justify"><font face="verdana" size="2">Trigo R. M., D. Pozo&#150;V&aacute;zquez, T. J. Osborn, Y. Castro&#150;Diez, S. G&aacute;miz&#150;Fortis and M. J. Esteban&#150;Parra, 2004. North Atlantic Oscillation influence on precipitation, river flow and water resources in the Iberian Peninsula. <i>Int. J. Climatol.</i> <b>24</b>, 925&#150;944.    &nbsp;&nbsp;&nbsp;&nbsp;&nbsp;&nbsp;&nbsp;&nbsp;[&#160;<a href="javascript:void(0);" onclick="javascript: window.open('/scielo.php?script=sci_nlinks&ref=1287404&pid=S0187-6236201100030000200019&lng=','','width=640,height=500,resizable=yes,scrollbars=1,menubar=yes,');">Links</a>&#160;]<!-- end-ref --></font></p> 	    <!-- ref --><p align="justify"><font face="verdana" size="2">Walsh J. E., 1996. Recent decrease of sea level pressure in the central Arctic. <i>J. Climate</i> <b>9</b>, 480&#150;486.    &nbsp;&nbsp;&nbsp;&nbsp;&nbsp;&nbsp;&nbsp;&nbsp;[&#160;<a href="javascript:void(0);" onclick="javascript: window.open('/scielo.php?script=sci_nlinks&ref=1287406&pid=S0187-6236201100030000200020&lng=','','width=640,height=500,resizable=yes,scrollbars=1,menubar=yes,');">Links</a>&#160;]<!-- end-ref --></font></p> 	    ]]></body>
<body><![CDATA[<!-- ref --><p align="justify"><font face="verdana" size="2">Wanner H., S. Br&ouml;nnimann, C. Casty, D. Gyalistras, J. Luterbacher, C. Schmutz, D.B. Stephenson and E. Xoplaki, 2001. North Atlantic Oscillation &#150; Concepts and studies. <i>Surveys in Geophysics</i> 22, 321&#150;382.    &nbsp;&nbsp;&nbsp;&nbsp;&nbsp;&nbsp;&nbsp;&nbsp;[&#160;<a href="javascript:void(0);" onclick="javascript: window.open('/scielo.php?script=sci_nlinks&ref=1287408&pid=S0187-6236201100030000200021&lng=','','width=640,height=500,resizable=yes,scrollbars=1,menubar=yes,');">Links</a>&#160;]<!-- end-ref --></font></p> 	    <!-- ref --><p align="justify"><font face="verdana" size="2">Watanabe M. and T. Nitta, 1999. Decadal changes in the atmospheric circulation and associated surface climate variations in the Northern Hemisphere winter. <i>J. Climate</i> <b>12</b>, 494&#150;510.    &nbsp;&nbsp;&nbsp;&nbsp;&nbsp;&nbsp;&nbsp;&nbsp;[&#160;<a href="javascript:void(0);" onclick="javascript: window.open('/scielo.php?script=sci_nlinks&ref=1287410&pid=S0187-6236201100030000200022&lng=','','width=640,height=500,resizable=yes,scrollbars=1,menubar=yes,');">Links</a>&#160;]<!-- end-ref --></font></p>      ]]></body><back>
<ref-list>
<ref id="B1">
<nlm-citation citation-type="journal">
<person-group person-group-type="author">
<name>
<surname><![CDATA[Dai]]></surname>
<given-names><![CDATA[A.]]></given-names>
</name>
<name>
<surname><![CDATA[Fung]]></surname>
<given-names><![CDATA[I. Y.]]></given-names>
</name>
<name>
<surname><![CDATA[Genio]]></surname>
<given-names><![CDATA[A. D. Del]]></given-names>
</name>
</person-group>
<article-title xml:lang="en"><![CDATA[Surface observed global land precipitation variations during 1900-88]]></article-title>
<source><![CDATA[J. Climate]]></source>
<year>1997</year>
<volume>10</volume>
<page-range>2943-2962</page-range></nlm-citation>
</ref>
<ref id="B2">
<nlm-citation citation-type="journal">
<person-group person-group-type="author">
<name>
<surname><![CDATA[del Río]]></surname>
<given-names><![CDATA[S.]]></given-names>
</name>
<name>
<surname><![CDATA[Penas]]></surname>
<given-names><![CDATA[A.]]></given-names>
</name>
<name>
<surname><![CDATA[Fraile]]></surname>
<given-names><![CDATA[R.]]></given-names>
</name>
</person-group>
<article-title xml:lang="en"><![CDATA[Analysis of recent climatic variations in Castile and Leon]]></article-title>
<source><![CDATA[Atmos. Res.]]></source>
<year>2005</year>
<volume>73</volume>
<page-range>69-85</page-range></nlm-citation>
</ref>
<ref id="B3">
<nlm-citation citation-type="book">
<person-group person-group-type="author">
<name>
<surname><![CDATA[Essenwanger]]></surname>
<given-names><![CDATA[O. M.]]></given-names>
</name>
</person-group>
<source><![CDATA[Word survey of climatology]]></source>
<year>1986</year>
<volume>1B</volume>
<page-range>532</page-range><publisher-loc><![CDATA[Amsterdam ]]></publisher-loc>
<publisher-name><![CDATA[Elsevier Science Publising Company]]></publisher-name>
</nlm-citation>
</ref>
<ref id="B4">
<nlm-citation citation-type="journal">
<person-group person-group-type="author">
<name>
<surname><![CDATA[García]]></surname>
<given-names><![CDATA[N. O.]]></given-names>
</name>
<name>
<surname><![CDATA[Gimeno]]></surname>
<given-names><![CDATA[L.]]></given-names>
</name>
<name>
<surname><![CDATA[Torre]]></surname>
<given-names><![CDATA[L. de la]]></given-names>
</name>
<name>
<surname><![CDATA[Nieto]]></surname>
<given-names><![CDATA[R.]]></given-names>
</name>
<name>
<surname><![CDATA[Añel]]></surname>
<given-names><![CDATA[J. A.]]></given-names>
</name>
</person-group>
<article-title xml:lang="en"><![CDATA[North Atlantic Oscillation (NAO) and precipitation in Galicia]]></article-title>
<source><![CDATA[Atmósfera]]></source>
<year>2005</year>
<volume>18</volume>
<page-range>25-32</page-range></nlm-citation>
</ref>
<ref id="B5">
<nlm-citation citation-type="journal">
<person-group person-group-type="author">
<name>
<surname><![CDATA[Hurrell]]></surname>
<given-names><![CDATA[J. W.]]></given-names>
</name>
</person-group>
<article-title xml:lang="en"><![CDATA[Decadal trends in the North Atlantic Oscillation: regional temperatures and precipitation]]></article-title>
<source><![CDATA[Science]]></source>
<year>1995</year>
<volume>269</volume>
<page-range>676-679</page-range></nlm-citation>
</ref>
<ref id="B6">
<nlm-citation citation-type="">
<person-group person-group-type="author">
<name>
<surname><![CDATA[Hurrell]]></surname>
<given-names><![CDATA[J. W.]]></given-names>
</name>
<name>
<surname><![CDATA[van Loon]]></surname>
<given-names><![CDATA[H.]]></given-names>
</name>
</person-group>
<article-title xml:lang="en"><![CDATA[Decadal variations in climate associated with the North Atlantic Oscillation]]></article-title>
<collab>Climate Change</collab>
<source><![CDATA[]]></source>
<year>1997</year>
<page-range>302-326</page-range></nlm-citation>
</ref>
<ref id="B7">
<nlm-citation citation-type="confpro">
<person-group person-group-type="author">
<name>
<surname><![CDATA[Houghton]]></surname>
<given-names><![CDATA[J. T.]]></given-names>
</name>
<name>
<surname><![CDATA[Ding]]></surname>
<given-names><![CDATA[Y.]]></given-names>
</name>
<name>
<surname><![CDATA[Griggs]]></surname>
<given-names><![CDATA[D. J.]]></given-names>
</name>
<name>
<surname><![CDATA[Noguer]]></surname>
<given-names><![CDATA[M.]]></given-names>
</name>
<name>
<surname><![CDATA[van der Linden]]></surname>
<given-names><![CDATA[P. J.]]></given-names>
</name>
<name>
<surname><![CDATA[Dai]]></surname>
<given-names><![CDATA[X.]]></given-names>
</name>
<name>
<surname><![CDATA[Maskell]]></surname>
<given-names><![CDATA[K.]]></given-names>
</name>
<name>
<surname><![CDATA[Johnson]]></surname>
<given-names><![CDATA[C.A.]]></given-names>
</name>
</person-group>
<collab>IPCC</collab>
<source><![CDATA[Climate Change 2001. The Scientific Basis]]></source>
<year>2001</year>
<conf-name><![CDATA[Third the Intergovernmental Pannel on Climate Change]]></conf-name>
<conf-loc> </conf-loc>
<publisher-loc><![CDATA[CambridgeNew York ]]></publisher-loc>
<publisher-name><![CDATA[Cambridge University Press]]></publisher-name>
</nlm-citation>
</ref>
<ref id="B8">
<nlm-citation citation-type="confpro">
<person-group person-group-type="author">
<name>
<surname><![CDATA[Solomon]]></surname>
<given-names><![CDATA[S.]]></given-names>
</name>
<name>
<surname><![CDATA[Quin]]></surname>
<given-names><![CDATA[D.]]></given-names>
</name>
<name>
<surname><![CDATA[Manning]]></surname>
<given-names><![CDATA[M.]]></given-names>
</name>
<name>
<surname><![CDATA[Chen]]></surname>
<given-names><![CDATA[Z.]]></given-names>
</name>
<name>
<surname><![CDATA[Marquis]]></surname>
<given-names><![CDATA[M.]]></given-names>
</name>
<name>
<surname><![CDATA[Averyt]]></surname>
<given-names><![CDATA[K. B.]]></given-names>
</name>
<name>
<surname><![CDATA[Miller]]></surname>
<given-names><![CDATA[H. L.]]></given-names>
</name>
</person-group>
<collab>IPCC</collab>
<source><![CDATA[Climate Change 2007: The Physical Science Basis]]></source>
<year>2007</year>
<conf-name><![CDATA[Four the Intergovernmental Pannel on Climate Change]]></conf-name>
<conf-loc> </conf-loc>
<publisher-loc><![CDATA[CambridgeNew York ]]></publisher-loc>
<publisher-name><![CDATA[Cambridge University Press]]></publisher-name>
</nlm-citation>
</ref>
<ref id="B9">
<nlm-citation citation-type="book">
<person-group person-group-type="author">
<name>
<surname><![CDATA[Isaaks]]></surname>
<given-names><![CDATA[E. H.]]></given-names>
</name>
<name>
<surname><![CDATA[Srivastava]]></surname>
<given-names><![CDATA[R. M.]]></given-names>
</name>
</person-group>
<source><![CDATA[An introduction to applied geostatistics]]></source>
<year>1989</year>
<page-range>592</page-range><publisher-loc><![CDATA[NY ]]></publisher-loc>
<publisher-name><![CDATA[Oxford University Press]]></publisher-name>
</nlm-citation>
</ref>
<ref id="B10">
<nlm-citation citation-type="book">
<person-group person-group-type="author">
<name>
<surname><![CDATA[Lindey]]></surname>
<given-names><![CDATA[D. V.]]></given-names>
</name>
<name>
<surname><![CDATA[Scott]]></surname>
<given-names><![CDATA[W. F.]]></given-names>
</name>
</person-group>
<source><![CDATA[New Cambridge elementary statistical tables]]></source>
<year>1984</year>
<page-range>96</page-range><publisher-loc><![CDATA[CambridgeNew York ]]></publisher-loc>
<publisher-name><![CDATA[Cambridge University Press]]></publisher-name>
</nlm-citation>
</ref>
<ref id="B11">
<nlm-citation citation-type="">
<person-group person-group-type="author">
<name>
<surname><![CDATA[Mossmann]]></surname>
<given-names><![CDATA[V. L. F.]]></given-names>
</name>
</person-group>
<source><![CDATA[Análise especial e temporal das tendêncies das precipitações na Espanha Peninsular]]></source>
<year>2002</year>
<page-range>342</page-range></nlm-citation>
</ref>
<ref id="B12">
<nlm-citation citation-type="journal">
<person-group person-group-type="author">
<name>
<surname><![CDATA[Mossmann]]></surname>
<given-names><![CDATA[V. L. F.]]></given-names>
</name>
<name>
<surname><![CDATA[Castro]]></surname>
<given-names><![CDATA[A.]]></given-names>
</name>
<name>
<surname><![CDATA[Fraile]]></surname>
<given-names><![CDATA[R.]]></given-names>
</name>
<name>
<surname><![CDATA[Dessens]]></surname>
<given-names><![CDATA[J.]]></given-names>
</name>
<name>
<surname><![CDATA[Sánchez]]></surname>
<given-names><![CDATA[J. L.]]></given-names>
</name>
</person-group>
<article-title xml:lang="en"><![CDATA[Detection of statistically significant trends in the summer precipitation of mainland Spain]]></article-title>
<source><![CDATA[Atmos. Res.]]></source>
<year>2004</year>
<volume>70</volume>
<page-range>43-53</page-range></nlm-citation>
</ref>
<ref id="B13">
<nlm-citation citation-type="journal">
<person-group person-group-type="author">
<name>
<surname><![CDATA[Muñoz-Díaz]]></surname>
<given-names><![CDATA[D.]]></given-names>
</name>
<name>
<surname><![CDATA[Rodrigo]]></surname>
<given-names><![CDATA[F. S.]]></given-names>
</name>
</person-group>
<article-title xml:lang="en"><![CDATA[Effects of the North Atlantic Oscillation on the probability for climatic categories of local monthly rainfall in southern Spain]]></article-title>
<source><![CDATA[Int. J. Climatol.]]></source>
<year>2003</year>
<volume>23</volume>
<page-range>381-397</page-range></nlm-citation>
</ref>
<ref id="B14">
<nlm-citation citation-type="journal">
<person-group person-group-type="author">
<name>
<surname><![CDATA[Paulus]]></surname>
<given-names><![CDATA[J. L. H.]]></given-names>
</name>
<name>
<surname><![CDATA[Kohler]]></surname>
<given-names><![CDATA[M. A.]]></given-names>
</name>
</person-group>
<article-title xml:lang="en"><![CDATA[Interpolation of missing precipitation records]]></article-title>
<source><![CDATA[Mon. Wea. Rev.]]></source>
<year>1952</year>
<volume>80</volume>
<page-range>129-133</page-range></nlm-citation>
</ref>
<ref id="B15">
<nlm-citation citation-type="journal">
<person-group person-group-type="author">
<name>
<surname><![CDATA[Romero]]></surname>
<given-names><![CDATA[R.]]></given-names>
</name>
<name>
<surname><![CDATA[Guijarro]]></surname>
<given-names><![CDATA[J. A.]]></given-names>
</name>
<name>
<surname><![CDATA[Ramis]]></surname>
<given-names><![CDATA[C.]]></given-names>
</name>
<name>
<surname><![CDATA[Alonso]]></surname>
<given-names><![CDATA[S.]]></given-names>
</name>
</person-group>
<article-title xml:lang="en"><![CDATA[A 30 years (1964-1993) daily rainfall data base for the Spanish Mediterranean regions: first exploratory study]]></article-title>
<source><![CDATA[Int. J. Climatol.]]></source>
<year>1998</year>
<volume>18</volume>
<page-range>541-560</page-range></nlm-citation>
</ref>
<ref id="B16">
<nlm-citation citation-type="journal">
<person-group person-group-type="author">
<name>
<surname><![CDATA[Romero]]></surname>
<given-names><![CDATA[R.]]></given-names>
</name>
<name>
<surname><![CDATA[Sumner]]></surname>
<given-names><![CDATA[G.]]></given-names>
</name>
<name>
<surname><![CDATA[Ramis]]></surname>
<given-names><![CDATA[C.]]></given-names>
</name>
<name>
<surname><![CDATA[Genovés]]></surname>
<given-names><![CDATA[A.]]></given-names>
</name>
</person-group>
<article-title xml:lang="en"><![CDATA[A classification of the atmospheric circulation in patterns producing significant daily rainfall in the Spanish Mediterranean area]]></article-title>
<source><![CDATA[Int. J. Climatol.]]></source>
<year>1999</year>
<volume>19</volume>
<page-range>765-785</page-range></nlm-citation>
</ref>
<ref id="B17">
<nlm-citation citation-type="journal">
<person-group person-group-type="author">
<name>
<surname><![CDATA[Tang]]></surname>
<given-names><![CDATA[W. Y.]]></given-names>
</name>
<name>
<surname><![CDATA[Kassim]]></surname>
<given-names><![CDATA[A. H. M.]]></given-names>
</name>
<name>
<surname><![CDATA[Abubakar]]></surname>
<given-names><![CDATA[S. H.]]></given-names>
</name>
</person-group>
<article-title xml:lang="en"><![CDATA[Comparative studies of various missing data treatment methods - Malaysian experience]]></article-title>
<source><![CDATA[Atmos. Res.]]></source>
<year>1996</year>
<volume>42</volume>
<page-range>247-262</page-range></nlm-citation>
</ref>
<ref id="B18">
<nlm-citation citation-type="journal">
<person-group person-group-type="author">
<name>
<surname><![CDATA[Thompson]]></surname>
<given-names><![CDATA[D. W. J.]]></given-names>
</name>
<name>
<surname><![CDATA[Wallace]]></surname>
<given-names><![CDATA[J. M.]]></given-names>
</name>
</person-group>
<article-title xml:lang="en"><![CDATA[The Arctic Oscillation signature in the wintertime geopotential height and temperature fields]]></article-title>
<source><![CDATA[Geophys. Res. Lett.]]></source>
<year>1998</year>
<volume>25</volume>
<page-range>1297-1300</page-range></nlm-citation>
</ref>
<ref id="B19">
<nlm-citation citation-type="journal">
<person-group person-group-type="author">
<name>
<surname><![CDATA[Trigo]]></surname>
<given-names><![CDATA[R. M.]]></given-names>
</name>
<name>
<surname><![CDATA[Pozo-Vázquez]]></surname>
<given-names><![CDATA[D.]]></given-names>
</name>
<name>
<surname><![CDATA[Osborn]]></surname>
<given-names><![CDATA[T. J.]]></given-names>
</name>
<name>
<surname><![CDATA[Castro-Diez]]></surname>
<given-names><![CDATA[Y.]]></given-names>
</name>
<name>
<surname><![CDATA[Gámiz-Fortis]]></surname>
<given-names><![CDATA[S.]]></given-names>
</name>
<name>
<surname><![CDATA[Esteban-Parra]]></surname>
<given-names><![CDATA[M. J.]]></given-names>
</name>
</person-group>
<article-title xml:lang="en"><![CDATA[North Atlantic Oscillation influence on precipitation, river flow and water resources in the Iberian Peninsula]]></article-title>
<source><![CDATA[Int. J. Climatol.]]></source>
<year>2004</year>
<volume>24</volume>
<page-range>925-944</page-range></nlm-citation>
</ref>
<ref id="B20">
<nlm-citation citation-type="journal">
<person-group person-group-type="author">
<name>
<surname><![CDATA[Walsh]]></surname>
<given-names><![CDATA[J. E.]]></given-names>
</name>
</person-group>
<article-title xml:lang="en"><![CDATA[Recent decrease of sea level pressure in the central Arctic]]></article-title>
<source><![CDATA[J. Climate]]></source>
<year>1996</year>
<volume>9</volume>
<page-range>480-486</page-range></nlm-citation>
</ref>
<ref id="B21">
<nlm-citation citation-type="journal">
<person-group person-group-type="author">
<name>
<surname><![CDATA[Wanner]]></surname>
<given-names><![CDATA[H.]]></given-names>
</name>
<name>
<surname><![CDATA[Brönnimann]]></surname>
<given-names><![CDATA[S.]]></given-names>
</name>
<name>
<surname><![CDATA[Casty]]></surname>
<given-names><![CDATA[C.]]></given-names>
</name>
<name>
<surname><![CDATA[Gyalistras]]></surname>
<given-names><![CDATA[D.]]></given-names>
</name>
<name>
<surname><![CDATA[Luterbacher]]></surname>
<given-names><![CDATA[J.]]></given-names>
</name>
<name>
<surname><![CDATA[Schmutz]]></surname>
<given-names><![CDATA[C.]]></given-names>
</name>
<name>
<surname><![CDATA[Stephenson]]></surname>
<given-names><![CDATA[D.B.]]></given-names>
</name>
<name>
<surname><![CDATA[Xoplaki]]></surname>
<given-names><![CDATA[E.]]></given-names>
</name>
</person-group>
<article-title xml:lang="en"><![CDATA[North Atlantic Oscillation - Concepts and studies]]></article-title>
<source><![CDATA[Surveys in Geophysics]]></source>
<year>2001</year>
<volume>22</volume>
<page-range>321-382</page-range></nlm-citation>
</ref>
<ref id="B22">
<nlm-citation citation-type="journal">
<person-group person-group-type="author">
<name>
<surname><![CDATA[Watanabe]]></surname>
<given-names><![CDATA[M.]]></given-names>
</name>
<name>
<surname><![CDATA[Nitta]]></surname>
<given-names><![CDATA[T.]]></given-names>
</name>
</person-group>
<article-title xml:lang="en"><![CDATA[Decadal changes in the atmospheric circulation and associated surface climate variations in the Northern Hemisphere winter]]></article-title>
<source><![CDATA[J. Climate]]></source>
<year>1999</year>
<volume>12</volume>
<page-range>494-510</page-range></nlm-citation>
</ref>
</ref-list>
</back>
</article>
