J. E. OSPINA–NOREÑA, C. GAY–GARCÍA, A. C. CONDE
Centro de Ciencias de la Atmósfera, Universidad Nacional Autónoma de México,
Circuito Exterior, Ciudad Universitaria, México, D. F. 04510 México
Corresponding author: C. Gay; e–mail: cgay@servidor.unam.mx
G. SÁNCHEZ–TORRES ESQUEDA
Universidad Autónoma de Tamaulipas, Facultad de Ingeniería Arturo Narro Siller,
División de Estudios de Posgrado, Centro Universitario Tampico–Madero, México
]]> Received April 1, 2009; Accepted September 14, 2009
RESUMEN
En este trabajo se analiza la relación de oferta/demanda del recurso hídrico en la cuenca del Sinú–Caribe, Colombia, teniendo en cuenta los valores actuales y proyectados a los años 2015 y 2025 por el Instituto de Hidrología, Meteorología y de Estudios Ambientales de Colombia (IDEAM). Se incluye los posibles cambios que puede experimentar dicha relación, debidos al cambio climático estimado por algunos modelos de circulación general, bajo escenarios A2 de emisiones de gases de efecto de invernadero. Se aplica el Sistema de Evaluación y Planeación del Agua (WEAP, por sus siglas en inglés), para analizar y simular sistemas del agua y orientar políticas de manejo, con lo que se busca brindar herramientas, criterios y elementos de juicio que permitan elaborar estrategias adaptativas ante condiciones adversas.
ABSTRACT
The water resource supply–demand relationship in the Sinú–Caribe Basin, Colombia, was analyzed based on current values and values projected for 2015 and 2025 by the Instituto de Hidrología, Meteorología y de Estudios Ambientales de Colombia). The projections included estimated changes in the relationship based on general circulation climate change models under A2 greenhouse gas emission scenarios. The WEAP (Water Evaluation and Planning) System was applied to analyze and simulate different water systems and to guide management policies in order to provide tools, criteria and decision–making elements for devising adaptive strategies under adverse conditions.
Keywords: Supply, demand, water, basin, general circulation models, climate change.
1. Introduction
]]> Many human systems are sensitive to climate change; among them water resouces, agriculture, forestry, coastal and marine systems, human settlements, energy, industry, insurance and other financial and health service systems. Vulnerability of these systems to climate change will depend on geographic location, weather, and social, economic and environmental conditions both locally and regionally (IPCC, 2001a; Watson et al., 1998).Approximately one third of the world's population (1.7 billion people), currently lives in countries threatened by water tension due to water scarcity (defined as use of more than 20% of the renewable water supply). According to predictions, by 2025, 5 billion people will be affected by water tension. At the same time, flooding may increase in frequency and magnitude in other regions as a result of the growing incidence of heavy rainfall events, which could in turn increase runoff and erosion, making these events negative factors for many industries and purposes (IPCC, 200 1a).
It is estimated that 65% of the world's population impacted by natural events has been affected by hydrometeorological phenomena. According to the WMO (2004), during the period 1993–2002, hydrometeorological extremes affected 87% of the people impacted by disasters. Of deaths reported in the period, 52% were the result of drought, and 11% of floods.
Trenberth et al. (2003) and the IPCC (2001b, 2007) argue that global warming could increase the intensity and reduce the frequency of precipitation events; that the effect on water resources could be sufficient to generate conflicts among users, regions and countries; and that changes in surface runoff processes will depend on changes in temperature and precipitation, among other variables. Arnell et al. (2001) in different river basins from the world and Gay (2000) in México used climate models to simulate future climates under different emission scenarios. They found that all simulations indicated an increase in average global precipitation, but at the same time some areas would experience large decreases in surface runoff. They concluded that increased precipitation clearly does not imply increases in surface and underground water availability region–wide.
The impact on water resources does not depend only on changes in its volume, momentum, quality and recharge, but also on characteristics of systems and the pressures on them, including population processes, regional planning processes, infrastructure implementation, manufacturing activity and economic sectors, sustainable and efficient use (or not) of natural resources, changes in these factors, and adaptations to climate change. Changes other than climate may also have a greater impact than climate change on water resources; for example loss of physical and/or biotic elements regulating the water cycle; deforestation; expansion of agriculture in unsuitable, poorly planned areas; and implementation of unsuitable infrastructure. Increased pressure on the system will increase vulnerability to climate change, but planning can reduce vulnerability. Systems not subject to proper management and planning will surely be the most vulnerable to climate change (IPCC, 2001b; UNFCCC, 2005).
Planning methods for water resources, particularly those involving integrated management, can reduce vulnerability through adjustments that take into account the effects of climate change and new unknowns on water resources. Approaches focusing on supply are more widely utilized than those focusing on demand (which change exposure to water tension). Increased attention is, however, being paid to demand, but the ability to apply efficient planning solutions is not equally distributed worldwide, and is lower in many countries whose economies are in transition and in development (IPCC, 2001b).
The Integrated Water Resources Management (IWRM) method is a systematic planning and management method which incorporates a series of supply and demand processes and actions, and includes the participation of key stakeholders in decision processes. It also facilitates adaptive management through monitoring and continual review of the water resource situation (UNFCCC, 2006).
The WEAP 2.1 is a tool which enables effective IWRM, integrating a range of physical hydrological process with ongoing consistent administration of demand and existing infrastructure. It enables analysis of multiple scenarios, including alternative climate scenarios and stress–causing anthropogenic changes such as variations in land use, changes in urban and industrial demand, alternative regulations, and points of diversion with respect to changes (UNFCCC, 2005).
According to IDEAM (2001), the climate in Colombia is quite variable, both geographically and over the course of time. This climatic diversity is largely determined by geographic location and the physiographic characteristics of the country. Colombia's climatic diversity is an important resource of the country and its climate variations play an important role in its different human activities.
Water is not distributed equally across the country, but rather is subject to considerable variations. Colombia contains regions with water deficits and regions with excess of water (IDEAM, 2001).
]]> According to the IDEAM (2000), it is important to describe the criteria, estimates and analyses of the relationships between the water potentially needed to meet the needs of the population and of production in relation to available water. It is therefore vital to conduct an overall evaluation of the vulnerability of water systems supplying rural and urban areas in terms of availability for moderate and dry hydrological conditions.The contribution of the present study is an analysis of the water supply–demand relationship in the Sinú–Caribe Basin, Colombia, including by means of WEAP the most important variables and climate change scenarios.
2. Methodology
The study was conducted in three phases:
Phase 1. Information gathering
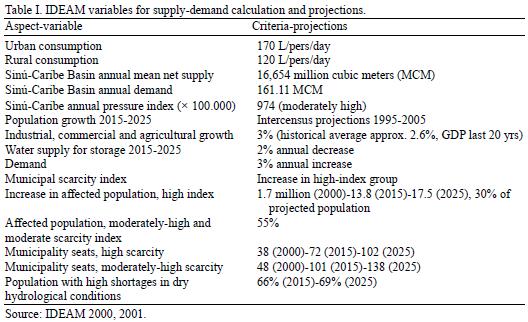
a. An exhaustive literature review was conducted, and all information on the water supply–demand relationship in IDEAM (2000, 2001) studies was analyzed. Variables extracted included daily urban and rural consumption per person, commercial and industrial consumption, natural water supply, reduction in supply due to ecological flow and water quality, projected increases in consumption and decrease in natural supply. The population in the study area was also determined, by municipal seat (urban areas) and rural areas and the respective projections as made by the Departamento Administrativo Nacional de Estadística (DANE, 2005).
b. From recent studies carried out by Ospina (2009) and Ospina et al. (2009), potential climate changes for the period 2010–2039, specifically maximum temperature (Tmax) and precipitation (PCP), were projected for various general circulation models.
Phase 2. Natural supply projections
]]> The Tmax and PCP anomalies found in the cited studies and records of the listed variables can be used to calculate expected monthly and annual precipitation and temperature for the period under analysis. With the models used, it is pssible to calculate the flow for each case using the equation.FC= 1913.97 + 0.86078 x PCP –46.165 x Tmax
where FC is the monthly flow contribution (m3/s), which give a good fit.
Phase 3. Projections, simulation of the water supply/demand relationship and comparison of models
Taking the results from the previous steps into consideration, projections and simulations of the supply/demand relationship were made using WEAP for the models considered in order to determine fundamental aspects of the relationship, such as unsatisfied demand, coverage of demand, supply requirements, delivered supply, increase in demand, and index of pressure on water resources. This was done to generate elements which aid in planning and management of water resources in the basin and enable strategies to be developed to adapt to potential climate changes.
3. Analysis and results
Figure 1 shows the study area and the approximate location of the 28 demand centers simulated using WEAP.
Table I presents the values of the variables related to water supply–demand in the Sinú–Caribe Basin and in Colombia as a whole according to IDEAM studies.
]]>
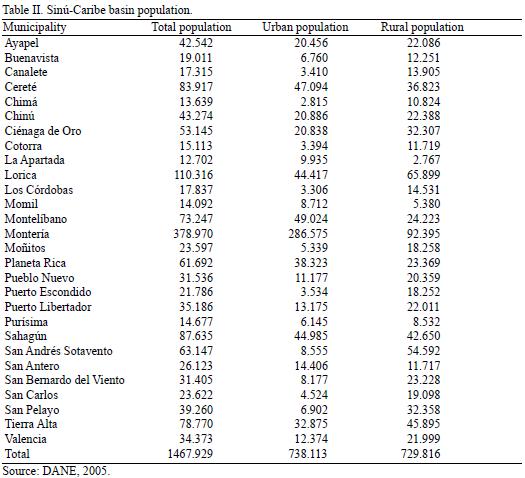
A list of the urban, rural and total population in the 28 municipalities located in the Sinú–Caribe Basin according to the DANE 2005 census is given in Table II. Municipios are administrative districts similar to counties.
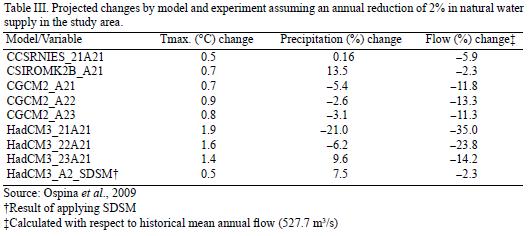
In studies by Ospina (2009) and Ospina et al. (2009), the various general circulation models showed increases in maximum temperature, increases or decreases in precipitation and decreases in flows for the Sinú–Caribe Basin. Table III summarizes the annual changes in the variables studied for the period 2010–2039 under A2 greenhouse gas emission scenarios IPCC (2001c) given that the authors concluded that greenhouse gas production according to the A2 family of scenarios would imply a more rapid increase in temperature and more marked changes in precipitation than under the B2 scenarios.
Month–to–month changes and projections for flows, PCP and Tmax according to the different climate change scenarios are given in greater detail in Appendix I (www.atmosfera.unam.mx/editorial/atmosfera/acervo/vol_22_4/06_appendixes .pdf).
3.1 Calculation of water demand
The above data and models enable the demand to be calculated for domestic, industrial (agricultural) and commercial use for the 28 sites located in the study area. It should be noted that since only data on population demand and total consumption were available, the difference was distributed as 80% industrial and 20% commercial according to the population in the municipality seats.
]]> The values for annual water demand in million cubic meters (MCM) are given in Table I by municipality, separating rural and urban, and industrial and commercial demand.3.2 Analysis of water supply–demand relationship projections and model comparison using WEAP
The data in Table IV and Appendix I were entered into the WEAP v. 21 program, along with additional information; namely, demand priorities (the initial assumption was priority 1 for all demands), percent of consumption at demand sites (approximately 35%), loss percentage in supply and recovery systems (15%), and flow restrictions (approximately 474.9 m3/s; by Colombian law, intake from the source flow may not exceed 10% of net supply from the source) (Granados and Buelvas, 2007).

Figure 2 shows total current and projected (statistical) supply requirements (SR) (which includes loss, reuse and management) by location according to population and consumption increases, and delivered supply (DS) projections forthe period 2010–2039 underthe A2 greenhouse gas scenarios used.
It can be seen clearly in the figure that current required supply (190.1 MCM) is approximately equal to current supplied demand. However, over time all scenarios predict lower than delivered required supplies. At the end of the period, in 2039, 402.3 to 619.4 MCM of water would be delivered, depending on the climate scenario, and the weighted mean supply is 563.3 MCM, while the required supply is 636.1 MCM, suggesting strong pressure on the system and a need for water resource planning and management in the Sinú–Caribe basin.
The projected demand and required supplies are called "statistical," as they assume the population and consumption growth described above, and are initially the same for all the other scenarios.
The "weighted mean" scenario (Appendix I) was constructed by weighting the flow contribution of each model (Table V) and normalizing by the sum of the weights.
]]>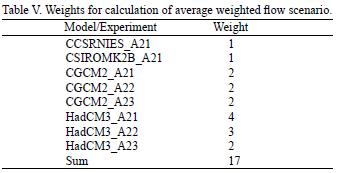
According to variations in projected Tmax and PCP, and assuming that the most adverse effects possible are avoided, the largest weights are assigned to the models that project the greatest temperature increase and precipitation decrease.
The monthly flow average for the average weighted scenario is 428.3 m3/s ± 107.8 to 95 percent reliability. Figure 3 shows the relationship between total water demand (not including loss, reuse and management, making it equivalent for all scenarios) and required and delivered supplies according to the weighted average for the period 2010–2039.
Although demand (at 540.7 MCM by 2039) is less than delivered supply (563.3 MCM), it should be noted that the requirements are not fully satisfied for each and every one of the 28 points of demand and industries, since loss, reuse and administration at the various sites are not included. For this reason, the figure given as required supply (636.1 MCM) is much higher than the actual value.
In this scenario, the decrease in average annual flow compared to current flow would be 18.8% assuming scenarios which estimate reductions up to 35%, and considering only the period 2010–2039; estimates for the period 2040 to 2069 being more drastic. This should be analyzed very carefully, considering the implications for the study area. According to the Corporación Andina de Fomento (Andino Development Corporation) (CAF, 2000), during the 1997–1998 El Niño phenomenon, flow decreases of up to 33% were reported for the Sinú River, and the consequences included large losses in agricultural production and in other industries, increased demand for water and power, and increased consumer prices for resources.
The CAF also reported that the river basin experienced a high degree of deterioration and drought and increased vulnerability to existing weather conditions due to heavy erosion processes, anthropogenic activity, resource pressure, exploitation of natural forests, and loss of vegetative coverage and water regulating elements. It is important to note that these factors generate positive synergies which complicate the analysis.
3.2.1 Unsatisfied demand and percent coverage
As may be observed in Figure 4a, total unsatisfied demand (UD) increases with increasing requirements and projected climate changes. To illustrate and provide a more detailed interpretation of the potential effects of imbalance between supply and demand, we analyze Montería, one of the main centers of demand, in the weighted mean scenario (Fig. 4b).
]]>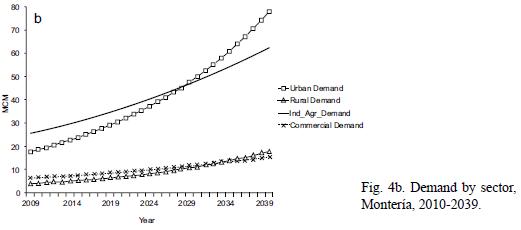
In the specific case of Montería, water demand is highest for the urban area and industry (agricultural), followed by the rural population and commercial demand; urban 17.8 MCM, industry 25.9, rural 4.0, commercial demand 6.5 at the start of the period (2009) and 78.2, 62.9, 17.8 and 15.8 MCM, respectively, at the close of the period under analysis (2039). Appendixes II and III show projected demand and required supply by sector by 5–years intervals for all municipalities (www.atmosfera.unam.mx/editorial/atmosfera/acervo/vol_22_4/06_appendixes.pdf).
Average monthly percent coverage of demand for the analyzed period and scenarios are shown in Figure 5a. Figure 5b shows the variables of the supply–demand relationship for the municipality of Montería, taking into account the weighted mean scenario.
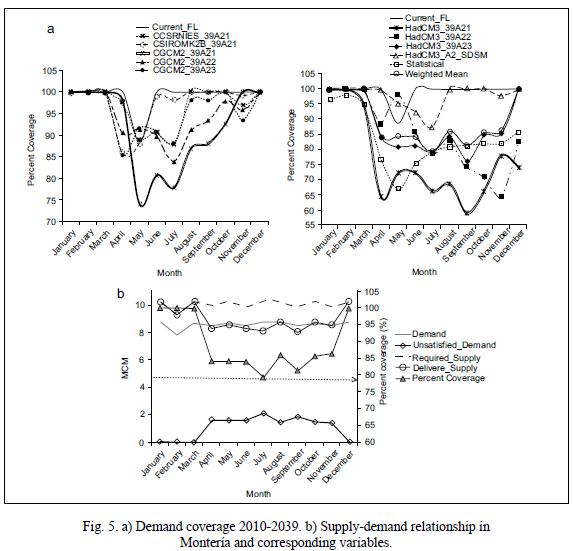
It can be observed in the figures that demand is not completely covered in any of the scenarios. Monthly average demand is 8.6 MCM, which would require a monthly supply of approximately 10.1 MCM. Delivered supply varies from month to month, with a minimum of 8.0 MCM in September, and is closely related to the contribution from projected flow. The coverage percent also varies, reaching a minimum in July at 79.3%.
3.3 Management and adaptation strategies
Continuing the example above, potential feasible changes are assumed such as efficient water use, decreasing loss in water systems, reuse or incorporation of industrial water, or installation of more efficient fixtures, among others.
For the municipality of Montería, these changes (called the adaptation 1 scenario) were consumption, 35 to 30%; losses in systems, 15 to 10%; and 5% reuse. The new scenario is descended from the weighted mean scenario, so it retains all the other variables and includes the potential climate changes projected by the weighted mean scenario for subsequent comparisons.
These changes would imply a reduction of 21.1 MCMto the required supply at the end of the period from 636.1 in the weighted mean scenario to 615 in the adaptation 1 scenario, a decrease of 18.4 in DS and of 2.7 MCM in unsatisfied demand.
]]> Figure 6a compares SR, DS and total UD in Montería. Annual required supply is shown by sector for both scenarios in Figure 6b.As shown by the figures, for 2039, total SR in Montería is 181.9 MCM in the weighted average scenario but 163.9 in the adaptation1 scenario; 18 MCM less. UD decreases by 2.5 MCM from 23.5 to 21.0 and SR by 21.1 MCM from 205.4 to 184.3, changes which are reflected in the entire basin, as indicated above.
The graph of required supply by sector shown in Figure 6b displays significant decreases when changes in handling and adaptation are included. For 2039, required supply decreases by 1.8 MCM in the commercial sector, 2.1 in rural areas, 9.5 in urban areas and 7.5 in the industrial sector.
Delivered supply and unsatisfied demand projected for 2039 for each municipality and scenario are presented in Appendixes and (www.atmosfera.unam.mx/editorial/atmosfera/acervo/vol_22_4/06_appendixes.pdf).
Figure 7 compares monthly means for the main variables of the supply–demand relationship in the municipio of Montería.
As may be observed in the figure, the adaptation 1 scenario shows lower values than the weighted mean scenario for all variables and months. Summing the monthly values gives annual reductions of 12.2 MCM of SR, 10.8 of DS and 1.4 of UD.
In this respect, it is important to emphasize that management and adaptation strategies are vital for decreasing the pressure on water resources as they reduce supply requirement, delivered supply and unsatisfied demand, as the above comparison demonstrates.
4. Conclusions
The proposed methodology and the application of WEAP enable a comprehensive analysis of water resources in the study region, which in turn enables a high degree of maneuverability in sustainable resource management and in planning and design of strategies for adaptation, mitigation of adverse effects and facilitation of positive aspects at the sector and area level as well as overall.
]]> All climate scenarios analyzed for the Sinú–Caribe basin agree on temperature increases, precipitation increases or decreases and flow reductions. This shows clearly the adverse effects of global warming on water resources at the local and regional levels, which necessitates the "regionalization" of global warming and the development of consolidating tools that enable detailed observation and analysis of its effects, whether adverse or otherwise.The inclusion of hydrological climate variables projected under potential changes is very important, as they can be incorporated into different analyses, studies and in environmental, sector, resource planning and management, ecosystem and territorial projections. As may be observed in the present study, these enable planning on a much broader frame of reference and to a certain extent, reduce uncertainty.
The mean weighted scenario could be a good alternative to use in the study area, as it is constructed using projections from all the scenarios analyzed, but assuming that the most adverse effects are avoided, a fundamental principle of environmental management.
The observations in the municipality of Montería show the need to continue to improve systems of water supply and reuse, and to develop new, more efficient supply technologies and fixtures, and create new strategies and policies for efficient water use and treatment and for their incorporation into water systems.
According to the projections derived from the different scenarios, current drought conditions and biotic and physical degradation of the basin, the scarcity index, and pressure on water resources will increase over time. This makes conservation of forests, vegetative cover and other water regulating elements even more crucial, as well as recovery and reforestation of suitable areas. Moreover, studies directed towards new agricultural planning and avoidance of the expansion of areas devoted to agriculture should also be given priority.
WEAP can also be used to obtain much more information which was outside the scope of the present study, such as power and water supply costs and income, costs and benefits of applicaton of efficient water use policies and adaptation strategies, and water quality.
The present research also included mitigation and adaptation strategies for all centers of demand, which will be delivered in subsequent reports.
References
Arnell N., R. Compagnucci L. da Cunha, K. Hanaki, C. Howe, G. Mailu, I. Shiklomanov and E. Stakhiv, 2001. Hydrology and water resources. In: Climate change 2001: Impacts, adaptation, and vulnerability. Contribution of Working Group II to the Third Assessment Report of the Intergovernmental Panel on Climate Change. (J. J. McCarthy, O. F. Canziani, N. A. Leary, D. J. Dokken, K. S. White, Eds). Cambridge University Press, UK, 92–233. [ Links ]
CAF, 2000. El fenómeno El Niño 1997–1998. Corporación Andina de Fomento. Memoria, Retos y Soluciones. Vol. III, Colombia. Caracas, Venezuela, 232 pp. [ Links ]
DANE, 2005. Censo Poblacional 2005. Departamento Administrativo Nacional de Estadísticas. Colombia. [ Links ]
Gay C. (Comp.), 2000. México: Una visión hacia el Siglo XXI. El cambio climático en México. SEMARNAP, UNAM, USCSP, México, D. F., 220 pp. [ Links ]
Granados J. and R. Buelvas, 2007. Información básica, identificación de proyectos, definición de necesidades, justificación y priorización de proyectos de agua potable y saneamiento básico del municipio de San Antero, Colombia. 16 pp. [ Links ]
IDEAM, 2000. Estudio Nacional del Agua. Instituto de Hidrología, Meteorología y Estudios Ambientales. Colombia, 39 pp. [ Links ]
IDEAM, 2001. Colombia: Primera Comunicación Nacional ante la Convención Marco de las Naciones Unidas sobre el Cambio Climático. Instituto de Hidrología, Meteorología y Estudios Ambientales. Colombia, 271 pp. [ Links ]
IPCC, 2001a. Special Report on Emission Scenarios. A Special Report of Working Group III. WMO, UNEP, USA, 27 pp. [ Links ]
IPCC, 2001b. Third assessment Report. Mitigation. Climate change. Contribution of Working Group III to the Third Assessment Report by the Intergovernmental Panel on Climate Change. WMO, UNEP, USA, 95 pp. [ Links ]
IPCC, 2001c. Third assessment Report. Impacts, Adaptation and Vulnerability. Climate Change. Contribution of Working Group II to the Third Assessment Report, Intergovernmental Panel on Climate Change. WMO, UNEP, 110 pp. [ Links ]
IPCC, 2007: Summary for Policymakers. In: Climate Change 2007: Impacts, Adaptation and vulnerability. Contribution of Working Group II to the Fourth Assessment Report of the Intergovernmental Panel on Climate Change, (M. L. Parry, O. F. Canziani, J. P. Palutikof, P. J. van der Linden and C. E. Hanson, Eds.). Cambridge University Press, Cambridge, UK, 7–22. [ Links ]
WMO, 2004. Trabajando juntos para reducir el riesgo de desastres hidrometeorológicos. Boletín de la Organización Meteorológica Mundial 53, 15–18. [ Links ]
Ospina J. E., 2009. Efectos del cambio climático en la generación hidroeléctrica con énfasis en proyecciones de generación–transmisión eléctrica en Colombia. Ph. D Thesis, Posgrado en Ciencias de la Tierra. Centro de Ciencias de la Atmósfera. Universidad Nacional Autónoma de México, 206 pp. [ Links ]
Ospina–Noreña J. E., C. Gay–García, A. C. Conde, V. O. Magaña and G. Sanchez–Torres Esqueda. 2009. Vulnerability of water resources in the face of potential climate change: generation of hydroelectric power in Colombia. Atmósfera 22, 229–252. [ Links ]
Trenberth K E., A. Dai, R. M. Rasmussen and D. B. Parsons, 2003. The changing character of precipitation. Bull. Am. Meteorol. Soc. 84, 1205–1217. [ Links ]
UNFCCC, 2005. Compendium on methods and tools to evaluate impacts of, and vulnerability and adaptation to climate change. United Nations Framework Convention on Climate Change. 155 pp. [ Links ]
UNFCCC, 2006. Application of environmentally sound technologies for adaptation to climate change. United Nations Framework Convention on Climate Change, Technical paper FCCC/ TP/2006/2 10 May, 107 pp. [ Links ]
Watson R., M. C. Zinyowera and R. H. Moss, 1998. The regional impacts of climate change: an assessment of vulnerability. Summary for policymakers. Report of IPCC Working Group II. Cambridge Press, NY, 16 pp. [ Links ] ]]>