B. MENDOZA, D. MARAVILLA
Instituto de Geofísica, Universidad Nacional Autónoma de México,
Circuito Exterior, Ciudad Universitaria, México, D. F. 04510, México
Corresponding author: B. Mendoza; e–mail: blanca@geofisica.unam.mx
E. JÁUREGUI
Centro de Ciencias de la Atmósfera, Universidad Nacional Autónoma de México
Circuito Exterior, Ciudad Universitaria, México, D. F. 04510, México
Received November 26, 2004; accepted September 20, 2005
RESUMEN
Se analizan espectralmente tres series de temperatura mínima extrema de las estaciones meteorológicas localizadas en o cerca de la costa del Pacífico mexicano: Acapulco, Comitán y Manzanillo. Las series tienen una longitud de 41 años, abarcando los años de 1941 a 1981. Del análisis se observa que existe una periodicidad cuasi–quinquenal significativa en los espectros de Comitán y Manzanillo, Acapulco también presenta una periodicidad cercana a los 5 años si se toman en cuenta las incertidumbres. Este pico espectral pudiera estar relacionado con eventos fuertes de El Niño o bien con la actividad solar. Las otras periodicidades encontradas tal vez están asociadas con fenómenos tales como la oscilación cuasi–bienal o El Niño, o bien con fenómenos solares. Aunado a esto, los resultados del análisis de coherencia espectral entre la temperatura y la Oscilación del Sur, considerada un proxy de El Niño, y del número de manchas solares, usado como proxy de actividad solar, indican que las estaciones cerca del océano son influenciadas principalmente por la Oscilación del Sur, mientras que la estación más alejada de la costa está influenciada tanto por El Niño como por la actividad solar.
ABSTRACT
Three minimum extreme temperature series from meteorological stations located in or near the Mexican Pacific coast, Acapulco, Comitán and Manzanillo, are spectrally analyzed. The series cover a period from 1941 to 1981. The spectral analysis indicates that a significant quasiquinquenial periodicity (˜5 yrs) is present in Comitán and Manzanillo, even more, Acapulco also shows a frequency ˜5yr if the uncertainties are taken into account. This spectral peak can be considered either as related to solar activity or to strong El Niño events. The remaining periodicities can be associated to meteorological phenomena like El Niño and the quasi–biennial oscillation or to some solar activity phenomena. Furthermore, the behavior deduced from a coherence spectra analysis between the temperature and the Southern Oscillation Index, considered as a proxy of El Niño, and sunspot number, considered as a proxy of solar activity, indicates that the stations closer to the ocean might be more influenced by El Niño than by solar activity, while the station inland has both influences.
Key words: Minimum extreme temperature; Mexican Pacific coast; solar activity.
]]> 1. Introduction
The Sun is the fundamental source of energy that drives the Earth's climate and sustains life; its variability certainly has a profound impact on our planet. In the last century systematic studies on the relationship between solar activity and climate have been carried out using long–term data bases of meteorological, climatological and solar parameters.
There is evidence that variations in large–scale patterns of atmospheric circulation and atmosphere–ocean interactions occur on the order of decades to centuries. Recent examples of decadal scale variations are the changing conditions in the north Pacific atmosphere and ocean (e. g. Trenberth and Hurrel, 1994); in the Atlantic Ocean, decadal–scale variations in the North Atlantic Oscillation have been detected (Hurrell, 1995); other decadal signals appear in the changes in zonal versus meridional circulation over North America (e. g. Granger, 1984). Furthermore, sunspot number and data of the sea surface temperature along 1870–1980 for the Pacific, Atlantic and Indian oceans and the global mean sea surface temperature show similar long–term variations (Reid, 2000).
Estimations of the global warming in the 20th Century indicate a mean increase of the composite air and surface temperature of 0.6 ± 0.2 °C (IPCC TAR, 2001). Generally this increase has been attributed to the anthropogenic activity; however research on this area indicates that the solar variability plays a major role in this problem (e.g. Lean et al., 1995; Crowley, 2000; Cubach and Voss, 2000; Marsh and Svensmark, 2000; Shindell et al., 2001; Solanki and Krivova, 2003; Ramírez et al., 2004). Higher up in the atmosphere, a clear influence of the 11–yr solar cycle is found in the temperature and height of the stratosphere at ˜30km and below (e.g. van Loon and Labitzke, 2000).
In México, temperature records are available from late 18th Century and of both, temperature and precipitation from early 19th Century; some research has been done concerning these data (see review by Jáuregui, 1996). Klaus (1973) observed a high correlation of mean annual temperature between Puebla and central Europe; based on this result he reconstructed temperature fluctuations in Puebla since 1760. Wallén (1955) wrote the first study on long–term precipitation trends in México, and later studies such as those of Sánchez and Kutzbach (1974), Klaus and Jáuregui (1975) and Byrne et al. (1982) have dealt with rainfall and climate variability in México. Nevertheless, no attempt has been made to study these data in the context of their possible association with solar activity.
Recently Mendoza et al. (2001) and Maravilla et al. (2004) analyzed minimum extreme temperature data of central and northern México finding some evidence of solar signals, particularly those identified in sunspot numbers, magnetic solar cycle, cosmic ray fluxes and geomagnetic activity. Also meteorological signals possibly related to El Niño and the QBO were present.
The purpose of this paper is to analyze extreme minimum temperature records from three meteorological stations located on or near the coast of México. Facing the Pacific Ocean south of parallel 19° N, the stations are Acapulco, Manzanillo and Comitán, and their location is shown in Figure 1. Using the Maximum Entropy Method of spectral analysis, as in Mendoza et al. (2001) and Maravilla et al. (2004), in this work an attempt is also made to show that the temperature series from southern México are somehow related to solar activity signals.
2. Area of study and climate
Although there are several meteorological stations along the Mexican Pacific coast, according to the needs of the present work, most of them either have relatively short time spans of data or present long interrumptions. Of all these stations only three show adequate long–term data series.
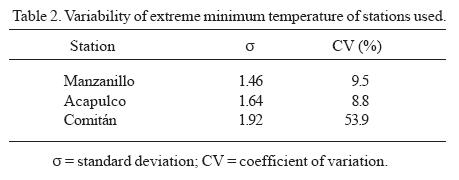
]]> The climatological stations used in this study are located in extreme southern México: two on the coast, one on the west end of the region (Manzanillo, Lat. 19°03' N, Long. 104° 17' W, 8 m above sea level) and the other further to the east (Acapulco, Lat. 16°50' N, Long. 99°56' W, 28 m above sea level); the third station, Comitán (Lat. 16°15' N, Long. 92°08' W, 1530 m above sea level), is located on an inland valley in mountainous terrain on the Sierra Madre del Sur which runs in an east–southeast direction parallel to the coast facing the Pacific Ocean (Fig. 1). The three stations lie on a latitudinal band covering from 16° N to about 19° N. The southern region of México is under the influence of the moist air from both the Pacific Ocean and the Caribbean Sea, bringing abundant precipitation ranging from 1036 mm/yr in Comitán to 1411 mm/yrs in Acapulco (Table 1). During the wet season the region is subjected to the arrival of tropical storms and hurricanes. One of these intense storms (category 5) struck the sea port of Manzanillo with powerful winds and high storm surges in 1959 (Jáuregui, 2003). During the semester centered in winter (November–April) the region is alternatively under the influence of the arrival of modified cold polar air masses from North America. The cold–front passages produce cloudiness, rain and a marked drop in temperature, especially in the Chiapas state and eastern Oaxaca. On the elevated valleys of Chiapas, temperatures may drop to freezing as is the case of Comitán located at an elevation of 1530 masl (Table 1).Variability of temperature depends on the descent of minimum temperatures. Variability is least in regions influenced by the ocean as is the case of the stations (Manzanillo and Acapulco) located on the coast (Table 2). Contrasting with these two, the third station used (Comitán) located in an elevated inland valley, distant 180 km from the coast and more exposed to the direct impact of the Nortes, shows a large minimum temperature variability as expressed by the coefficient of variation (CV) in Table 2. Furthermore, Manzanillo and Acapulco have a correlation coefficient for the time series of 0.59, while between Acapulco and Comitán and Comitán and Manzanillo this coefficient is lower than 0.50.
As noted by Hill (1969) the most obvious causes for major fluctuations of temperature in the winter climate of México are the average drop of temperature caused by a cold front passage that is about 6 °C in northern México, while the corresponding temperature fall in the south of the country is about 3 °C. Cold fronts are most frequent across eastern México but they arrive much weakened due to the mountain barrier effect on the west and south western coastal regions facing the Pacific where the temperature drop at a frontal passage is less noticeable.
3. Data and methods
Synoptically, the minimum extreme temperature is related to the deep intrusions of polar air into the tropics. Flohn (1985) has noted that long–term fluctuations of temperature and precipitation are associated with changes in the frequency of extreme weather events. Moreover, such events often occur in groups of consecutive years. As the minimum extreme temperature is an extreme event, it can throw light on extreme phenomena, such as the influence of solar activity on temperature.
Long–term series of monthly extreme minimum temperature for three different stations in the Mexican Pacific coast are analyzed in this study. The monthly minimum extreme temperature is that of the day, within a month, with the lowest recorded temperature. The time series cover a period of 41 years from January 1941 to December 1981.
The series are spectrally analyzed using the Maximum Entropy Method (MEM) (Burg, 1972). This method requires the existence of long data series. In order to compute the power spectral density (PSD) and study the periodicities, the time series were smoothed by taking 7–month running means. All series were filtered using a low–band filter (0, 1. 1yr) in order to look for solar signals.
]]> It is well known that the MEM gives better spectral resolution than other traditional methods (e .g. periodogram). What is more difficult is to quantify the actual resolution. Marple (1982) proposed the approximation: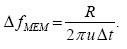
Where  is the normalized resolution and m is the process order, SNR is the signal to noise ratio and Δt is the sample time interval. This approximation depends on the SNR which is unknown in most of the "real" problems. In our case we have Δt=l month, 480 data points and we use a MEM of order of 120, then: ΔfMEM≈6.128x10⁻¹⁰ SNR–0.31. In order to obtain a better idea about the resolution we compare ΔfMEM with the traditional spectral resolution:
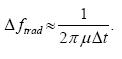
where Δt' is nΔt and n is the number of data points. In this case Δftrad≈8xl0–10 Hz and ΔfMEM≈Δftrad for a value SNR≈–2DB and the resolution is much better for higher values of SNR. Δftrad is approximately 3.5 times ΔfMEM for a SNR=–20DB. Then, we can use Δftrad=8xl0–10 Hz as our spectral resolution.
In this work an approximation of the level of confidence of the spectral density was obtained creating a noise time series (NTS) from the original data by mixing its values randomly. We obtain the MEM power spectral density of the NTS and repeat the process fifty times. The noise level is then the mean of all the NTS–PSD. The dashed horizontal lines in Figure 2 show the 68% level of confidence estimated by this procedure. This method is frequency dependent and is more representative of the confidence levels at higher frequencies, underestimating the errors at low frequencies. Nonetheless, as we shall see below, our results show that the low frequency peaks are always well above the calculated confidence levels, thus their existence is beyond doubt.
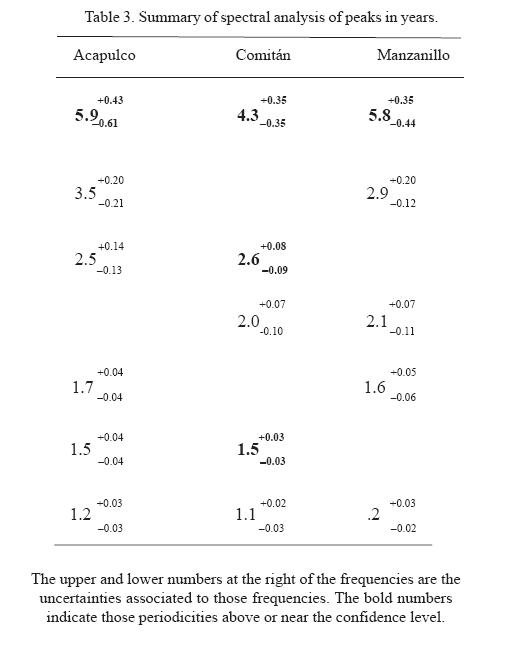
The uncertainty of the spectral peaks shown in Table 3 corresponds to the peak full width at half maximum assuming that the peaks have a Gaussian shape. Note that an advantage of the MEM is the sharpness of the spectral peaks.
Finally, in order to identify frequency bands, time intervals and phase with which two time series are covarying, we use the wavelet squared coherence (Torrence and Webster, 1999; Grinsted et al., 2004). Only coherences of 0.5 or larger appear in the corresponding figures, however, we shall discuss mainly those frequencies that are at the 95% confidence level. The arrows in the coherence spectra show the phase between the phenomena, arrows at 0° (horizontal right) indicate that both phenomena are in phase and arrows at 180° (horizontal left) indicate that they are in anti–phase; arrows at 90° and 270° (vertical up and down respectively) indicate in general an out of phase situation.
]]> We would like to point out that the wavelet coherence is specially useful in highlighting the time and frequency intervals where two phenomena have a strong interaction.
4. Results and discussion
Figure 2a shows the PSD for the Manzanillo series, in Figure 2b appears the spectral analysis for the Acapulco data and Figure 2c presents the Comitán series. The periodicities of the spectral peaks appear in the plots in units of years. In Table 3 we present a summary of the periodicities found from our calculations. The peaks are arranged by descending periodicities and we discuss only those above the confidence level, indicated in bold numbers in Table 3. Also we must keep in mind the associated uncertainties. We would like to point out that in associating the spectral peaks to one phenomenon we are only suggesting a possible connection.
Figure 2 and Table 3 indxicate that the three stations have as significant peak a quasiquinnquenial periodicity (peaks ˜ 5 yrs). Moreover, Comitán has significant peaks at 2.6 and 1.5 yrs. The Comitán peak at 2.6 yrs coincides with the Acapulco peak at 2.5 yrs taking into account the uncertainties, however the Acapulco peak is not significant. No meteorological phenomena seems to be associated to the 1.5 yrs peak of Comitán, however this periodicity is very prominent in coronal holes (Maravilla et al., 2001) cosmic ray fluxes (Valdés–Galicia et al., 1996) and sudden storm commencements (Mendoza et al., 1999). The Comitán peak at 2.6 yrs could be related to the QBO.
The quasiquinquenial peaks could be either a harmonic of the 11 yrs solar cycle or could be related to strong El Niño events (Enfield, 1992), which is particularly expected because along the Mexican Pacific coast El Niño is occurring. Peaks at longer periodicities cannot be taken into account due to the relatively short length of the series.
Figure 3a shows the coherence spectra between the temperature in Manzanillo and the Southern Oscillation Index (SOI) as a proxy of El Niño phenomenon. Figure 3b presents the coherence spectra between the temperature in Manzanillo and the sunspot number as a proxy of solar activity. The coherence with the SOI is very strong for the periods of 6 and 12 years; with the two phenomena in anti–phase and out of phase respectively. For solar activity the coherence is less clear than for the SOI and is present around three frequencies: 1, 1.8 and 5 yrs; as the direction of the arrows indicate, for these frequencies the two involved phenomena are out of phase.
Figure 4a shows the coherence spectra between the temperature in Acapulco and the SOI as a proxy of El Niño phenomenon. Figure 4b presents the coherence spectra between the temperature in Acapulco and the sunspot number as a proxy of solar activity. The coherence with the SOI is very strong for the frequency of 6 yrs, with the two phenomena in anti–phase. For solar activity the coherence is again less clear than for the SOI and is present around three frequencies: 1, 5.5 and 12 yrs, as the direction of the arrows indicate, for these frequencies the two involved phenomena are out of phase.
Figure 5a shows the coherence spectra between the temperature in Comitán and the SOI as a proxy of El Niño phenomenon. Figure 5b presents the coherence spectra between the temperature in Comitán and the sunspot number as a proxy of solar activity. The coherence with the SOI is present for the frequencies of 2, 4 and 10 yrs, with the two phenomena out of phase, in anti–phase and in phase respectively. For solar activity the coherence is clearer than for the SOI and is present around two frequencies: 1 and 8 yrs; as the direction of the arrows indicate, for these frequencies the two involved phenomena are out of phase and in anti–phase respectively.
]]> 5. Conclusions
The spectral analysis of the minimum extreme temperature in the Mexican Pacific coast shows a significant common quasiquinquenial signal in two of the three stations analyzed, Manzanillo and Comitán, although Acapulco presents a peak near the 5 yrs periodicity if the uncertainties are taking into account. This peak may be associated to various manifestations of solar activity or to strong El Niño events.
The significant frequency of ˜2.6 yrs presented in the Comitán series can be associated to the QBO.
No meteorological phenomena seems to be associated to the significant frequency ˜1.5 yrs in Comitán, however this periodicity is very prominent in coronal holes (Maravilla et al., 2001) cosmic ray fluxes (Valdés–Galicia et al., 1996) and sudden storm commencements (Mendoza et al., 1999).
Although peaks that could be associated with El Niño are evident, none of them is significant.
The coherence study between the temperature in Manzanillo and Acapulco shows a clear coincidence with the SOI at frequencies of around 6 years and with the two phenomena in antiphase. A less clear association with sunspot numbers is evident. For Comitán we have the SOI and the sunspots coinciding equally with the temperature at quasi decadal frequencies and in phase with the SOI and in anti–phase with the sunspots.
The behavior described above indicates that the stations closer to the ocean are more influenced by El Niño than by solar activity, while the station inland (Comitán) has both influences.
Acknowledgements
This work was partially supported by DGAPA–UNAM and CONACyT Grants IN 104203–3 and 33321–E, respectively. The authors are grateful to M. Casasola for collecting and digitizing the temperature data and to A. Estrada for drawing the map.
]]>References
Burg J. P., 1972. The relationship between maximum entropy spectra and maximum likehood spectra. Geophys. 37, 375–376. [ Links ]
Byrne R., O. Granger, and J. Monteverdi, 1982. Rainfall trends on the margins of the subtropical deserts. Quart. Res. 17, 14–25. [ Links ]
Crowley T. J., 2000. Causes of climate change over the past 1000 years. Science 289, 270–277. [ Links ]
Cubash, U., and R. Voss, 2000. The influence of total solar irradiance on climate. Space Sc. Rev. 94, 185–198. [ Links ]
Enfield D. B., 1992. Historical and prehistorical overview of El Niño/Southern Oscillation. In: El Niño, historical and paleoclimatic aspects of the southern oscillation, (H. F. Díaz and V. Markgraf, Eds.), Cambridge Univ. Press, pp. 95–117. [ Links ]
Flohn H., 1985. Short–term climatic fluctuation and their economic role. In: Climate and history, studies in past climates and their impact on man. (T. M. L. Wigley, M. J. Ingram, and G. Farmer Eds.), Cambridge Univ. Press, pp. 310–318. [ Links ]
García E., 1973. Los climas de México, Instituto de Geografía, UNAM, México, 74 pp. [ Links ]
Granger O. E., 1984. Twentieth–century climate anomaly patterns over the southwestern United States. Physical Geography 5, 164–185. [ Links ]
Grinsted A., J. Moore, and S. Jevrejera, 2004. Application of the cross wavelet transform and wavelet coherence to geophysical time series. Nonlinear Processes in Geophysics 11, 561–566. [ Links ]
Hill J., 1969. Temperature variability and synoptic cold fronts in the winter climate of México. Climatological Res. Series N° 4, McGill University Montreal, 70 pp. [ Links ]
Hurrell J. W., 1995. Decadal trends in the North Atlantic Oscillation: regional temperatures and precipitation. Science 269, 676–679. [ Links ]
IPCC TAR (Intergovernmental Panel on Climate Change, Third Assessment Report 2001), 2001. Climate Change 2001: The scientific basis, J. T. Houghton, Y. Ding, D. J. Giggs, M. Noguer, P. J. van der Linden, X. Dai, K. Maskell, and C. A. Johnson, Cambrige Univ. Press. [ Links ]
Jáuregui E., 1997. Climate change in México during the historical and instrumented periods. Quat. Int. 43–44, 7–17. [ Links ]
Jáuregui E., 2003. Climatology of landfalling hurricanes and tropical storms in México. Atmósfera 16, 193–204. [ Links ]
Klaus D., 1973. Inversiones de aire polar en México. Geofís. Int. 13, 99–143. [ Links ]
Klaus D., and E. Jáuregui, 1976. Some aspects of climate fluctuations in México in relation to drought. Geofís. Int. 16, 45–62. [ Links ]
Lean J., J. Beer, and R. Bradley, 1995. Reconstruction of solar irradiance since 1610: Implications for climate change. Geophys. Res. Lett. 22, 3195–3198. [ Links ]
Maravilla D., A. Lara, J. F. Valdés–Galicia and B. Mendoza, 2001. An analysis of polar coronal hole evolution: relations to other solar phenomena and heliospheric consequences. Solar Physics 203, 27–38. [ Links ]
Maravilla D., B. Mendoza, E. Jáuregui and A. Lara, 2004. The main periodicities in the minimum extreme temperature in northern Mexico and their relation with solar variability. Advances in Space Res., in press. [ Links ]
Marple S. L., 1982. Frequency resolution of Fourier and maximum entropy spectral estimates. Geophysics 47, 1303–1307. [ Links ]
Mars, N. D. and H. Svensmark, 2000. Low cloud properties influenced by cosmic rays. Physical. Review Letters 85, 5004–5007. [ Links ]
Mendoza B., A. Lara., D. Maravilla and J. F. Valdés–Galicia, 1999. Magnetic flux emergence and geomagnetic activity, a close correlation. Solar Physics 112, 405–416. [ Links ]
Mendoza B., A. Lara, D. Maravilla and E. Jáuregui, 2001. Temperature variability in central México and its possible association to solar activity. J. Atmos. Solar–Terrestrial Phys. 63, 1891–1900. [ Links ]
Ramírez J., B. Mendoza, V. Mendoza and J. Adem, 2004. Modelling the effect of an assumed cosmic ray–modulated global cloud cover on the terrestrial surface temperature. J. Atmos. Solar–Terrestrial Phys., in press. [ Links ]
Reid G. C., 2000. Solar variability and the Earth's climate: introduction and overview. Space Science Review 94, 1–11. [ Links ]
Sánchez W. and J. Kutzbach, 1974. Climate of the American Tropics in the 1960s. Quart. Res. 4, 128–135. [ Links ]
Shindell D. T., G. A. Schmidt, M. E. Mann, D. Rind and A. Waple, 2001. Solar forcing of regional climate change during the Maunder minimum. Science 294, 2149–2152. [ Links ]
Solanky S. K. and N. A. Krivova, 2003. Can solar variability explain global warming since 1970? J. Geophys. Res. 108, 1200–1207. [ Links ]
Soto C. and E. Jáuregui, 1965. Isotermas extremas e índice de aridez en la República Mexicana, Instituto de Geografía, UNAM, México. 31 p. [ Links ]
Torrence C. and P. Webster, 1999. Interdecadal Changes in the ENSO–Monsoon System. J. Clim. 12, 2679–2690. [ Links ]
Trenberth K. E. and J. W. Hurrell, 1994. Decadal atmospheric–ocean variations in the Pacific. Clim. Dyn. 9, 303–319. [ Links ]
Valdés–Galicia J. F., R. Pérez–Enríquez and J. A. Otaola, 1997. The cosmic ray 1.68–year variation: A clue to understand the nature of the solar cycle? Solar Physics 167, 409–417. [ Links ]
Van Loon H. and K. Labitzke, 2000. The influence of the 11–year solar cycle on the stratosphere below 30 km: a review. Space Sci. Rev. 94, 259–278. [ Links ]
Wallén C. C., 1955. Some characteristics of precipitation in Mexico. Geografiska Annaler 37, 51–85. [ Links ] ]]>