<?xml version="1.0" encoding="ISO-8859-1"?><article xmlns:mml="http://www.w3.org/1998/Math/MathML" xmlns:xlink="http://www.w3.org/1999/xlink" xmlns:xsi="http://www.w3.org/2001/XMLSchema-instance">
<front>
<journal-meta>
<journal-id>1870-6622</journal-id>
<journal-title><![CDATA[EconoQuantum]]></journal-title>
<abbrev-journal-title><![CDATA[EconoQuantum]]></abbrev-journal-title>
<issn>1870-6622</issn>
<publisher>
<publisher-name><![CDATA[Universidad de Guadalajara]]></publisher-name>
</publisher>
</journal-meta>
<article-meta>
<article-id>S1870-66222009000200002</article-id>
<title-group>
<article-title xml:lang="en"><![CDATA[Contribution of the Information and Communication Technology sector to Mexican economic growth from 1999 to 2004]]></article-title>
</title-group>
<contrib-group>
<contrib contrib-type="author">
<name>
<surname><![CDATA[Guerrero de Lizardi]]></surname>
<given-names><![CDATA[Carlos]]></given-names>
</name>
<xref ref-type="aff" rid="A01"/>
</contrib>
</contrib-group>
<aff id="A01">
<institution><![CDATA[,Tecnológico de Monterrey Campus Ciudad de México ]]></institution>
<addr-line><![CDATA[ ]]></addr-line>
</aff>
<pub-date pub-type="pub">
<day>00</day>
<month>00</month>
<year>2009</year>
</pub-date>
<pub-date pub-type="epub">
<day>00</day>
<month>00</month>
<year>2009</year>
</pub-date>
<volume>6</volume>
<numero>1</numero>
<fpage>11</fpage>
<lpage>30</lpage>
<copyright-statement/>
<copyright-year/>
<self-uri xlink:href="http://www.scielo.org.mx/scielo.php?script=sci_arttext&amp;pid=S1870-66222009000200002&amp;lng=en&amp;nrm=iso"></self-uri><self-uri xlink:href="http://www.scielo.org.mx/scielo.php?script=sci_abstract&amp;pid=S1870-66222009000200002&amp;lng=en&amp;nrm=iso"></self-uri><self-uri xlink:href="http://www.scielo.org.mx/scielo.php?script=sci_pdf&amp;pid=S1870-66222009000200002&amp;lng=en&amp;nrm=iso"></self-uri><abstract abstract-type="short" xml:lang="en"><p><![CDATA[We conducted a growth accounting exercise where we distinguish information and communication technology (ICT) capital and the rest of physical capital from 1999 to 2004. Implicit deflators and factor shares were used from different sources. Following the example of the Australian Bureau of Statistics, price indexes from the US ICT's sector were suitably translated to the Mexican ICT sector. Although ICT capital grew in an accelerating manner during the analyzed period, its contribution to economic growth was limited. In this sense, the new economy has not yet taken hold in Mexico.]]></p></abstract>
<abstract abstract-type="short" xml:lang="es"><p><![CDATA[Se realizó un ejercicio de contabilidad del crecimiento económico entre 1999 y 2004 distinguiendo entre el capital TIC (de Tecnologías de la Información y Comunicación) y el resto del capital físico. Se tuvo especial cuidado al momento de utilizar los deflactores implícitos del Sistema de Cuentas Nacionales y las participaciones de los factores productivos en el ingreso. Siguiendo el ejemplo de la Oficina de Estadística de Australia, entre otros, se trasladaron índices de precios del sector TIC de la economía estadounidense a la mexicana. Si bien el capital TIC creció aceleradamente en el periodo estudiado, su contribución al crecimiento económico fue francamente reducida. En este sentido, la nueva economía no se ha instalado suficientemente en nuestro país.]]></p></abstract>
<kwd-group>
<kwd lng="en"><![CDATA[ICT sector]]></kwd>
<kwd lng="en"><![CDATA[economic growth]]></kwd>
<kwd lng="en"><![CDATA[hedonic methodology]]></kwd>
</kwd-group>
</article-meta>
</front><body><![CDATA[ <p align="justify"><font face="verdana" size="4">Art&iacute;culo</font></p>     <p align="center"><font face="verdana" size="2">&nbsp;</font></p>     <p align="center"><font face="verdana" size="4"><b>Contribution of the Information and Communication Technology sector to Mexican economic growth from 1999 to 2004</b></font></p>     <p align="center"><font face="verdana" size="2">&nbsp;</font></p>     <p align="center"><font face="verdana" size="2"><b>Carlos Guerrero de Lizardi<sup>1 <a href="#notas">*</a> </sup></b></font></p>     <p align="justify"><font face="verdana" size="2">&nbsp;</font></p>     <p align="justify"><font face="verdana" size="2"><i><sup>1</sup> Tecnol&oacute;gico de Monterrey, Campus Ciudad de M&eacute;xico.</i></font></p>     <p align="justify"><font face="verdana" size="2">&nbsp;</font></p>     <p align="justify"><font face="verdana" size="2"><b>Abstract</b></font></p>     <p align="justify"><font face="verdana" size="2">We conducted a growth accounting exercise where we distinguish information and communication technology (ICT) capital and the rest of physical capital from 1999 to 2004. Implicit deflators and factor shares were used from different sources. Following the example of the Australian Bureau of Statistics, price indexes from the US ICT's sector were suitably translated to the Mexican ICT sector. Although ICT capital grew in an accelerating manner during the analyzed period, its contribution to economic growth was limited. In this sense, the new economy has not yet taken hold in Mexico.</font></p>     ]]></body>
<body><![CDATA[<p align="justify"><font face="verdana" size="2"><b>Keywords: </b>ICT sector, economic growth, hedonic methodology.</font></p>     <p align="justify"><font face="verdana" size="2"><b>JEL Classification:</b> C43, E31, O47.</font></p>     <p align="justify"><font face="verdana" size="2">&nbsp;</font></p>     <p align="justify"><font face="verdana" size="2"><b>Resumen</b></font></p>     <p align="justify"><font face="verdana" size="2">Se realiz&oacute; un ejercicio de contabilidad del crecimiento econ&oacute;mico entre 1999 y 2004 distinguiendo entre el capital TIC (de Tecnolog&iacute;as de la Informaci&oacute;n y Comunicaci&oacute;n) y el resto del capital f&iacute;sico. Se tuvo especial cuidado al momento de utilizar los deflactores impl&iacute;citos del Sistema de Cuentas Nacionales y las participaciones de los factores productivos en el ingreso. Siguiendo el ejemplo de la Oficina de Estad&iacute;stica de Australia, entre otros, se trasladaron &iacute;ndices de precios del sector TIC de la econom&iacute;a estadounidense a la mexicana. Si bien el capital TIC creci&oacute; aceleradamente en el periodo estudiado, su contribuci&oacute;n al crecimiento econ&oacute;mico fue francamente reducida. En este sentido, la nueva econom&iacute;a no se ha instalado suficientemente en nuestro pa&iacute;s.</font></p>     <p align="justify"><font face="verdana" size="2">&nbsp;</font></p>     <p align="justify"><font face="verdana" size="2">Fecha de recepci&oacute;n: 09/03/2009    <br>   Aceptaci&oacute;n: 30/10/2009</font></p>     <p align="justify"><font face="verdana" size="2">&nbsp; </font></p>     <p align="right"><font face="verdana" size="2">"&hellip; you can see the computer age everywhere    ]]></body>
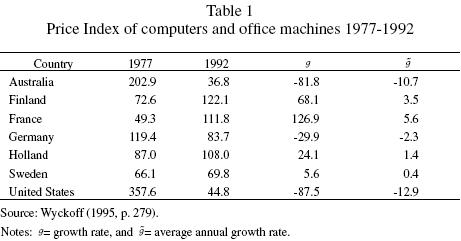
<body><![CDATA[<br>   but in the productivity statistics."    <br> Robert M. Solow (1987, p. 36).</font></p>     <p align="justify"><font face="verdana" size="2">&nbsp;</font></p>     <p align="justify"><font face="verdana" size="2"><b><i>Introduction</i></b></font></p>     <p align="justify"><font face="verdana" size="2">The brief words cited above, written by the 1987 winner of the Nobel prize in economics, originated the so called "Solow's Paradox": while the investment in products considered as Information and Communication Technology (ICT) goods registered by the Bureau of Economic Analysis was showing an accelerated growth during the 1970s and 1980s, the individual and multifactor productivities, and consequently the American economy, continued to be stagnant.</font></p>     <p align="justify"><font face="verdana" size="2">On the theoretical ground, the answer to this challenge, also known as the "paradox of productivity," underscored the fact that accounting systems were constructed for economies which were essentially manufacturing ones, for which the impacts of ICT were not sensibly <i>valued. </i>On the practical ground, the response to the "Solow's Paradox" overwhelmed any historical reference. Throughout the 1990s and into the beginning of the 2000s, the US economy registered the longest expansion since 1854, the year in which the National Bureau of Economic Research began to date business cycles. It is helpful to remember the 1990s as the decade when what is now known as the "new economy" and the "information society" emerged.<sup><a href="#notas">2</a></sup></font></p>     <p align="justify"><font face="verdana" size="2">The purpose of this paper is to assess if the explanation of the successful economic performances in the recent years of the US and some European and Asian countries may be applied to Mexico. In order to undertake this task, we lay out five sections. In the first section, we review a seminal study with the intention of showing the difficulties of measuring the ICT sector. In section two, by analyzing the most studied ICT goods (personal computers), we exemplify the difficulties of valuing at nominal and real prices. Without losing sight of the warnings of Wyckoff (1995), in the third section we estimate the size of the Mexican ICT sector. We use data from the Economic Census and the National Accounts System. In section four, we apply the standard methodology of Oliner and Sichel (1994) to determine the contribution of the ICT sector to the growth of the Mexican economy between 1999 and 2004. The last section presents some final comments.</font></p>     <p align="justify"><font face="verdana" size="2">&nbsp;</font></p>     <p align="justify"><font face="verdana" size="2"><b><i>A statistical note about measuring the ICT sector</i></b></font></p>     <p align="justify"><font face="verdana" size="2">In 1995, Wyckoff called attention regarding the international comparability of the ICT sector's real value added and labor productivity. In the following table we reproduce some of the information.</font></p>     ]]></body>
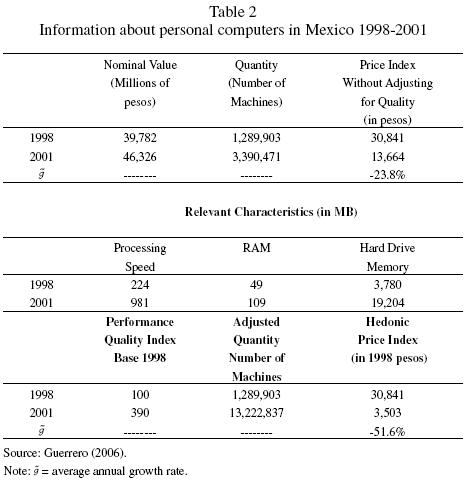
<body><![CDATA[<p align="center"><font face="verdana" size="2"><img src="/img/revistas/ecoqu/v6n1/a2t1.jpg"></font></p>     <p align="justify"><font face="verdana" size="2">&nbsp;</font></p>     <p align="justify"><font face="verdana" size="2">The well&#150;informed reader should not be surprised by the overwhelming decline of the price of information equipment. Moore (1965, 1997) noted that every 18 to 24 months a new chip was developed and that it contained the double of transistors. This would indicate a growth in quality of approximately 40 percent every year. Grimm (1998), on the other hand, argues that between 1975 and 1996 and between 1985 and 1996, the price indexes of memory chips and microprocessors diminished at an average annual rate of 28.5 percent and 35 percent respectively.</font></p>     <p align="justify"><font face="verdana" size="2">The explanation of Wyckoff (1995) about the content of the previous table was forceful. It was not possible that market's specificities of the listed countries could explain the tremendous differences between the growth rates of these price indexes. Making a revision of the statistical methods used, Wyckoff proved that the cause laid on the fact that while Australia and the United States were applying a <i>hedonic </i>quality adjustment, the rest of the countries were employing a technique known as matching, which fails to completely adjust for quality improvements. The conclusions of Wyckoff (1995) were twofold. First, the use of price indexes that do not adjust completely for quality generates an <i>underestimation </i>of the real value added of the ICT sector, which, in turn, gives rise to an <i>underestimation </i>of the labor productivity. Second, although the <i>National Accounts System 1993 </i>(ONU, 1993) recommends the use of the hedonic methodology for sectors which have experienced improvements in quality, a large number of countries have failed to adopt these standards, resulting in great difficulties to accurately compare economic performances across countries.<sup><a href="#notas">3</a></sup> One provisional solution would be the adoption of the ICT price deflator from the United States, an action which has been conveniently implemented by the Australian Bureau of Statistics (ABS).<sup><a href="#notas">4</a></sup></font></p>     <p align="justify"><font face="verdana" size="2">Unfortunately, Wyckoff (1995) only presented a theoretical call of attention. Nevertheless the growing gaps in the later part of the 1990s and the beginning of the twenty&#150;first century in economic growth, labor productivity and inflation between, on one hand, the United States, and, on the other, Japan and the European Union countries, raised some concern to statisticians on both sides of the gaps. Recently, and with a distinct intensity, certain governments have put significant effort to improve the measurement of both the ICT sector and, in general, the numerous variables linked to the new economy. Nations such as Australia, Canada, Denmark, Finland, France, Germany, Japan, Spain, Sweden and the UK have already begun working on this effort. It is noteworthy that the majority of the listed countries only "import" price indexes compiled by the BEA (ABS, 2001; Ahmad, Schreyer and W&ouml;lf, 2004; Colecchia y Schreyer, 2001).</font></p>     <p align="justify"><font face="verdana" size="2">In the case of Mexico, neither the new consumer price index (second half of June 2002=100) which is currently used by Central Bank of Mexico's to calculate inflation, nor the National Accounts System (base 2003), launched by the National Institute of Statistics and Geography (INEGI) in 2008, incorporate the hedonic methodology in their daily work.<sup><a href="#notas">5</a></sup> If we consider that 21 percent of the US GDP's components is deflated utilizing hedonic price indexes (Wasshausen and Moulton, 2006), then it seems that Mexico and many other countries should introduce better practices in their statistical methods.</font></p>     <p align="justify"><font face="verdana" size="2">&nbsp;</font></p>     <p align="justify"><font face="verdana" size="2"><b><i>An example: personal computer price index</i></b></font></p>     <p align="justify"><font face="verdana" size="2">Economic variables are usually reported in nominal or in real terms. According to standard statistical practice, in order to translate from nominal to real magnitudes (or vice versa), one should use a price index. For example, to calculate the real value added of the ICT sector we would proceed in the following manner.</font></p>     <p align="center"><font face="verdana" size="2"><img src="/img/revistas/ecoqu/v6n1/a2s1.jpg"></font></p>     ]]></body>
<body><![CDATA[<p align="justify"><font face="verdana" size="2">The real value added of the ICT sector is obtained by dividing the aggregated nominal value by the price index linked to a base year. Clearly, the real quantity depends on the nominal value obtained through a sample or a census, and on the price index.</font></p>     <p align="justify"><font face="verdana" size="2">In our case, we are working with two types of price indexes: "common price indexes" which do not adjust completely for quality improvements, and others, called "hedonic price indexes," which do adjust fully for quality. Common price indexes analyze the product in question as a unit; consequently, these indexes do not capture the specific characteristics and changes in quality. Hedonic price indexes, on the other hand, capture the improvements in quality because they are based on a meticulous revision of product characteristics. Guerrero (2006) analyzed the most relevant case of the problem we are dealing with, i.e., the problem of quantifying the quality changes of personal computers. <a href="#t2">Table 2</a> contains information relevant to this problem.</font></p>     <p align="center"><font face="verdana" size="2"><a name="t2"></a></font></p>     <p align="center"><font face="verdana" size="2">&nbsp;</font></p>     <p align="center"><font face="verdana" size="2"><img src="/img/revistas/ecoqu/v6n1/a2t2.jpg"></font></p>     <p align="justify"><font face="verdana" size="2">The non&#150;adjusted price index was obtained by dividing the nominal value by the number of machines. The resulting price index, which indicates that prices fell, on average, by 23.8 percent annually, does not account for the significant improvements in quality from 1998 to 2001.</font></p>     <p align="justify"><font face="verdana" size="2">It is necessary to clarify that the performance quality index is a <i>non&#150;weighted </i>index based on the three relevant technological characteristics presented in the table. Multiplying the performance quality index by the number of machines, we obtain the adjusted quantity of machines. Here the results are astounding: in terms of capabilities, one PC from 2001 is equal to almost four PCs from 1998. Moreover, if we divide the nominal value of PCs by our quality&#150;adjusted number of PCs, we obtain the hedonic price index seen in the lower right corner of the table. According to our calculations, using the hedonic price index, the price of PCs did not fall annually on average by 23.8 percent, but instead fell by 51.6 percent.</font></p>     <p align="justify"><font face="verdana" size="2">&nbsp;</font></p>     <p align="justify"><font face="verdana" size="2"><b><i>The size of the Mexican ICT sector</i></b></font></p>     <p align="justify"><font face="verdana" size="2">The North American Industrial Classification System (NAICS), which was incorporated in the Economic Census of 2004 and in the new 2003 base of the National Accounts System, permits us to quantify the relative importance of the ICT sector in the Mexican economy. The following table shows Mexico's ICT sector according to the NAICS (INEGI, 2004A).<sup><a href="#notas">6</a></sup></font></p>     ]]></body>
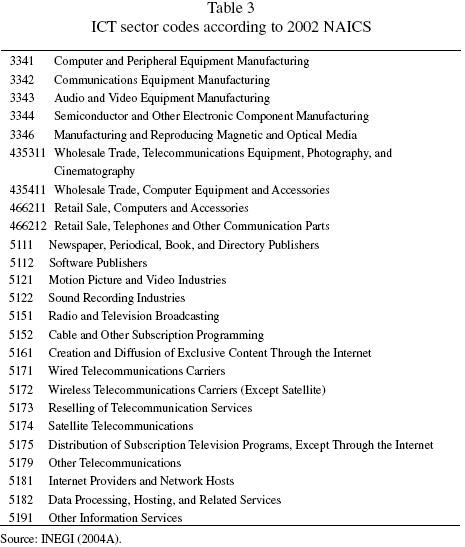
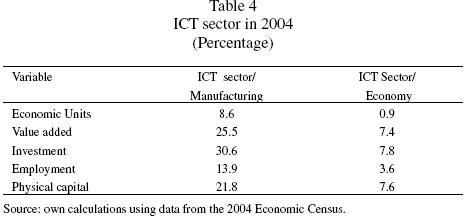
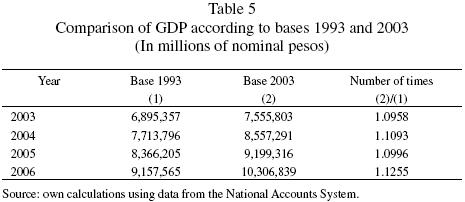
<body><![CDATA[<p align="center"><font face="verdana" size="2"><img src="/img/revistas/ecoqu/v6n1/a2t3.jpg"></font></p>     <p align="justify"><font face="verdana" size="2">&nbsp;</font></p>     <p align="justify"><font face="verdana" size="2">In brief, the ICT sector includes five manufacturing groups, four wholesale and retail trade groups, and sixteen service groups. In 2004, the value added of the ICT sector was distributed in the following manner: manufacturing (19.1 percent), wholesale and retail trades (10.4 percent), and services (70.4 percent). <a href="#t4">Table 4</a> contains some ratios that allow us to have some perspective about the relevance of the ICT sector compared to both manufacturing and the economy as a whole.</font></p>     <p align="center"><font face="verdana" size="2"><a name="t4"></a></font></p>     <p align="center"><font face="verdana" size="2">&nbsp;</font></p>     <p align="center"><font face="verdana" size="2"><img src="/img/revistas/ecoqu/v6n1/a2t4.jpg"></font></p>     <p align="justify"><font face="verdana" size="2">&nbsp;</font></p>     <p align="justify"><font face="verdana" size="2">In 2004, the ICT sector in Mexico, with 28,143 economic units, represented 8.6 percent of the number of manufacturing units and almost 1 percent of all economic units. In total, these units generated 3.6 percent of the 16,239,536 formal jobs in the economy. The ICT sector contributed with a little more than 7 percent within the economy in each of three key variables: value added, investment, and physical capital. Unfortunately, compared to the other member countries of the OECD, Mexico ranks last in terms of ICT production relative to the total value added, with a gap of around 10 percentage points compared to leading countries, such as Ireland, Finland and Korea (OECD, 2004).</font></p>     <p align="justify"><font face="verdana" size="2">Before revising some of the ICT sector statistics coming from the National Accounts System, we will make some comments. Unlike the 1993 base, the new 2003 structure is based on an input&#150;output framework that utilizes a central classification of products (869 in total). This improves the international comparability of our statistics and registers a higher number of economic activities (from 362 to 750). As a result, the nominal value added accounted for is now notably different from the previous structure. <a href="#t5">Table 5</a> contains the information.</font></p>     <p align="center"><font face="verdana" size="2"><a name="t5"></a></font></p>     ]]></body>
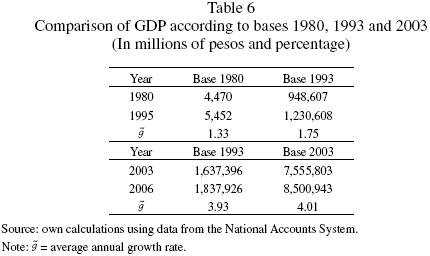
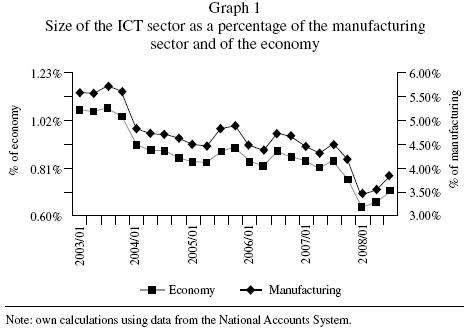
<body><![CDATA[<p align="center"><font face="verdana" size="2">&nbsp;</font></p>     <p align="center"><font face="verdana" size="2"><img src="/img/revistas/ecoqu/v6n1/a2t5.jpg"></font></p>     <p align="justify"><font face="verdana" size="2">&nbsp;</font></p>     <p align="justify"><font face="verdana" size="2">The inclusion of economic activities whose value added were not accounted for in the previous system allows us to see that, in 2006, the Mexican economy was almost 13 percent bigger than what the 1993 base indicated! In the same year, according to INEGI (2008), the Mexican GDP went from US $840.0 billion to US $943.8 billion, overtaking India (US $873.7 billion) and Korea (US $888.3 billion). This result is not surprising at all. For example, by using the 1993 base for the 1980 structure, the size of the economy in 1995 was 17 percent bigger compared to its size as measured by the 1980 base.</font></p>     <p align="justify"><font face="verdana" size="2">However, when we compare real GDP estimated using the three base years used since 1980 (i.e., 1980, 1993 and 2003), we obtain a somewhat <i>unexpected </i>result. The following table contains the information.</font></p>     <p align="center"><font face="verdana" size="2"><img src="/img/revistas/ecoqu/v6n1/a2t6.jpg"></font></p>     <p align="justify"><font face="verdana" size="2">According to the 1980 base, between 1980 and 1995, the economy grew at an average annual rate of 1.3 percent. However, according to the 1993 base, this figure was 1.75 percent, which represents a substantial difference between both estimates (0.42 percent). But, when using the 1993 and 2003 structures to estimate the annual average growth rate of GDP between 2003 and 2006, the difference is just 0.08 percent. We argue that this problem is caused by the incomplete quality adjustment taken by INEGI in the valuation of the macroeconomic variables at constant prices, and is worsened especially in the case of ICT goods and services.</font></p>     <p align="justify"><font face="verdana" size="2">The following graph presents the behavior of the relative size of the ICT sector relative to the manufacturing and the overall economy. The ratios were obtained using nominal pesos.</font></p>     <p align="justify"><font face="verdana" size="2">According to the <i>2004 Economic Census, </i>in 2004, the share of the aforementioned sector in the economy and in manufacturing was to 1.4 percent and 4.9 percent, respectively. In the case of the National Accounts System, these shares were 1.1 percent and 5.6 percent, respectively. These estimates are somewhat similar. <a href="#g1">Graph 1</a> shows that in relative nominal terms, the ICT sector has been declining since the third quarter of 2004. In the first three quarters of 2008, its share was reduced to 0.7 percent of the economy and 3.6 percent of manufacturing. The negative impact of this trend can be readily seen if we consider that the international evidence suggests that the production of ICT goods and services has positive externalities in the economy as a whole (Pilat and Devlin, 2004).</font></p>     <p align="center"><font face="verdana" size="2"><a name="g1"></a></font></p>     ]]></body>
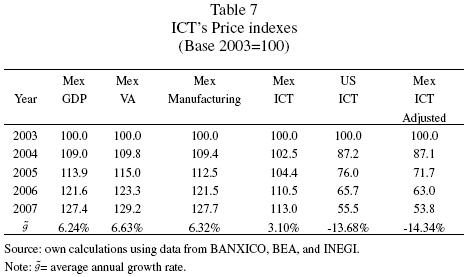
<body><![CDATA[<p align="center"><font face="verdana" size="2">&nbsp;</font></p>     <p align="center"><font face="verdana" size="2"><img src="/img/revistas/ecoqu/v6n1/a2g1.jpg"></font></p>     <p align="center"><font face="verdana" size="2">&nbsp;</font></p>     <p align="justify"><font face="verdana" size="2">To express the variables in real terms, INEGI (p. 33) applies two mechanisms "that might be used indistinctly, according to the available information. The first method values the annual quantities of each good or service produced, consumed, or exported using prices registered in the referenced year. The second method deflates the nominal values with price indexes." INEGI generally uses the first method, which is the reason why they are called implicit deflators.</font></p>     <p align="justify"><font face="verdana" size="2">The key problem lies in the difficulty of quantifying the value of products in the ICT sector. The traditional definition of value results from multiplying price by quantity, with a requisite of a <i>homogenous </i>product. Given the ever&#150;changing quality of products in the ICT sector, we face two significant problems. The first, and most evident, is related to the quality changes a product can have over time. The second has to do with the definition of the similarity of a product or service. In other words, comparing a basic good, such as an apple, is an almost trivial exercise since its characteristics do not change over time; however, thinking about technology products, such as computers, which frequently accrue higher capabilities, or defining the quality of an ICT service, is a statistical challenge which nonetheless must be undertaken by INEGI in order to correctly measure the value added of the ICT sector.<sup><a href="#notas">7</a></sup></font></p>     <p align="justify"><font face="verdana" size="2">Following the seminal work of Wyckoff (1995), we present some implicit deflators of the Mexican and American economies.</font></p>     <p align="center"><font face="verdana" size="2"><img src="/img/revistas/ecoqu/v6n1/a2t7.jpg"></font></p>     <p align="justify"><font face="verdana" size="2">We can observe that the changes in the price indexes of GDP, value added and manufacturing were almost identical between 2003 and 2007. But they were quite different from the ICT sector. If we review the US and the Mexican indexes adjusted from the US ICT sector prices, we obtain evidence similar to that reported by Wyckoff (1995). It is necessary to clarify that, to obtain the adjusted ICT index, we employed the third procedure suggested by Schreyer (2001).<sup><a href="#notas">8</a></sup></font></p>     <p align="justify"><font face="verdana" size="2">We thus have two deflators available to calculate the real value added of the ICT sector: the official and the adjusted (calculated following the ABS method). Applying these two deflators, we obtain two real average growth rates between 2003 and 2007 which are completely different: 0.5 percent in the first case and 21 percent in the second! If our hypothesis about the incomplete adjustment for quality in the valuation of the macroeconomic magnitudes is correct, then our results suggest two things. First, a completely different performance of the ICT sector during the last few years. Second, that it is not a good practice to measure the ICT sector's participation in the economy in constant prices (INEGI, 1999 and 2004). The measurement of the size of the total effect of the ICT sector on the economy as a whole is beyond the objectives of the present study. In this sense, Guerrero (2008, p. 265) notes that "the complete accounting of improvements in quality of ICT products generates two distinct economic growth estimates. The first one, according to the adjusted Laspeyres index minus the original Laspeyres, shows an underestimation of economic growth of about 0.57 percent. The second one, according to the adjusted Fisher minus the original Laspeyres, shows an underestimation of 0.42 percent per year for the period of 2000&#150;2004." His results imply that during the first years of the 2000s, the Mexican economy did not grow at an average annual rate of 1.6 percent (as estimated by INEGI), but instead it grew at an annual average rate of 2 percent.</font></p>     <p align="justify"><font face="verdana" size="2">&nbsp;</font></p>     ]]></body>
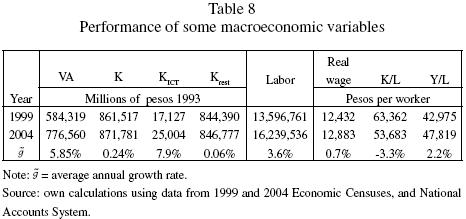
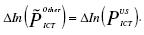
<body><![CDATA[<p align="justify"><font face="verdana" size="2"><b><i>A growth accounting exercise</i></b></font></p>     <p align="justify"><font face="verdana" size="2">In this section, we first develop the theoretical framework for the growth accounting exercise. We then apply it to the Mexican economy between 1999 and 2004.</font></p>     <p align="justify"><font face="verdana" size="2">The neoclassical hypothesis establishes that current GDP moves around its potential level. Potential output, in turn, is a function of not only the availability of productive resources, but also of their use &#150;efficiently or inefficiently&#150;, individually and total. In other words, the economy is limited by the supply side, not by the demand side. The starting point is an identity equation, called the aggregated production function, which establishes the relationship between the national product and the efficient use of the productive resources:</font></p>     <p align="center"><font face="verdana" size="2"><img src="/img/revistas/ecoqu/v6n1/a2s5.jpg"></font></p>     <p align="justify"><font face="verdana" size="2">In the above expression, <i>Y </i>refers to the real GDP. In the literature, the variable <i>A </i>is related to technology or knowledge; <i>K </i>and <i>L </i>represent the quantities of capital and labor, respectively; and &#945; and (1&#150;&#945;) are their respective shares. According to this equation, economic growth depends on: the introduction of technical change, the efficient use of productive resources, the accumulation of physical capital, and the increase in the quantity of workers.</font></p>     <p align="justify"><font face="verdana" size="2">Differentiating the aggregate production function, separating ICT capital from the rest of the physical capital, and defining the multifactor productivity as the "residual", we obtain the following expression</font></p>     <p align="center"><font face="verdana" size="2"><img src="/img/revistas/ecoqu/v6n1/a2s6.jpg"></font></p>     <p align="justify"><font face="verdana" size="2">In the above expression, the symbol &#916; represents the increment of the variable in question, and &#945; is the share of physical capital divided into two parts, one relative to ICT capital (&#945;<sub>ICT</sub>), and the other relative to the rest of physical capital (&#945;<sub>ICT</sub>).<sup><a href="#notas">9</a></sup> We will use equation (3) to perform our growth accounting exercise.</font></p>     <p align="justify"><font face="verdana" size="2">The Economic Censuses of 1999 and 2004 give us the information about the value added, ICT capital and the rest of physical capital, number of workers, and other relevant variables, such as wages. <a href="#t8">Table 8</a> presents the levels of these variables in real terms and their corresponding average annual growth rates (<img src="/img/revistas/ecoqu/v6n1/a2s7.jpg">). To deflate ICT capital and non&#150;ICT capital we utilize the investment price index of machines and equipment of the private sector, and the total investment price index, respectively.</font></p>     <p align="center"><font face="verdana" size="2"><a name="t8"></a></font></p>     ]]></body>
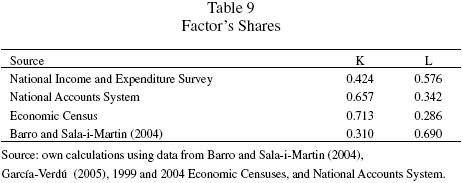
<body><![CDATA[<p align="center"><font face="verdana" size="2">&nbsp;</font></p>     <p align="center"><font face="verdana" size="2"><img src="/img/revistas/ecoqu/v6n1/a2t8.jpg"></font></p>     <p align="center"><font face="verdana" size="2">&nbsp;</font></p>     <p align="justify"><font face="verdana" size="2">It is worth emphasizing that, while labor productivity (Y/L) grew at an average annual rate of 2.2 percent, real wage (W) grew at an average annual rate of just 0.7 percent. Unfortunately, capital per worker (K/L) does not only diminish, it does so at an accelerating rate, reflecting essentially the small growth of non&#150;ICT capital between 1999 and 2004. The share of ICT capital relative to total capital increased from 1.99 percent in 1999 to 2.87 percent in 2004.<sup><a href="#notas">10</a></sup></font></p>     <p align="justify"><font face="verdana" size="2">The other piece of information required to achieve the accounting exercise is the factors' share. <a href="#t9">Table 9</a> shows the estimated shares of labor and capital within the national income, according to various sources.<sup><a href="#notas">11</a></sup></font></p>     <p align="center"><font face="verdana" size="2"><a name="t9"></a></font></p>     <p align="center"><font face="verdana" size="2">&nbsp;</font></p>     <p align="center"><font face="verdana" size="2"><img src="/img/revistas/ecoqu/v6n1/a2t9.jpg"></font></p>     <p align="center"><font face="verdana" size="2">&nbsp;</font></p>     <p align="justify"><font face="verdana" size="2">In the case of the National Income and Expenditure Survey (ENIGH), the factors' share represents averages from 1998, 2000, and 2002 (Garc&iacute;a&#150;Verd&uacute;, 2005). In the case of the National Accounts System and the Economic Census, capital and labor shares correspond to the annual average between 1999 and 2004. We add the approximation of Barro and Sala&#150;i&#150;Martin (2004) in order to reflect the belief that worldwide income distribution is basically similar to that of the United States.<sup><a href="#notas">12</a></sup></font></p>     ]]></body>
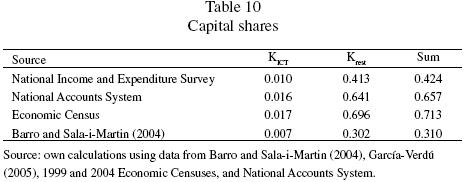
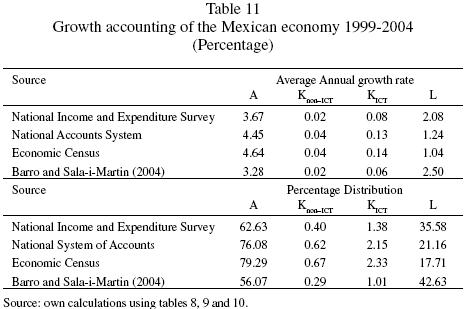
<body><![CDATA[<p align="justify"><font face="verdana" size="2">The information presented in <a href="#t9">table 9</a> suggests quite different realities. Garc&iacute;a&#150;Verd&uacute; (2005) argues that the US and Mexico's factors' share are relatively similar. However, the estimates based on the National Accounts System reveals a different Mexico. Moreover, according to the Economic Census, the "slices of the pie" were cut precisely the opposite way. We consider the latter is true because, among other reasons, National Accounts covers only the formal part of the Mexican economy.<sup><a href="#notas">13</a></sup></font></p>     <p align="justify"><font face="verdana" size="2">To split the share of physical capital between ICT capital and non&#150;ICT capital, the literature generally uses a method created by the BLS (Sichel, 1999). However, we do not have the necessary information to apply such method. Instead, we use the share of ICT capital with respect to total capital between 1999 and 2004. According to the Economic Censuses, the former represents 2.43 percent of the latter. The data are presented below.</font></p>     <p align="center"><font face="verdana" size="2"><img src="/img/revistas/ecoqu/v6n1/a2t10.jpg"></font></p>     <p align="justify"><font face="verdana" size="2"><a href="#t11">Table 11</a> presents the results of the accounting growth exercise,</font></p>     <p align="center"><font face="verdana" size="2"><a name="t11"></a></font></p>     <p align="center"><font face="verdana" size="2">&nbsp;</font></p>     <p align="center"><font face="verdana" size="2"><img src="/img/revistas/ecoqu/v6n1/a2t11.jpg"></font></p>     <p align="justify"><font face="verdana" size="2">Our results indicate that between 1999 and 2004, the multifactor is and labor's contributions account for the majority of the growth of the Mexican economy. ICT capital contributed, but to a much lesser extent, and the contribution of non&#150;ICT capital was almost imperceptible. Ever though ICT capital accounts for, just 2.43 percent of total capital, its contribution to economic growth was approximately three times greater than the contribution of non&#150;ICT capital.</font></p>     <p align="justify"><font face="verdana" size="2">According to Lau and Park (2003), between 1985 and 1995, the annual growth rates in Hong Kong, South Korea, Singapore and Taiwan were 6.01, 8.48, 8.98 and 7.24 percent, respectively. The multifactor contribution was, in each of these countries, 3.01, 3.28, 2.71, and 3.27 percent, respectively. These rates represented approximately 50.7, 38.7, 30.2, and 45.2 percent of their average annual growth rate. In contrast, between 1999 and 2004, Mexico's multifactor annual growth rate was on average 4.01 percent, which represented 68.5 percent of its economy. In this sense, it does not seem sensible to attribute the observed economic growth to increased business efficiencies and knowledge. Rather, our results suggest that Mexican multifactor contribution is overstated, and that factors' individual contributions are understated. Given the significant magnitude of capital share in Mexico, we would have expected it to have a greater contribution to economic growth. Taking a historical perspective, between 1940 and 1980, labor, capital, and multifactor contributions were 23.0, 40.5, and 36.5 percent respectively (El&iacute;as, 1992), while during the 1990s, they were 35, 42, and 22 percent, respectively (Hofman, 2001).</font></p>     <p align="justify"><font face="verdana" size="2">Between 1995 and 2000, the average annual growth rate in Canada, France, Germany, the United Kingdom and the United States were 4.2, 2.81, 2.06, 3.55, and 4.4 percent, respectively (Colecchia and Schreyer, 2001). The ICT contribution to each country's output growth was 0.97, 0.78, 0.83, 1.04, and 1.71 percent, respectively. This represents approximately 23.1, 27.8, 40.3, 29.3, and 38.9 percent of their average annual growth rate. Using Economic Censuses, Mexico's figure is barely 2.33 percent. All these results indicate that the new economy has not yet taken hold in Mexico.</font></p>     ]]></body>
<body><![CDATA[<p align="justify"><font face="verdana" size="2">We clarify the nuance of the previous table in two ways. First, we assume that the contribution of capital to growth is <i>underestimated </i>due to the low valuation of capital by economic actors and also because of the use of the implicit price deflators. In truth, it does not seem plausible that the rate of capital growth was practically zero between 1999 and 2004. Second, the contribution of labor to growth also seems <i>underestimated</i>, due to both firms underreporting the number of workers and labor's miniscule factor share.<sup><a href="#notas">14</a></sup> In short, our results suggest that the multifactor contribution to growth is overstated while the individual factors' contributions are under&#150;estimated.</font></p>     <p align="justify"><font face="verdana" size="2">&nbsp;</font></p>     <p align="justify"><font face="verdana" size="2"><b><i>Final Comments</i></b></font></p>     <p align="justify"><font face="verdana" size="2">Following a standard approach, we have elaborated an accounting growth exercise for the Mexican economy between 1999 and 2004. Prior to that, we calculated the size of the ICT sector. Unfortunately, it seems that the ICT sector's participation in the economy has decreased since then. Special care was taken before utilizing the implicit price deflators of the National Accounts System and the factor shares derived from the Economic Censuses, the National Accounts System, and the National Income and Expenditure Surveys. Following the example of the Australian Bureau of Statistics, price indexes were imported from the US ICT sector. Although ICT capital grew in an accelerating manner during the period of analysis, its contribution to Mexico's economic growth was rather limited in a historical and international sense. In light of the international evidence, our results indicate that the new economy has not sufficiently taken hold in Mexico.</font></p>     <p align="justify"><font face="verdana" size="2">With respect to our results, two warnings are given. First, we assume that the contribution of capital to growth is <i>underestimated </i>because of the low valuation of capital by economic actors and also because of the use of the official implicit price deflator for capital. In truth, it does not seem sensible that the rate of capital growth was practically zero between 1999 and 2004. Secondly, the contribution of labor to growth also seems <i>underestimated, </i>due to both firms underreporting the number of workers and labor's miniscule factor share. In other words, it seems that the multifactor contribution is statistically inaccurate because of the underestimation of the contributions of individual factors.</font></p>     <p align="justify"><font face="verdana" size="2">&nbsp;</font></p>     <p align="justify"><font face="verdana" size="2"><b><i>References</i></b></font></p>     <!-- ref --><p align="justify"><font face="verdana" size="2">ABS (2001). "Hedonic price indexes for computers in Australia", STD/NA(2001)18, OECD<i>.    &nbsp;&nbsp;&nbsp;&nbsp;&nbsp;&nbsp;&nbsp;&nbsp;[&#160;<a href="javascript:void(0);" onclick="javascript: window.open('/scielo.php?script=sci_nlinks&ref=3031027&pid=S1870-6622200900020000200001&lng=','','width=640,height=500,resizable=yes,scrollbars=1,menubar=yes,');">Links</a>&#160;]<!-- end-ref --></i></font></p>     <!-- ref --><p align="justify"><font face="verdana" size="2">Aghion, P. and S. Durlauf (2005). <i>Handbook of Economic Growth, </i>Elsevier.    &nbsp;&nbsp;&nbsp;&nbsp;&nbsp;&nbsp;&nbsp;&nbsp;[&#160;<a href="javascript:void(0);" onclick="javascript: window.open('/scielo.php?script=sci_nlinks&ref=3031029&pid=S1870-6622200900020000200002&lng=','','width=640,height=500,resizable=yes,scrollbars=1,menubar=yes,');">Links</a>&#160;]<!-- end-ref --></font></p>     <!-- ref --><p align="justify"><font face="verdana" size="2">Ahmad, N., P. Schreyer and A. W&ouml;lf (2004). "ICT investment in OECD countries and its economic impacts", <i>The Economic Impact of ICT: Measurement, Evidence and Implications, </i>OECD.    &nbsp;&nbsp;&nbsp;&nbsp;&nbsp;&nbsp;&nbsp;&nbsp;[&#160;<a href="javascript:void(0);" onclick="javascript: window.open('/scielo.php?script=sci_nlinks&ref=3031031&pid=S1870-6622200900020000200003&lng=','','width=640,height=500,resizable=yes,scrollbars=1,menubar=yes,');">Links</a>&#160;]<!-- end-ref --></font></p>     <!-- ref --><p align="justify"><font face="verdana" size="2">Barro, R. J. and X. Sala&#150;i&#150;Martin (2004). <i>Economic Growth, </i>MIT Press.    &nbsp;&nbsp;&nbsp;&nbsp;&nbsp;&nbsp;&nbsp;&nbsp;[&#160;<a href="javascript:void(0);" onclick="javascript: window.open('/scielo.php?script=sci_nlinks&ref=3031033&pid=S1870-6622200900020000200004&lng=','','width=640,height=500,resizable=yes,scrollbars=1,menubar=yes,');">Links</a>&#160;]<!-- end-ref --></font></p>     <!-- ref --><p align="justify"><font face="verdana" size="2">Colecchia, A. and P. Schreyer (2001). "ICT investment and economic growth in the 1990s: is the United States a unique case? A comparative study of nine OECD countries", DSTI/DOC(2001), OECD.    &nbsp;&nbsp;&nbsp;&nbsp;&nbsp;&nbsp;&nbsp;&nbsp;[&#160;<a href="javascript:void(0);" onclick="javascript: window.open('/scielo.php?script=sci_nlinks&ref=3031035&pid=S1870-6622200900020000200005&lng=','','width=640,height=500,resizable=yes,scrollbars=1,menubar=yes,');">Links</a>&#160;]<!-- end-ref --></font></p>     <!-- ref --><p align="justify"><font face="verdana" size="2">El&iacute;as, V. J. (1992). <i>Sources of Growth: A Study of Seven Latin American Economies. </i>ICS Press.    &nbsp;&nbsp;&nbsp;&nbsp;&nbsp;&nbsp;&nbsp;&nbsp;[&#160;<a href="javascript:void(0);" onclick="javascript: window.open('/scielo.php?script=sci_nlinks&ref=3031037&pid=S1870-6622200900020000200006&lng=','','width=640,height=500,resizable=yes,scrollbars=1,menubar=yes,');">Links</a>&#160;]<!-- end-ref --></font></p>     <!-- ref --><p align="justify"><font face="verdana" size="2">Faal, E. (2005). "GDP growth, potential output, and output gaps in Mexico", WP/05/93, IMF.    &nbsp;&nbsp;&nbsp;&nbsp;&nbsp;&nbsp;&nbsp;&nbsp;[&#160;<a href="javascript:void(0);" onclick="javascript: window.open('/scielo.php?script=sci_nlinks&ref=3031039&pid=S1870-6622200900020000200007&lng=','','width=640,height=500,resizable=yes,scrollbars=1,menubar=yes,');">Links</a>&#160;]<!-- end-ref --></font></p>     <!-- ref --><p align="justify"><font face="verdana" size="2">Garc&iacute;a&#150;Verd&uacute;, R. (2005). "Factor shares from Household survey data", <i>Working Paper, </i>2005&#150;05, Bank of Mexico.    &nbsp;&nbsp;&nbsp;&nbsp;&nbsp;&nbsp;&nbsp;&nbsp;[&#160;<a href="javascript:void(0);" onclick="javascript: window.open('/scielo.php?script=sci_nlinks&ref=3031041&pid=S1870-6622200900020000200008&lng=','','width=640,height=500,resizable=yes,scrollbars=1,menubar=yes,');">Links</a>&#160;]<!-- end-ref --></font></p>     <!-- ref --><p align="justify"><font face="verdana" size="2">Griliches, Z. (1994). "Productivity, R &amp; D, and the data constraint", <i>American Economic Review, </i>84(1), 1&#150;23.    &nbsp;&nbsp;&nbsp;&nbsp;&nbsp;&nbsp;&nbsp;&nbsp;[&#160;<a href="javascript:void(0);" onclick="javascript: window.open('/scielo.php?script=sci_nlinks&ref=3031043&pid=S1870-6622200900020000200009&lng=','','width=640,height=500,resizable=yes,scrollbars=1,menubar=yes,');">Links</a>&#160;]<!-- end-ref --></font></p>     <!-- ref --><p align="justify"><font face="verdana" size="2">Grimm, B. T. (1998). "Price indexes for selected semiconductors, 1974&#150;96", <i>Survey of Current Business, </i>February.    &nbsp;&nbsp;&nbsp;&nbsp;&nbsp;&nbsp;&nbsp;&nbsp;[&#160;<a href="javascript:void(0);" onclick="javascript: window.open('/scielo.php?script=sci_nlinks&ref=3031045&pid=S1870-6622200900020000200010&lng=','','width=640,height=500,resizable=yes,scrollbars=1,menubar=yes,');">Links</a>&#160;]<!-- end-ref --></font></p>     <!-- ref --><p align="justify"><font face="verdana" size="2">Guerrero, C. (2006). "Una aproximaci&oacute;n al sesgo de medici&oacute;n del precio de las computadoras personales en M&eacute;xico", <i>Econom&iacute;a Mexicana (nueva &eacute;poca), </i>XV, 1, 97&#150;124.    &nbsp;&nbsp;&nbsp;&nbsp;&nbsp;&nbsp;&nbsp;&nbsp;[&#160;<a href="javascript:void(0);" onclick="javascript: window.open('/scielo.php?script=sci_nlinks&ref=3031047&pid=S1870-6622200900020000200011&lng=','','width=640,height=500,resizable=yes,scrollbars=1,menubar=yes,');">Links</a>&#160;]<!-- end-ref --></font></p>     <!-- ref --><p align="justify"><font face="verdana" size="2">Guerrero, C. (2008). "Sesgo de medici&oacute;n del PIB derivado de los cambios en la calidad del sector TI: M&eacute;xico 2000&#150;2004", <i>Estudios Econ&oacute;micos, </i>23, 253&#150;80.    &nbsp;&nbsp;&nbsp;&nbsp;&nbsp;&nbsp;&nbsp;&nbsp;[&#160;<a href="javascript:void(0);" onclick="javascript: window.open('/scielo.php?script=sci_nlinks&ref=3031049&pid=S1870-6622200900020000200012&lng=','','width=640,height=500,resizable=yes,scrollbars=1,menubar=yes,');">Links</a>&#160;]<!-- end-ref --></font></p>     <!-- ref --><p align="justify"><font face="verdana" size="2">Guerrero, C. (2009). "Istmo Centroamericano y Rep&uacute;blica Dominicana: an&aacute;lisis del desempe&ntilde;o de las productividades individuales y total de los factores", LC/MEX/L.906, ECLAC.    &nbsp;&nbsp;&nbsp;&nbsp;&nbsp;&nbsp;&nbsp;&nbsp;[&#160;<a href="javascript:void(0);" onclick="javascript: window.open('/scielo.php?script=sci_nlinks&ref=3031051&pid=S1870-6622200900020000200013&lng=','','width=640,height=500,resizable=yes,scrollbars=1,menubar=yes,');">Links</a>&#160;]<!-- end-ref --></font></p>     <!-- ref --><p align="justify"><font face="verdana" size="2">Hofman, A. A. (2001). "Long run economic development in Latin America in a comparative perspective: Proximate and ultimate causes", <i>Serie Macroeconom&iacute;a del Desarrollo, </i>8, ECLAC.    &nbsp;&nbsp;&nbsp;&nbsp;&nbsp;&nbsp;&nbsp;&nbsp;[&#160;<a href="javascript:void(0);" onclick="javascript: window.open('/scielo.php?script=sci_nlinks&ref=3031053&pid=S1870-6622200900020000200014&lng=','','width=640,height=500,resizable=yes,scrollbars=1,menubar=yes,');">Links</a>&#160;]<!-- end-ref --></font></p>     <!-- ref --><p align="justify"><font face="verdana" size="2">INEGI (1999). <i>Actividades Inform&aacute;ticas y de Telecomunicaciones: Censos Econ&oacute;micos 1999.    &nbsp;&nbsp;&nbsp;&nbsp;&nbsp;&nbsp;&nbsp;&nbsp;[&#160;<a href="javascript:void(0);" onclick="javascript: window.open('/scielo.php?script=sci_nlinks&ref=3031055&pid=S1870-6622200900020000200015&lng=','','width=640,height=500,resizable=yes,scrollbars=1,menubar=yes,');">Links</a>&#160;]<!-- end-ref --></i></font></p>     <!-- ref --><p align="justify"><font face="verdana" size="2">INEGI (2003). "Indicadores sobre el sector de la tecnolog&iacute;a de la informaci&oacute;n y comunicaciones 2002", <i>Bolet&iacute;n de Pol&iacute;tica Inform&aacute;tica, </i>6, 18&#150;26.    &nbsp;&nbsp;&nbsp;&nbsp;&nbsp;&nbsp;&nbsp;&nbsp;[&#160;<a href="javascript:void(0);" onclick="javascript: window.open('/scielo.php?script=sci_nlinks&ref=3031057&pid=S1870-6622200900020000200016&lng=','','width=640,height=500,resizable=yes,scrollbars=1,menubar=yes,');">Links</a>&#160;]<!-- end-ref --></font></p>     <!-- ref --><p align="justify"><font face="verdana" size="2">INEGI (2004a). <i>Actividades Relacionadas con la Inform&aacute;tica y las Telecomunicaciones en M&eacute;xico: Censos Econ&oacute;micos 2004.    &nbsp;&nbsp;&nbsp;&nbsp;&nbsp;&nbsp;&nbsp;&nbsp;[&#160;<a href="javascript:void(0);" onclick="javascript: window.open('/scielo.php?script=sci_nlinks&ref=3031059&pid=S1870-6622200900020000200017&lng=','','width=640,height=500,resizable=yes,scrollbars=1,menubar=yes,');">Links</a>&#160;]<!-- end-ref --></i></font></p>     <!-- ref --><p align="justify"><font face="verdana" size="2">INEGI (2004b). <i>Metodolog&iacute;a de los Censos Econ&oacute;micos.    &nbsp;&nbsp;&nbsp;&nbsp;&nbsp;&nbsp;&nbsp;&nbsp;[&#160;<a href="javascript:void(0);" onclick="javascript: window.open('/scielo.php?script=sci_nlinks&ref=3031061&pid=S1870-6622200900020000200018&lng=','','width=640,height=500,resizable=yes,scrollbars=1,menubar=yes,');">Links</a>&#160;]<!-- end-ref --></i></font></p>     <!-- ref --><p align="justify"><font face="verdana" size="2">INEGI (2005). <i>Censos Econ&oacute;micos 2004: Resultados Generales.    &nbsp;&nbsp;&nbsp;&nbsp;&nbsp;&nbsp;&nbsp;&nbsp;[&#160;<a href="javascript:void(0);" onclick="javascript: window.open('/scielo.php?script=sci_nlinks&ref=3031063&pid=S1870-6622200900020000200019&lng=','','width=640,height=500,resizable=yes,scrollbars=1,menubar=yes,');">Links</a>&#160;]<!-- end-ref --></i></font></p>     <!-- ref --><p align="justify"><font face="verdana" size="2">INEGI (2008). <i>Actualizaci&oacute;n del Sistema de Cuentas Nacionales de M&eacute;xico 2003.    &nbsp;&nbsp;&nbsp;&nbsp;&nbsp;&nbsp;&nbsp;&nbsp;[&#160;<a href="javascript:void(0);" onclick="javascript: window.open('/scielo.php?script=sci_nlinks&ref=3031065&pid=S1870-6622200900020000200020&lng=','','width=640,height=500,resizable=yes,scrollbars=1,menubar=yes,');">Links</a>&#160;]<!-- end-ref --></i></font></p>     <!-- ref --><p align="justify"><font face="verdana" size="2">INEGI. <i>Sistema de Cuentas Nacionales de M&eacute;xico. Cuentas de Bienes y Servicios: Metodolog&iacute;a.    &nbsp;&nbsp;&nbsp;&nbsp;&nbsp;&nbsp;&nbsp;&nbsp;[&#160;<a href="javascript:void(0);" onclick="javascript: window.open('/scielo.php?script=sci_nlinks&ref=3031067&pid=S1870-6622200900020000200021&lng=','','width=640,height=500,resizable=yes,scrollbars=1,menubar=yes,');">Links</a>&#160;]<!-- end-ref --></i></font></p>     <!-- ref --><p align="justify"><font face="verdana" size="2">Jorgenson, D. (2005). "Accounting for growth in the information age", <i>Handbook of Economic Growth, </i>Philippe Aghion and Steven Durlauf, editors, Elsevier.    &nbsp;&nbsp;&nbsp;&nbsp;&nbsp;&nbsp;&nbsp;&nbsp;[&#160;<a href="javascript:void(0);" onclick="javascript: window.open('/scielo.php?script=sci_nlinks&ref=3031069&pid=S1870-6622200900020000200022&lng=','','width=640,height=500,resizable=yes,scrollbars=1,menubar=yes,');">Links</a>&#160;]<!-- end-ref --></font></p>     <!-- ref --><p align="justify"><font face="verdana" size="2">Lau, L. J. and J. Park (2003). "The sources of East Asian economic growth revisited", Stanford University/State University of New York at Buffalo.    &nbsp;&nbsp;&nbsp;&nbsp;&nbsp;&nbsp;&nbsp;&nbsp;[&#160;<a href="javascript:void(0);" onclick="javascript: window.open('/scielo.php?script=sci_nlinks&ref=3031071&pid=S1870-6622200900020000200023&lng=','','width=640,height=500,resizable=yes,scrollbars=1,menubar=yes,');">Links</a>&#160;]<!-- end-ref --></font></p>     <!-- ref --><p align="justify"><font face="verdana" size="2">Moore, G. E. (1965). "Cramming more components onto integrated circuits", <i>Electronics, </i>38, 8, 114&#150;7.    &nbsp;&nbsp;&nbsp;&nbsp;&nbsp;&nbsp;&nbsp;&nbsp;[&#160;<a href="javascript:void(0);" onclick="javascript: window.open('/scielo.php?script=sci_nlinks&ref=3031073&pid=S1870-6622200900020000200024&lng=','','width=640,height=500,resizable=yes,scrollbars=1,menubar=yes,');">Links</a>&#160;]<!-- end-ref --></font></p>     <!-- ref --><p align="justify"><font face="verdana" size="2">Moore, G. E. (1997). "An Update on Moore's Law", Intel Corporation.    &nbsp;&nbsp;&nbsp;&nbsp;&nbsp;&nbsp;&nbsp;&nbsp;[&#160;<a href="javascript:void(0);" onclick="javascript: window.open('/scielo.php?script=sci_nlinks&ref=3031075&pid=S1870-6622200900020000200025&lng=','','width=640,height=500,resizable=yes,scrollbars=1,menubar=yes,');">Links</a>&#160;]<!-- end-ref --></font></p>     <!-- ref --><p align="justify"><font face="verdana" size="2">OECD (2004). <i>The Economic Impact of ICT: Measurement, Evidence and Implications, </i>OECD.    &nbsp;&nbsp;&nbsp;&nbsp;&nbsp;&nbsp;&nbsp;&nbsp;[&#160;<a href="javascript:void(0);" onclick="javascript: window.open('/scielo.php?script=sci_nlinks&ref=3031077&pid=S1870-6622200900020000200026&lng=','','width=640,height=500,resizable=yes,scrollbars=1,menubar=yes,');">Links</a>&#160;]<!-- end-ref --></font></p>     <!-- ref --><p align="justify"><font face="verdana" size="2">Oliner, S. D. and D. E. Sichel (1994). "Computers and output growth revisited: How big is the puzzle?", <i>Brookings Papers on Economic Activity, 2, </i>273&#150;334.    &nbsp;&nbsp;&nbsp;&nbsp;&nbsp;&nbsp;&nbsp;&nbsp;[&#160;<a href="javascript:void(0);" onclick="javascript: window.open('/scielo.php?script=sci_nlinks&ref=3031079&pid=S1870-6622200900020000200027&lng=','','width=640,height=500,resizable=yes,scrollbars=1,menubar=yes,');">Links</a>&#160;]<!-- end-ref --></font></p>     <!-- ref --><p align="justify"><font face="verdana" size="2">ONU (1993). <i>Sistema de Cuentas Nacionales 1993.    &nbsp;&nbsp;&nbsp;&nbsp;&nbsp;&nbsp;&nbsp;&nbsp;[&#160;<a href="javascript:void(0);" onclick="javascript: window.open('/scielo.php?script=sci_nlinks&ref=3031081&pid=S1870-6622200900020000200028&lng=','','width=640,height=500,resizable=yes,scrollbars=1,menubar=yes,');">Links</a>&#160;]<!-- end-ref --></i></font></p>     <!-- ref --><p align="justify"><font face="verdana" size="2">Pilat, D. and A. Devlin (2004), "The diffusion of ICT in OECD economies", <i>The Economic Impact of ICT: Measurement, Evidence and Implications, </i>OECD.    &nbsp;&nbsp;&nbsp;&nbsp;&nbsp;&nbsp;&nbsp;&nbsp;[&#160;<a href="javascript:void(0);" onclick="javascript: window.open('/scielo.php?script=sci_nlinks&ref=3031083&pid=S1870-6622200900020000200029&lng=','','width=640,height=500,resizable=yes,scrollbars=1,menubar=yes,');">Links</a>&#160;]<!-- end-ref --></font></p>     <!-- ref --><p align="justify"><font face="verdana" size="2">Schreyer, P. (2001). "Computer price indexes and international growth and productivity comparisons", STD/DOC(2001)1, OECD.    &nbsp;&nbsp;&nbsp;&nbsp;&nbsp;&nbsp;&nbsp;&nbsp;[&#160;<a href="javascript:void(0);" onclick="javascript: window.open('/scielo.php?script=sci_nlinks&ref=3031085&pid=S1870-6622200900020000200030&lng=','','width=640,height=500,resizable=yes,scrollbars=1,menubar=yes,');">Links</a>&#160;]<!-- end-ref --></font></p>     <!-- ref --><p align="justify"><font face="verdana" size="2">Sichel, D. E. (1999). "Computers and aggregate economic growth: an update", <i>Business Economics, </i>18&#150;24.    &nbsp;&nbsp;&nbsp;&nbsp;&nbsp;&nbsp;&nbsp;&nbsp;[&#160;<a href="javascript:void(0);" onclick="javascript: window.open('/scielo.php?script=sci_nlinks&ref=3031087&pid=S1870-6622200900020000200031&lng=','','width=640,height=500,resizable=yes,scrollbars=1,menubar=yes,');">Links</a>&#160;]<!-- end-ref --></font></p>     <!-- ref --><p align="justify"><font face="verdana" size="2">Solow, R. M. (1987). "We'd better watch out", <i>New York Times, </i>Book Review, July 12, 36.    &nbsp;&nbsp;&nbsp;&nbsp;&nbsp;&nbsp;&nbsp;&nbsp;[&#160;<a href="javascript:void(0);" onclick="javascript: window.open('/scielo.php?script=sci_nlinks&ref=3031089&pid=S1870-6622200900020000200032&lng=','','width=640,height=500,resizable=yes,scrollbars=1,menubar=yes,');">Links</a>&#160;]<!-- end-ref --></font></p>     <!-- ref --><p align="justify"><font face="verdana" size="2">Triplett, J. E. (2001). "IT, hedonic price indexes, and productivity", The Brookings Institution.    &nbsp;&nbsp;&nbsp;&nbsp;&nbsp;&nbsp;&nbsp;&nbsp;[&#160;<a href="javascript:void(0);" onclick="javascript: window.open('/scielo.php?script=sci_nlinks&ref=3031091&pid=S1870-6622200900020000200033&lng=','','width=640,height=500,resizable=yes,scrollbars=1,menubar=yes,');">Links</a>&#160;]<!-- end-ref --></font></p>     <!-- ref --><p align="justify"><font face="verdana" size="2">Triplett, J. E. (2006). <i>Handbook on Hedonic Indexes and Quality Adjustments in Price Indexes: Special Application to Information Technology Products, </i>OECD.    &nbsp;&nbsp;&nbsp;&nbsp;&nbsp;&nbsp;&nbsp;&nbsp;[&#160;<a href="javascript:void(0);" onclick="javascript: window.open('/scielo.php?script=sci_nlinks&ref=3031093&pid=S1870-6622200900020000200034&lng=','','width=640,height=500,resizable=yes,scrollbars=1,menubar=yes,');">Links</a>&#160;]<!-- end-ref --></font></p>     <!-- ref --><p align="justify"><font face="verdana" size="2">Wasshausen, D. and B. R. Moulton (2006). "The role of hedonic methods in measuring real GDP in the United States", <i>Are We Measuring Productivity Correctly?, </i>EUROSTAT</font>&nbsp;&nbsp;&nbsp;&nbsp;&nbsp;&nbsp;&nbsp;&nbsp;[&#160;<a href="javascript:void(0);" onclick="javascript: window.open('/scielo.php?script=sci_nlinks&ref=3031095&pid=S1870-6622200900020000200035&lng=','','width=640,height=500,resizable=yes,scrollbars=1,menubar=yes,');">Links</a>&#160;]<!-- end-ref --><!-- ref --><p align="justify"><font face="verdana" size="2">Wyckoff, A. W. (1995). "The impact of computers prices on international comparison of labour productivity", <i>Economics of Innovation and New Technology, </i>3, 277&#150;293.    &nbsp;&nbsp;&nbsp;&nbsp;&nbsp;&nbsp;&nbsp;&nbsp;[&#160;<a href="javascript:void(0);" onclick="javascript: window.open('/scielo.php?script=sci_nlinks&ref=3031096&pid=S1870-6622200900020000200036&lng=','','width=640,height=500,resizable=yes,scrollbars=1,menubar=yes,');">Links</a>&#160;]<!-- end-ref --></font></p>     <p align="justify"><font face="verdana" size="2">&nbsp;</font></p>     <p align="justify"><font face="verdana" size="2"><b><i><a name="notas"></a>Notas</i></b></font></p>     ]]></body>
<body><![CDATA[<p align="justify"><font face="verdana" size="2"><sup>*</sup> Thanks are due to Andrew Stiling for his helpful research assistance, to Professor Willy W. Cortez and to the two anonymous referees for their suggestions.</font></p>     <p align="justify"><font face="verdana" size="2"><sup>2 </sup>In the most recent <i>Handbook of Economic Growth, </i>edited by Aghion and Durlauf (2005), Jorgenson (p. 745) wrote: "A consensus has emerged that the development and deployment of information technology is the foundation of the American growth resurgence. A mantra of the 'new economy' <i>&#150;faster, better, cheaper&#150; </i>captures the speed of technological change and product improvement in semiconductors and the precipitous and continuing fall in semiconductor prices. The price decline has been transmitted to the prices of products that rely heavily on semiconductor technology, like computers and telecommunications equipment. This technology has also helped to reduce the cost of aircraft, automobiles, scientific instruments, and a host of other products."</font></p>     <p align="justify"><font face="verdana" size="2"><sup>3 </sup>The Handbook released by the United Nations, the European Statistics (EUROSTAT), the International Monetary Fund, the OECD and the World Bank says the following (1993, pp. 440&#150;441): "A more general and potential method to operate with quality changes consists in utilizing the denominated 'hedonic' hypothesis&hellip; this method can be applied for any good or service whose price depends principally on a few basic characteristics and which has a sufficient number of models of differing qualities being sold simultaneously in the market." Recently, the OECD launched an extensive Handbook regarding the hedonic method with special emphasis on the ICT sector (Triplett, 2006).</font></p>     <p align="justify"><font face="verdana" size="2"><sup>4 </sup>Richard McKenzie, an official of the ABS, explained to us that his office utilizes personal computer price indexes compiled by the Bureau of Economic Analysis (BEA) and the Bureau of Labor Statistics (BLS) as deflators in the National Accounts and in the pertinent components of the Australian consumer price index. The transfer process of the American price indexes to the Australian case is the following: 1) the ABS makes an adjustment based on the exchange rate, and 2) the ABS allows for one quarter lag of the price index in order to account for the arrival of new models and other delays in the transmission mechanism. The official explained that the pricing practices of personal computer companies in the two countries do not function exactly the same, and some components exist in Australian computers which are not imported from the United States, but rather are imported from Asian countries. For these cases, the local prices are not directly affected by either the price of American machines or the bilateral exchange rate. Thus, in spite of this transfer having gone on for more than a decade, the ABS has begun developing its own hedonic models.</font></p>     <p align="justify"><font face="verdana" size="2"><sup>5 </sup>An explanation of the restrictions of the use of the hedonic methodology is found in Triplett, chief economist of the BEA between 1985 and 1997 (2001, p. 4): "The cost of hedonic indexes is a great barrier for the more widespread adoption of IT deflators. They require collecting a great amount of data on prices and characteristics of computers, a substantial amount of econometric modeling to estimate hedonic function (of a type of activity that is not commonly carried out in price compiling agencies), and some broad experience in interpreting regression coefficients and apply the regression results to price changes collected for the index."</font></p>     <p align="justify"><font face="verdana" size="2"><sup>6 </sup>According to INEGI (2005, pp. 3&#150;4): "The economic censuses constitute for their coverage &#150;sector, theme, and geographic&#150; the source of basic economic information which is greater and more complete than any other source in the country &hellip; the 2004 Economic Census has a significant sector cover accounting for 964 classes of activity of the 1,051 listed by the SCIAN, which is currently the official classifier for organizing and presenting Mexican economic information. Economic Censuses do not report information about agricultural and forest activities, taxi services, the activities of political associations and organizations, domestic services, and the activities of diplomatic offices and international organizations. They also exclude the informal trade sector, and persons that are self&#150;employed and do not have a known physical location."</font></p>     <p align="justify"><font face="verdana" size="2"><sup>7 </sup>We recall that Griliches (1994) qualified the services as an "immeasurable sector," or more precisely, we believe, "hard to measure".</font></p>     <p align="justify"><font face="verdana" size="2"><sup>8 </sup>According to Schreyer (2001, pp. 13&#150;14), "there are several possibilities for transposing the US deflators to other countries' accounts for purposes of such simulations. In this paper we explored three types of adjustments. First, the use of the United States deflator, unad usted for domestic inflation Second, the use of the United States deflator, adjusted for domestic inflation.<img src="/img/revistas/ecoqu/v6n1/a2s2.jpg"></font></p>     <p align="justify"><font size="2" face="verdana">Second, the use of the United States deflator, adjusted for domestic inflation.<img src="/img/revistas/ecoqu/v6n1/a2s3.jpg"> </font></p>     <p align="justify"><font face="verdana" size="2">The third procedure uses an exchange rate adjustment. This is a plausible approach if the ICT product is internationally traded and/or imported into the country under consideration. One problem is that shifts in exchange rates are not always fully passed on to domestic consumers. Therefore, exchange rate adjustments may under&#150;or over&#150;state the price change in domestic currencies:<img src="/img/revistas/ecoqu/v6n1/a2s4.jpg"></font></p>     ]]></body>


<body><![CDATA[<p align="justify"><font face="verdana" size="2"><sup>9</sup> The proxy variable of ICT capital is "the current value of computers and its peripherals, properties of the economic unity that were not linked to the machines and the production equipments, such as: computers, communications networks, printers, scanners, among others. Software is excluded" (INEGI, 2004b, p. 52).</font></p>     <p align="justify"><font face="verdana" size="2"><sup>10 </sup>Using nominal figures, ICT capital weight would be 2.03 percent and 2.48 percent in 1999 and 2004, respectively.</font></p>     <p align="justify"><font face="verdana" size="2"><sup>11 </sup>In order to estimate share factors, one alternative would be to performance a microeconometric analysis. Unfortunately, the lack of detailed price indexes represents an obstacle to doing this.</font></p>     <p align="justify"><font face="verdana" size="2"><sup>12 </sup>Faal (2005) estimated a share of 0.33 for capital and a share 0.67 for labor.</font></p>     <p align="justify"><font face="verdana" size="2"><sup>13 </sup>It seems then that a key cause of income inequality in Mexico is the existence of the formal and the underground economy.</font></p>     <p align="justify"><font face="verdana" size="2"><sup>14 </sup>This reflects the exaggerated profit margins in the formal economy.</font></p>      ]]></body><back>
<ref-list>
<ref id="B1">
<nlm-citation citation-type="book">
<collab>ABS</collab>
<source><![CDATA["Hedonic price indexes for computers in Australia"]]></source>
<year>2001</year>
<publisher-name><![CDATA[OECD]]></publisher-name>
</nlm-citation>
</ref>
<ref id="B2">
<nlm-citation citation-type="book">
<person-group person-group-type="author">
<name>
<surname><![CDATA[Aghion]]></surname>
<given-names><![CDATA[P.]]></given-names>
</name>
<name>
<surname><![CDATA[Durlauf]]></surname>
<given-names><![CDATA[S.]]></given-names>
</name>
</person-group>
<source><![CDATA[Handbook of Economic Growth]]></source>
<year>2005</year>
<publisher-name><![CDATA[Elsevier]]></publisher-name>
</nlm-citation>
</ref>
<ref id="B3">
<nlm-citation citation-type="book">
<person-group person-group-type="author">
<name>
<surname><![CDATA[Ahmad]]></surname>
<given-names><![CDATA[N.]]></given-names>
</name>
<name>
<surname><![CDATA[Schreyer]]></surname>
<given-names><![CDATA[P.]]></given-names>
</name>
<name>
<surname><![CDATA[Wölf]]></surname>
<given-names><![CDATA[A.]]></given-names>
</name>
</person-group>
<source><![CDATA["ICT investment in OECD countries and its economic impacts": The Economic Impact of ICT: Measurement, Evidence and Implications]]></source>
<year>2004</year>
<publisher-name><![CDATA[OECD]]></publisher-name>
</nlm-citation>
</ref>
<ref id="B4">
<nlm-citation citation-type="book">
<person-group person-group-type="author">
<name>
<surname><![CDATA[Barro]]></surname>
<given-names><![CDATA[R. J.]]></given-names>
</name>
<name>
<surname><![CDATA[Sala-i-Martin]]></surname>
<given-names><![CDATA[X.]]></given-names>
</name>
</person-group>
<source><![CDATA[Economic Growth]]></source>
<year>2004</year>
<publisher-name><![CDATA[MIT Press]]></publisher-name>
</nlm-citation>
</ref>
<ref id="B5">
<nlm-citation citation-type="book">
<person-group person-group-type="author">
<name>
<surname><![CDATA[Colecchia]]></surname>
<given-names><![CDATA[A.]]></given-names>
</name>
<name>
<surname><![CDATA[Schreyer]]></surname>
<given-names><![CDATA[P.]]></given-names>
</name>
</person-group>
<source><![CDATA["ICT investment and economic growth in the 1990s: is the United States a unique case? A comparative study of nine OECD countries"]]></source>
<year>2001</year>
<publisher-name><![CDATA[OECD]]></publisher-name>
</nlm-citation>
</ref>
<ref id="B6">
<nlm-citation citation-type="book">
<person-group person-group-type="author">
<name>
<surname><![CDATA[Elías]]></surname>
<given-names><![CDATA[V. J.]]></given-names>
</name>
</person-group>
<source><![CDATA[Sources of Growth: A Study of Seven Latin American Economies]]></source>
<year>1992</year>
<publisher-name><![CDATA[ICS Press]]></publisher-name>
</nlm-citation>
</ref>
<ref id="B7">
<nlm-citation citation-type="book">
<person-group person-group-type="author">
<name>
<surname><![CDATA[Faal]]></surname>
<given-names><![CDATA[E.]]></given-names>
</name>
</person-group>
<source><![CDATA["GDP growth, potential output, and output gaps in Mexico"]]></source>
<year>2005</year>
<publisher-name><![CDATA[IMF]]></publisher-name>
</nlm-citation>
</ref>
<ref id="B8">
<nlm-citation citation-type="book">
<person-group person-group-type="author">
<name>
<surname><![CDATA[García-Verdú]]></surname>
<given-names><![CDATA[R.]]></given-names>
</name>
</person-group>
<source><![CDATA["Factor shares from Household survey data"]]></source>
<year>2005</year>
<publisher-name><![CDATA[Bank of Mexico]]></publisher-name>
</nlm-citation>
</ref>
<ref id="B9">
<nlm-citation citation-type="journal">
<person-group person-group-type="author">
<name>
<surname><![CDATA[Griliches]]></surname>
<given-names><![CDATA[Z.]]></given-names>
</name>
</person-group>
<article-title xml:lang="en"><![CDATA["Productivity, R & D, and the data constraint"]]></article-title>
<source><![CDATA[American Economic Review]]></source>
<year>1994</year>
<volume>84</volume>
<numero>1</numero>
<issue>1</issue>
<page-range>1-23</page-range></nlm-citation>
</ref>
<ref id="B10">
<nlm-citation citation-type="journal">
<person-group person-group-type="author">
<name>
<surname><![CDATA[Grimm]]></surname>
<given-names><![CDATA[B. T.]]></given-names>
</name>
</person-group>
<article-title xml:lang="en"><![CDATA["Price indexes for selected semiconductors, 1974-96"]]></article-title>
<source><![CDATA[Survey of Current Business]]></source>
<year>1998</year>
</nlm-citation>
</ref>
<ref id="B11">
<nlm-citation citation-type="journal">
<person-group person-group-type="author">
<name>
<surname><![CDATA[Guerrero]]></surname>
<given-names><![CDATA[C.]]></given-names>
</name>
</person-group>
<article-title xml:lang="es"><![CDATA["Una aproximación al sesgo de medición del precio de las computadoras personales en México"]]></article-title>
<source><![CDATA[Economía Mexicana]]></source>
<year>2006</year>
<volume>XV</volume>
<numero>1</numero>
<issue>1</issue>
<page-range>97-124</page-range></nlm-citation>
</ref>
<ref id="B12">
<nlm-citation citation-type="journal">
<person-group person-group-type="author">
<name>
<surname><![CDATA[Guerrero]]></surname>
<given-names><![CDATA[C.]]></given-names>
</name>
</person-group>
<article-title xml:lang="es"><![CDATA["Sesgo de medición del PIB derivado de los cambios en la calidad del sector TI: México 2000-2004"]]></article-title>
<source><![CDATA[Estudios Económicos]]></source>
<year>2008</year>
<volume>23</volume>
<page-range>253-80</page-range></nlm-citation>
</ref>
<ref id="B13">
<nlm-citation citation-type="book">
<person-group person-group-type="author">
<name>
<surname><![CDATA[Guerrero]]></surname>
<given-names><![CDATA[C.]]></given-names>
</name>
</person-group>
<source><![CDATA["Istmo Centroamericano y República Dominicana: análisis del desempeño de las productividades individuales y total de los factores"]]></source>
<year>2009</year>
<publisher-name><![CDATA[ECLAC]]></publisher-name>
</nlm-citation>
</ref>
<ref id="B14">
<nlm-citation citation-type="book">
<person-group person-group-type="author">
<name>
<surname><![CDATA[Hofman]]></surname>
<given-names><![CDATA[A. A.]]></given-names>
</name>
</person-group>
<source><![CDATA["Long run economic development in Latin America in a comparative perspective: Proximate and ultimate causes"]]></source>
<year>2001</year>
<volume>8</volume>
<publisher-name><![CDATA[ECLAC]]></publisher-name>
</nlm-citation>
</ref>
<ref id="B15">
<nlm-citation citation-type="">
<collab>INEGI</collab>
<source><![CDATA[Actividades Informáticas y de Telecomunicaciones: Censos Económicos 1999]]></source>
<year>1999</year>
</nlm-citation>
</ref>
<ref id="B16">
<nlm-citation citation-type="journal">
<collab>INEGI</collab>
<article-title xml:lang="es"><![CDATA["Indicadores sobre el sector de la tecnología de la información y comunicaciones 2002"]]></article-title>
<source><![CDATA[Boletín de Política Informática]]></source>
<year>2003</year>
<volume>6</volume>
<page-range>18-26</page-range></nlm-citation>
</ref>
<ref id="B17">
<nlm-citation citation-type="">
<collab>INEGI</collab>
<source><![CDATA[Actividades Relacionadas con la Informática y las Telecomunicaciones en México: Censos Económicos 2004]]></source>
<year>2004</year>
</nlm-citation>
</ref>
<ref id="B18">
<nlm-citation citation-type="">
<collab>INEGI</collab>
<source><![CDATA[Metodología de los Censos Económicos]]></source>
<year>2004</year>
</nlm-citation>
</ref>
<ref id="B19">
<nlm-citation citation-type="">
<collab>INEGI</collab>
<source><![CDATA[Censos Económicos 2004: Resultados Generales]]></source>
<year>2005</year>
</nlm-citation>
</ref>
<ref id="B20">
<nlm-citation citation-type="">
<collab>INEGI</collab>
<source><![CDATA[Actualización del Sistema de Cuentas Nacionales de México 2003]]></source>
<year>2008</year>
</nlm-citation>
</ref>
<ref id="B21">
<nlm-citation citation-type="">
<collab>INEGI</collab>
<source><![CDATA[Sistema de Cuentas Nacionales de México. Cuentas de Bienes y Servicios: Metodología]]></source>
<year></year>
</nlm-citation>
</ref>
<ref id="B22">
<nlm-citation citation-type="book">
<person-group person-group-type="author">
<name>
<surname><![CDATA[Jorgenson]]></surname>
<given-names><![CDATA[D.]]></given-names>
</name>
<name>
<surname><![CDATA[Aghion]]></surname>
<given-names><![CDATA[Philippe]]></given-names>
</name>
<name>
<surname><![CDATA[Durlauf]]></surname>
<given-names><![CDATA[Steven]]></given-names>
</name>
</person-group>
<source><![CDATA["Accounting for growth in the information age": Handbook of Economic Growth]]></source>
<year>2005</year>
<publisher-name><![CDATA[Elsevier]]></publisher-name>
</nlm-citation>
</ref>
<ref id="B23">
<nlm-citation citation-type="book">
<person-group person-group-type="author">
<name>
<surname><![CDATA[Lau]]></surname>
<given-names><![CDATA[L. J.]]></given-names>
</name>
<name>
<surname><![CDATA[Park]]></surname>
<given-names><![CDATA[J.]]></given-names>
</name>
</person-group>
<source><![CDATA["The sources of East Asian economic growth revisited"]]></source>
<year>2003</year>
<publisher-name><![CDATA[Stanford University]]></publisher-name>
</nlm-citation>
</ref>
<ref id="B24">
<nlm-citation citation-type="journal">
<person-group person-group-type="author">
<name>
<surname><![CDATA[Moore]]></surname>
<given-names><![CDATA[G. E.]]></given-names>
</name>
</person-group>
<article-title xml:lang="en"><![CDATA["Cramming more components onto integrated circuits"]]></article-title>
<source><![CDATA[Electronics]]></source>
<year>1965</year>
<volume>38</volume>
<numero>8</numero>
<issue>8</issue>
<page-range>114-7</page-range></nlm-citation>
</ref>
<ref id="B25">
<nlm-citation citation-type="book">
<person-group person-group-type="author">
<name>
<surname><![CDATA[Moore]]></surname>
<given-names><![CDATA[G. E.]]></given-names>
</name>
</person-group>
<source><![CDATA["An Update on Moore's Law"]]></source>
<year>1997</year>
<publisher-name><![CDATA[Intel Corporation]]></publisher-name>
</nlm-citation>
</ref>
<ref id="B26">
<nlm-citation citation-type="book">
<collab>OECD</collab>
<source><![CDATA[The Economic Impact of ICT: Measurement, Evidence and Implications]]></source>
<year>2004</year>
<publisher-name><![CDATA[OECD]]></publisher-name>
</nlm-citation>
</ref>
<ref id="B27">
<nlm-citation citation-type="journal">
<person-group person-group-type="author">
<name>
<surname><![CDATA[Oliner]]></surname>
<given-names><![CDATA[S. D.]]></given-names>
</name>
<name>
<surname><![CDATA[Sichel]]></surname>
<given-names><![CDATA[D. E.]]></given-names>
</name>
</person-group>
<article-title xml:lang="en"><![CDATA["Computers and output growth revisited: How big is the puzzle?"]]></article-title>
<source><![CDATA[Brookings Papers on Economic Activity]]></source>
<year>1994</year>
<volume>2</volume>
<page-range>273-334</page-range></nlm-citation>
</ref>
<ref id="B28">
<nlm-citation citation-type="">
<collab>ONU</collab>
<source><![CDATA[Sistema de Cuentas Nacionales 1993]]></source>
<year>1993</year>
</nlm-citation>
</ref>
<ref id="B29">
<nlm-citation citation-type="book">
<person-group person-group-type="author">
<name>
<surname><![CDATA[Pilat]]></surname>
<given-names><![CDATA[D.]]></given-names>
</name>
<name>
<surname><![CDATA[Devlin]]></surname>
<given-names><![CDATA[A.]]></given-names>
</name>
</person-group>
<source><![CDATA["The diffusion of ICT in OECD economies": The Economic Impact of ICT: Measurement, Evidence and Implications]]></source>
<year>2004</year>
<publisher-name><![CDATA[OECD]]></publisher-name>
</nlm-citation>
</ref>
<ref id="B30">
<nlm-citation citation-type="book">
<person-group person-group-type="author">
<name>
<surname><![CDATA[Schreyer]]></surname>
<given-names><![CDATA[P.]]></given-names>
</name>
</person-group>
<source><![CDATA["Computer price indexes and international growth and productivity comparisons"]]></source>
<year>2001</year>
<publisher-name><![CDATA[OECD]]></publisher-name>
</nlm-citation>
</ref>
<ref id="B31">
<nlm-citation citation-type="journal">
<person-group person-group-type="author">
<name>
<surname><![CDATA[Sichel]]></surname>
<given-names><![CDATA[D. E.]]></given-names>
</name>
</person-group>
<article-title xml:lang="en"><![CDATA["Computers and aggregate economic growth: an update"]]></article-title>
<source><![CDATA[Business Economics]]></source>
<year>1999</year>
<page-range>18-24</page-range></nlm-citation>
</ref>
<ref id="B32">
<nlm-citation citation-type="journal">
<person-group person-group-type="author">
<name>
<surname><![CDATA[Solow]]></surname>
<given-names><![CDATA[R. M.]]></given-names>
</name>
</person-group>
<article-title xml:lang="en"><![CDATA["We'd better watch out"]]></article-title>
<source><![CDATA[New York Times]]></source>
<year>1987</year>
<page-range>36</page-range></nlm-citation>
</ref>
<ref id="B33">
<nlm-citation citation-type="book">
<person-group person-group-type="author">
<name>
<surname><![CDATA[Triplett]]></surname>
<given-names><![CDATA[J. E.]]></given-names>
</name>
</person-group>
<source><![CDATA["IT, hedonic price indexes, and productivity"]]></source>
<year>2001</year>
<publisher-name><![CDATA[The Brookings Institution]]></publisher-name>
</nlm-citation>
</ref>
<ref id="B34">
<nlm-citation citation-type="book">
<person-group person-group-type="author">
<name>
<surname><![CDATA[Triplett]]></surname>
<given-names><![CDATA[J. E.]]></given-names>
</name>
</person-group>
<source><![CDATA[Handbook on Hedonic Indexes and Quality Adjustments in Price Indexes: Special Application to Information Technology Products]]></source>
<year>2006</year>
<publisher-name><![CDATA[OECD]]></publisher-name>
</nlm-citation>
</ref>
<ref id="B35">
<nlm-citation citation-type="book">
<person-group person-group-type="author">
<name>
<surname><![CDATA[Wasshausen]]></surname>
<given-names><![CDATA[D.]]></given-names>
</name>
<name>
<surname><![CDATA[Moulton]]></surname>
<given-names><![CDATA[B. R.]]></given-names>
</name>
</person-group>
<source><![CDATA["The role of hedonic methods in measuring real GDP in the United States": Are We Measuring Productivity Correctly?]]></source>
<year>2006</year>
<publisher-name><![CDATA[EUROSTAT]]></publisher-name>
</nlm-citation>
</ref>
<ref id="B36">
<nlm-citation citation-type="journal">
<person-group person-group-type="author">
<name>
<surname><![CDATA[Wyckoff]]></surname>
<given-names><![CDATA[A. W.]]></given-names>
</name>
</person-group>
<article-title xml:lang="en"><![CDATA["The impact of computers prices on international comparison of labour productivity"]]></article-title>
<source><![CDATA[Economics of Innovation and New Technology]]></source>
<year>1995</year>
<volume>3</volume>
<page-range>277-293</page-range></nlm-citation>
</ref>
</ref-list>
</back>
</article>