Numerical simulation of 226Ra migration and decay in a saturated porous medium
Simulación numérica de la migración y decaimiento de 226Ra en un medio poroso saturado
Eduardo DE LA CRUZ1, Roberto GONZALEZ1,2, Jaime KLAPP1, Luis Carlos LONGORIA1, Estela MAYORAL1 and Ricardo DUARTE
1 Instituto Nacional de Investigaciones Nucleares, Carretera México–Toluca s/n, La Marquesa, Ocoyoacac 52750, Estado de México, México. Correo electrónico: eduardo.delacruz@inin.gob.mx
2 Facultad de Ciencias, Universidad Autónoma del Estado de México, El Cerrillo Piedras Blancas 50200, Estado de México, México.
]]>Recibido junio 2010
Aceptado mayo 2011
ABSTRACT
Numerical simulation of transport and radioactive decay of 226Ra as a constant product of 238U decay from a simulated storage facility containing uranium tailings is presented in this work. The simulation domain consists of six subsoil layers through which one of the uranium daughters 226Ra is migrating as well as decaying. The methodology consists in first calculating the 226Ra velocity field through the computational domain by solving the momentum and mass conservation equation using Darcy´s Law. The transport equation is then solved to obtain the extent of the contaminant´s migration. The solution is obtained with the finite–element method. Results showed that the estimated 226Ra migration time through 200 meters of soil was about five hundred years.
Key words: Simulation, soil pollution, transport, porous medium.
RESUMEN
En este trabajo se presenta una simulación numérica de la migración y del decaimiento de 226Ra como un producto constante del decaimiento del 238U a través del subsuelo de un almacén modelado que contiene jales de uranio. El dominio de simulación para modelar el transporte de 226Ra consiste en seis diferentes capas de tierra a través de las cuales los productos del 226Ra van migrando y decayendo. La metodología calcula el campo de velocidades por medio de la ecuación de momento y de conservación de masa usando la ley de Darcy. Posteriormente se utiliza este resultado para resolver la ecuación de transporte. La solución es obtenida con el método de elementos finitos. Los resultados muestran que el tiempo estimado de migración del 226Ra a lo largo de 200 metros de tierra fue de alrededor de 500 años.
]]> Palabras clave: simulación, contaminación de suelo, transporte, medio poroso.
INTRODUCTION
Soil contamination due to natural and anthropogenic pollutants is a global problem.
Soil pollution produces physical, chemical and biological imbalances affecting living beings.
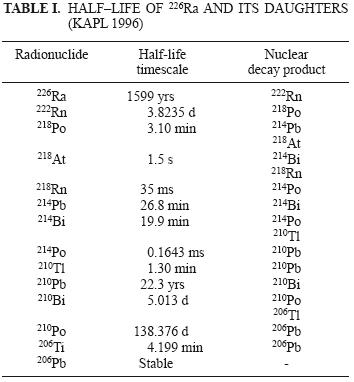
Radioactive contaminants receive special attention due to their radiotoxicity and decay time. The decay of a radioactive element is a physical constant which is generally defined as the half life, which is the time it takes for the mass fraction of a given radionuclide to be reduced by a half.
Table I shows the 226Ra radioactive decay chain and the half life of the various radionuclides involved.
This work is focused on the 226Ra radionuclide as a product of 228U decay. The 226Ra isotope is the most important uranium daughter in soil migration studies because it is the longest lived element and therefore is the most common nuclide in uranium tailings.
]]> One of the greatest risks of soil contamination is that solid pollutants reach underground water. As an example, it is known that one Curie of 90Sr dissolved in water could affect about 1000 liters of water making it unacceptable for public drinking (Stanley 1966).Numerical simulation is a very powerful tool to understand the solute migration phenomena as it is necessary to predict processes for hundreds of years. This work is concerned with the modeling of a contaminant migration and decay through a porous saturated stratum. The hydrogeological conditions considered for the modeling correspond to those typically found in the north of México.
A differential equation system representing this problem taking into consideration the boundaries and initial conditions was established. The equations of the system were solved using the finite element method. The software used for this purpose was COMSOL.
Results show that the evolution of a 226Ra radioactive plume exhibits a bell shape when a source of contaminant is released in a finite time. A similar behavior could be found in the literature for a chemical agent dispersed in a porous media (Goltz 1986).
METHODOLOGY
Two approaches for simulating the solute migration are considered; the first one defines the solid matrix of the underground soil layers and then the laws of hydrodynamics are applied. In this case the simulated area is very small but large enough to consider pores as channels. In this case, it is difficult to represent both, the variation of hydrodynamic properties of the media space, and the definition of the same solid matrix of the porous media.
The second approach, also called Darcy´s law, introduces a macroscopic concept that takes into account hydrodynamic properties that depends on the morphology and constitution of the medium. The flow of the fluid is considered to be a continuous process introducing an average value of the physical properties that characterize the porous media. These soil properties are considered into the Darcy´s equation and other flow equations giving a very good estimate of the phenomenon over small and large dimensions.
The simulated diffusion of the contaminant dissolved in water flowing through the underground is based on the velocity field as the fluid migrates through the stratum.
Transport and diffusion of the contaminant in the subsoil is a three step process: 1) Molecular diffusion and hydrodynamic scattering are considered together as a hydrodynamic dispersion. Molecular diffusion is determined by the contaminant concentration gradients and considers longitudinal and transverse flows (Sudicky 1989), 2) Transport due to "drag" of contaminant particles in underground water, and 3) Radioactive decay.
]]> The groundwater flow and solute transport equations are coupled to Darcy´s diffusion formalism which assumes that the diffusion velocity is u= –k H, where k is the permeability and H the hydraulic head. The velocity u is the fluid flow velocity from an infinitesimal surface that represents both the solid and the pore spaces. We first calculate the Darcy velocity field u=(u,w), where u and w are the velocities in the × and z directions, respectively. Then, assuming that the contaminant follows the previously obtained velocity field, the contaminant transport equation coupled to the nuclear isotope decay equation for the 226Ra chain is solved.
 According to Darcy, the fluid specific discharge rate through a porous material is proportional to the hydraulic head loss and is given by the equation (Fetter 1994):

where R is the water flow rate [m/s].
Solute transport typically is a time–dependent equation, and is described by the equation

where θS is the porosity, DL the hydrodynamic dispersion tensor [m²/s], C the dissolved concentration [kg/m³], u the Darcy´s speed [m/d], t the time [s], and λ the radioactive decay rate [s–1].
The dispersion represents the solute spreading by mechanical mixing and molecular diffusion. The equations for the tensor entries are (Zheng and Wang 1998)
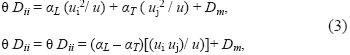
where θDii are the principal components of the dispersion tensor based on the Darcy´s velocity, θDij and θDji are the cross terms of the dispersion tensor, the subscript "L" denotes longitudinal dispersivity, "T" the transverse dispersivity, u = (ui2+uj2)1/2 is the magnitude of the Darcy´s velocity vector, and Dm represents the effective molecular diffusion in a saturated porous media.
]]> The 226Ra decay chain is shown in Table I. The disintegration rate is proportional to the number of nuclei present in the sample:
where N is the number of nuclei of the radioactive species present at time t, and, λ226 = ln2/1599 (yrs–1) for the 226Ra  222Rn decay.
In this work is assumed that 226Ra decays directly to the stable isotope 206Pb, because all half–life timescales from 222Rn to 206Ti are much shorter than for 226Ra (see Table I).
THE INPUT MODEL
Figure 1 shows the configuration of the simulated system having hydrogeological conditions similar to those found in the north of México. The dimensions of the simulated domain are 80 m wide and a depth of 200 m.
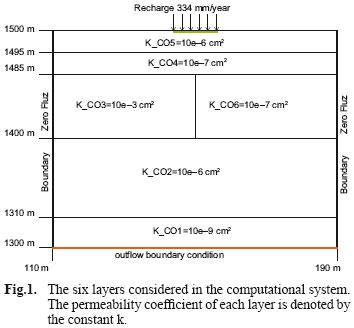
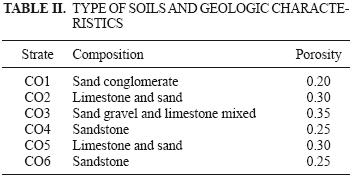
The domain is constituted of six horizontal layers with different characteristics. The top layer is denoted as K_CO5 which corresponds to the surface soil layer. This is the layer where the 226Ra is entering into the system and then filters to groundwater layers. The inflow velocity of 334.4 mm/year represents the rainfall per unit time in this site.
]]> For the present simulation a saturated medium is considered; the fluid is a combination of water and dissolved contaminant, assumed not reactive and homogeneous.The lithology of the system was characterized by different porosities for each layer within a range of 0.20 to 0.35, permeability between 10–9 to 10–6 cm2, a molecular diffusion coefficient of 1.34 × 10⁻⁹ m2/s, a transverse dispersivity of 5 mm and a longitudinal dispersivity equal to 0.5 m as shown in Fig. 1 and table II.
The left and right boundaries along the z–direction are located at x=110 m and x=190 m, respectively, where we impose the following Neumann zero flow condition:

where n is a unit vector normal to the boundary. This boundary condition implies that at the boundary the velocity is parallel to the boundary and that the x–component of the velocity is zero, i.e. there is no fluid flow across the left and right boundaries.
From the top boundary (z=1500 m) water flows into the system at a rate of 334 mm/year; an inflow boundary condition that satisfies the Neumann condition is assumed and is written in the form

The top boundary condition for the hydraulic head corresponds to the Dirichlet condition
]]>
where H0 is the barometric hydraulic head.
In the bottom boundary (z=1300 m), an outflow boundary condition was imposed, assuming the derivatives of the variables that characterize the fluid are zero at the boundary.
For the transport equation, the initial and boundary conditions are given by Eqs. (8) to (11). In this work it is also assumed that the contaminant source is continuous over a period of fifty years and zero after this time. The solute transport condition for the top boundary is

where C0 is the concentration of 226Ra that enters the system and has two values along of simulation: a) C0 = 1 × 10⁻⁶ kg/m3 for 0 < t < 50 years and C0 = 0 for t > 50 years. C0 indicates that a small amount of fluid (water + radionuclide) is injected to the system with a hydraulic recharge rate of 334.4 mm/year (product rain) from the time t=0 to t= 50 years, i.e. the injection of 226Ra only occurs during the first fifty years, and afterwards the source is removed.
Equation (8) is applied only in the border segment 140 < × < 160 meters (see Fig. 1); for the rest of the border the Neumann condition C(x,h,t) = 0 is applied.
The Dirichlet condition on the right and left boundaries is

The Neumann condition defines the zero flow boundaries:
]]>
Finally, the initial condition indicating that the subsoil on the site is free of contaminants at the beginning of the simulation is

The initial concentration is zero elsewhere.
RESULTS AND DISCUSSION
Diffusion simulations of a contaminant dissolved in water flowing through the underground implies at least two types of physical analysis. For this case the hydro geological context is first solved, then using the velocity field, the behavior of the fluid through the stratum is simulated.
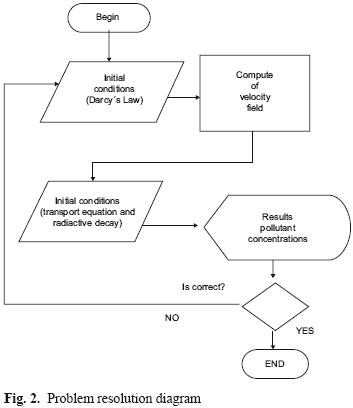
The methodology consists in first calculating the 226Ra velocity field through the computational domain by solving the momentum and mass conservation equation using Darcy´s Law. Then we solve the contaminant transport equation by the procedure shown in figure 2, see below.
It was also found that pressure and velocity achieves a steady state after a lapse of about two thousand years.
The top and bottom panels of figure 3 show a similar pattern for the velocity and pressure distributions at two different times. It can be seen that the fluid lines follows a pattern due to the pressure distribution and that the pressure depends on the hydrogeological characteristics of each layer; for example, the fluid velocity is faster in the K_CO3 layer due to the hydraulic high permeability assigned to this layer. This causes the pressure to increase on the right side of the system, specifically in the K_CO6 stratum.
Figure 4 shows the evolution of the 226Ra plume as a function of time. The contaminant (226Ra) enters through a segment of the upper boundary of stratum K_CO5 for 140 < × < 160 meters, and t=0 to t=50 years. It can be seen that the 226Ra is seeping through underground layers.
In the same figure 4 we show the amount of contaminant concentration in each point. Colors indicate the 226Ra concentration degree. Red indicates a more intense concentration.
The concentration varies due to advection, diffusion, and additionally, suffers the effects of radioactive decay along its path.
Figure 4 (from top to bottom) shows that the flow is going towards the left boundary, but it is reversed as a result of the velocity boundary condition which requires that the x–component of the velocity at the boundary be zero.
The remaining evolution of the contaminant is shown in the lower panels of figure 4; the fluid "follows" jagged lines and widens in the x–direction.
Figure 5 shows the evolution of the contaminant concentration versus time at x=165, z=1300, which is located in the lower boundary of the system. It can be seen that the concentration of the contaminant at this point increases gradually with time until reaching a maximum at approximately 2.3 × 10¹⁰ seconds (729 years) and then decreases exponentially. The enlargement of the plot (bottom panel of Fig. 5), allows us to obtain a particular time estimated when the contaminant concentration reaches a significant value in the lower boundary of the system. The estimated value is 1.6 × 10¹⁰ seconds, which is equivalent to 507 years.
For the first fifty years the 226Ra concentration keeps increasing because this time is much shorter that the 226Ra half–life timescale. After this time the 226Ra composition decays to zero. As mentioned before, all half–life timescales from 222Rn to 206Ti are much shorter than for 226Ra (see Table I), and thus in the timescale of figure 5, the final product is the stable isotope 206Pb.
]]>CONCLUSIONS
The migration and decay of a contaminant in soil of the type found in the North of México has been simulated, allowing a better understanding of its underground behavior. The time required by the contaminant to reach the bottom of the lower stratum was estimated to be about five hundred years.
The particular flow obtained in the numerical simulation is due to the soil characteristics of the layers and the pressure distribution in the system.
Hydrogeological computer simulation studies will enable to assess not only the long time behavior of the contaminants, usually impossible to recreate by experiment, but also to evaluate the migration routes of radionuclides dissolved in water through the underground.
The model allows the estimation of the transport time, the dissolved contaminants concentration and their eventual arrival in aquifers with consequent contamination. Furthermore, the 226Ra concentration curves follow a pattern similar to that reported in a field–scale experiment of the migration of contaminants through a porous medium.
The numerical simulation presented in this work has captured the basic physical mechanism of the migration and decay of a contaminant as it moves through an underground porous medium. It is feasible to apply similar studies to assess the suitability of places for containment of contaminants as well as to identify factors that determine the amount of runoff water that could carry the contaminant, and characterize the hydraulic operation of water tanks or fluids.
REFERENCES
Fetter C.W. (1994). Applied Hydro–geology. Prentice–Hall. [ Links ]
Goltz M.N. and Roberts P.V. (1986). Interpreting organic solute transport data from a field experiment using physical nonequilibrium models. J. Contam. Hydrol. 1, 77–93. [ Links ]
KAPL (1996). Chart of the Nuclides, Fifteenth edition. Knolls Atomic Power Laboratory and Lockheed Martin Company. [ Links ]
Stanley N.D. (1966) Hydrogeology. Wiley, New York, 464 pp. [ Links ]
Sudicky E. A. (1989). The Laplace transform Galerkin technique: application to mass transport in groundwater. Water Resour. Res. 25, 1833–1846. [ Links ]
Zheng C. and Wang P. (1998). MT3DMS: A modular three–dimensional multispecies transport model for simulation of advection, dispersion and chemical reactions of contaminants in groundwater systems. University of Alabama, 239 p. [ Links ]
]]>