
Índice de desempeño de inversiones de ciclo de vida para los fondos de pensiones en México
Óscar V. De la Torre Torres,** Evaristo Galeana Figueroa*** y Dora Aguilasocho Montoya****
** Full-time research professor of Facultad de Contaduría y Ciencias Administrativas, Universidad Michoacana de San Nicolás de Hidalgo. E-mail: oscar.delatorre.torres@gmail.com. The autor wants to thank Consejo Nacional de Ciencia y Tecnología by the financial support given with the research progam Apoyos Complementarios para la Consolidación Institucional de Grupos de Investigación 2012.
*** Full-time research profesor and head of the División de Estudios de Posgrado, Facultad de Contaduría y Ciencias Administrativas, Universidad Michoacana de San Nicolás de Hidalgo. E-mail: e_galeana@hotmail.com.
**** Full-time research professor of Facultad de Contaduría y Ciencias Administrativas, Universidad Michoacana de San Nicolás de Hidalgo. E-mail: amontoya@umich.mx.
]]>* Fecha de recepción: 14/08/2013.
Fecha de aprobación: 26/06/2015.
Abstract
The present paper proposes the use of a life cycle investment benchmark (called actual position benchmark or APB) in the asset types allowed in the CONSAR rules for Mexican pension funds (Siefores). Its mean-variance efficiency is tested against the equally weighted, the minimum variance and max Sharpe ratio (MSR) portfolios with a daily backtest from April 2008 to April 2013 and a 10-year daily Monte Carlo simulation. The results suggest that even though the msr portfolio gives the highest accumulated return, the APB is an acceptable benchmark by its stable and statistically equal Sharpe ratio, its max drawdown behavior, and its statistically equal return against the former.
Keywords: simulation modeling, portfolio management, international financial markets, financial forecasting and simulation, pension funds.
JEL classification: C63, G11, G15, G17, G23.
Resumen
]]> Se propone utilizar y prueba la eficiencia media-varianza de un índice de desempeño de inversiones de ciclo de vida denominado actual position benchmark (APB) para medir el comportamiento de la política de inversión de fondos de pensiones mexicanos (Siefores) autorizada por la CONSAR. Este índice es probado contra un portafolio de ponderaciones homogéneas, con la mínima varianza y que presenta el mayor índice de Sharpe (MSR). Para ello, se utilizó un backtest de abril de 2008 a abril de 2013 y una simulación Monte Carlo a diez años. Los resultados sugieren que, pese a que el MSR presenta mayor retorno acumulado, el APB es una referencia recomendable por sus niveles estadísticamente iguales de índice de Sharpe, su máxima pérdida potencial y la igualdad estadística de su retorno.Palabras clave: modelos de simulación, administración de portafolios, mercados financieros internacionales, pronóstico y simulación financiera, fondos de pensiones.
Clasificación JEL: C63, G11, G15, G17, G23.
Introduction
Among the most common pension fund schemes, the Mexican pension funds use either Defined Benefit (DB) or a mixture of DB and Defined Contribution (DC) ones. The first scheme is widely used with universities or public employees and the second one is applied to all the private employees that don't work either for the Government, the Army or a public university. The mixture scheme is the biggest pension fund plan in Mexico based on the fact that almost all the active workers in Mexico contribute to this sort of plan known in Mexico as Afores,1 a group of private investment management firms that invest all the pension savings2 through public mutual funds known as Siefores. At June 30, 2013, this sort of pension fund managed about MXN 2.8 trillion in savings, being one of the most influential institutional investor in Mexico along with investment banks and foreign investors. Despite the fact that these pension funds are very influential, there is no public benchmark that measures their performance.
Among the possible solutions to this issue, a market cap benchmark could be developed with the value of all the Siefores in Mexico. Unfortunately, the fusion among Siefores and the creation of new ones could lead to an unstable benchmark-weighting scheme, an issue that could lead to a high trade turnover. As will be discussed later, this weighting method has some theoretical and practical issues to consider.
As mentioned earlier, there are other sorts of public and private pension fund plans in Mexico and their investment Policy Statement3 (henceforth IPS) follows the actuary's study and their own pension plan. Therefore an investable and public strategy benchmark for the measurement of the IPS used in almost all the pension funds in Mexico is needed based on the fact that even though a Siefore or a private pension fund creates its own authorized IPS and strategy benchmarks, a public strategy benchmark is necessary to measure the performance of the investments in a given pension fund. Several studies stress the need of a market or public benchmark in order to determine the quality of the strategy benchmark. Cases such as Bailey (1992) or Kuenzi (2003) propose several criteria to test a benchmark, and even though these studies focus in equity market benchmarks, they could be extended to other sorts of financial markets or even to asset allocation benchmarks.
Following this need of a public strategy or market benchmark, it is noted that there are no public asset allocation market benchmarks in Mexico and, more importantly, there are no benchmarks that model the IPS authorized by the Comisión Nacional del Sistema de Ahorro para el Retiro4 (CONSAR, 2012). For this reason and by following the S&P (2012) target date benchmark methodology, we could venture a beginning solution to this problem by introducing an actual position benchmark (hereafter APB). This could be used to measure the performance of all the Siefores in Mexico and also other db pension funds that want to use the IPS allowed in the aforementioned CONSAR's investment rules.
As will be proven, this APB is a solution to this need and to the theoretical and practical drawbacks of the market cap-weighing method. As a numerical example, this benchmark is tested against several hypothetical portfolios such as the equally weighted, the minimum variance and the max Sharpe ratio (MSR) portfolios. This is so by following Goltz et al (2011) and Amencet al (2012), who suggest the use of these alternative "smart beta" weighting schemes for the calculation of market or strategy benchmarks in a portfolio.
]]> With this aim in mind, the present paper will prove the usefulness of the APB by testing the hypothesis that "this benchmark gives an accumulated return and a mean-variance efficiency statistically equal to the observed in the MSR portfolio" (our main theoretical reference). With this hypothesis, the paper starts with a bibliographical review of previous research that supports the statement that a non market value weighting scheme should be used and that shows the importance of the mean-variance efficiency of the "market portfolio proxy". After this, the proposal of the APB methodology is presented, followed by the numerical test (a back test and a Monte Carlo simulation) that will prove our hypothesis. Following the empirical part, we discuss the results and we make a review of some practical and theoretical implications for Mexico compared with other countries in Latin America such as Colombia. In this part we discuss the strengths and drawbacks of the present paper and we suggest some guidelines for further research. Finally, in a last part, we present the general conclusions and summarize the aforementioned guidelines for research and pension fund management recommendations.
I. Literature review
Thanks to Ibbotson's (2010) research it is widely accepted that the asset allocation step is the most influential part in the portfolio management process. Along with this, the use of a proper strategy benchmark either to quantify the IPS or to use it as a passive management reference is the most sensitive choice.5 So important is this benchmark that several optimal selection models or heuristics use it. Modern portfolio theory models, such as Treynor & Black (1973), need it as a key part of their procedure. Recent proposals, such the Bayesian model of Black and Litterman (1992) or the Asset-Liability case of Waring and Withney (2009) also need a proper strategy benchmark to determine the optimal portfolio.
No general rules exist to determine this strategy benchmark. As we mentioned before, Bailey (1992) and Kuenzi (2003) suggest some criteria to determine the appropriateness of the benchmark but these two papers depart from the fact that an acceptable market benchmark exists to measure its quality. In the case of Mexico there are no public cross-asset market benchmarks that model the joint behavior of fixed income, equity and commodities markets either in Mexico or abroad, i.e. there is no market benchmark that the Siefores or the pension funds could use to see how their IPS are performing. Based on this fact, developing and proposing the use of a cross-asset market benchmark with a market cap weighting method is a natural option by using the market types authorized by CONSAR (2012). Despite the fact that this is a generally accepted method, there are several theoretical and practical drawbacks that suggest the use of another weighting scheme either for the market or the strategy benchmark. One of these drawbacks is that there is no public market cap data for fixed income benchmarks in Mexico.6 Therefore, the present paper will focus on a proper strategy weighting method with the absence of a market benchmark.7
To strengthen this position of not using a market cap method, it is necessary to mention that the use of market cap benchmarks is supported by the first critiques made by Roll (1977) to the CAMP reviews. In his paper, Roll observes that sometimes the CAMP does not pass the tests because the market portfolio proxy is not mean-variance efficient, i.e. it does not belong to the efficient portfolio set or frontier. Since the real market portfolio is a theoretical concept that is not known, Roll concludes that market value indexes, such as the S&P 500 are appropriate and efficient proxies. This has been widely accepted but recent research suggests the opposite. Among the first reviews, Grinold (1989) stresses the weakness of the market cap benchmark by using the Ross and Shanken (1989) statistic, a likelihood statistic similar to the one proposed by Kandel and Stambaugh (1989). Following Grinold, Haugen and Baker (1990) question the efficiency of the Wilshire 5 000 Index, an equity market cap benchmark widely used by pension funds in the US. To test this index, they created random portfolios and also calculated the Sharpe ratio of this index and two theoretical references in the efficient frontier: the max Sharpe ratio and the min variance portfolios. They found that even if the market is weak in informational efficiency,8 the Wilshire 5000 is not mean-variance efficient against the other portfolios. This is so based on the fact that (in Haugen's and Backer's words) "investors have heterogeneous expectations9 and different tax regimes".
They also attribute this to the participation of international investors that follow either a home bias in their asset allocation or just a sample risk diversification goal. As a potential answer to these reviews, Tabner (2007) tested an equally weighted version of the FTSE-100 index and showed that this portfolio leads to higher risk exposures than the market cap FTSE-100, suggesting that the latter is a more suitable market benchmark.
Despite this study and regarding the market cap method's inefficiency, Goltz and Lesourd (2011) state that even if the market portfolio is known, this cannot be efficient based on the fact that the real market portfolio must include all the asset types that represent the wealth of an Economy. According to Goltz and Lesourd, the market portfolio should include Human Capital, Art, and some other assets that are not widely known or used by all the investors. Following this, the market portfolio cannot be efficient and, contrary to Roll's statement; they observe that other sort of market benchmarks should be used. As a potential answer, Goltz (2012) suggests that alternative weighting schemes should be considered. He proposes to use max Sharpe ratio or min variance benchmarks instead of the traditional market cap indexes. Also, Amenc et al (2012) show that the proper benchmark should be a linear combination of the min variance and max Sharpe ratio portfolios.
Almost all this research about the efficiency of a market portfolio proxy and the market cap weighing scheme is focused in the equity market, but, despite this situation, alternative benchmark weighting schemes can be used in cross-asset benchmark such as the one proposed in this paper. Once that the market cap method is shown inappropriate to develop a Mexican pension fund strategy or performance benchmark and remembering that there is no public market cap data for Mexican fixed income markets, another weighting scheme should be used.
]]> II. The actual position target benchmark weighing method
By the aforementioned limitations, several approaches were considered, departing from the fact that, contrary to other OECD and Latin American countries, such as Uruguay or Colombia, the Mexican case with the CONSAR investment regime is a life cycle one that follows a sort of "retirement target date" investment strategy. This is done by grouping the savings of an individual worker in each type of Siefore (mutual fund) given her age and time to retirement.10 By also departing from the fact that CONSAR publishes the end of month actual asset-type holdings of all the Siefores in Mexico (CONSAR, 2013), a potential solution to the market strategy benchmark has been found with the S&P (2012) target date benchmark methodology.
In the US, there is a sort of mutual fund known as target date benchmarks. These are investment vehicles for the defined contribution pension funds (usually 401k plans) and their investment policy is focused in a future target date. These funds are an investment option for those pension plans where the beneficiary is going to retire in certain target year (at least close to that year). As an example, think of a person that will retire in 2021. This investor should buy stocks of a 2020 target date fund with the money of her 401k plan.
In a similar fashion the Mexican government deposits the monthly savings of workers in a personal Afore.11
Because there are several target dates, S&P has already developed the target date benchmarks in order to measure the performance of this sort of funds. To calculate them, S&P applies an end of year poll where it creates groups of target date funds that will settle in 2020, 2030 and so forth. With this poll, S&P determines the asset type holding in each target date fund and uses this value (on a daily basis) as the weight of this sort of asset in the benchmark.
By the practical usefulness of this methodology and by observing that the actual holdings12 of the Siefores are the execution of their IPS allowed by the CONSAR investment rules, the use of a benchmark, named actual position benchmark (APB), that uses the aforementioned S&P methodology, arises as a natural option for the weighting method in a benchmark, either to quantify the allowed IPS or to measure the performance of the Siefores and other sort of pension funds that want to use the CONSAR (2012) investment rules.13 Therefore, by defining wi,T as the actual weight in the i-th asset for t in month T and Mi,T as the actual value14 of the market benchmark in the i-th asset, the value at t of the APB is given by the next expression:
As an example, consider that t = April,13 . Therefore T = March, 30 and wi,t would be the investment level or asset type holding at the end of March to be used in April. Also Mi,t would be the value of the market index of the i-th asset in April 13. As a methodological note previous to the empirical tests in the present paper, this Mexican pension fund benchmark is calculated in an April 1st, 2013 base 100 value. Now that we have presented the need of a public performance benchmark and once that we have exposed the weighting and calculation method to be used, we will test the usefulness of this APB next.
III. Testing the usefulness of the actual position benchmark methodology
]]> In order to make an empirical test of the APB, the asset types, investment policy and benchmarks in Chart 1 are used. The present paper's max and min investment levels are used to attain the efficient set frontier or efficient set by solving a Quadratic program with the equity, commodities and fx risk min and max investment levels. These levels come from a weighted average of the cardinality restrictions for each type of Siefore given by CONSAR (2012).
 In order to test the usefulness of the APB, two theoretical portfolios from the efficient portfolios set () are selected. The first is the min variance portfolio determined with the next expression:

The second portfolio is attained with the Max Sharpe (1966) ratio level (MSR):

The MSR portfolio given in (3) is our theoretical reference and will be our "efficient" reference, given the investment level restrictions in Chart 1. In order to test the robustness of our results, we will also use (2) by following Haugen and Baker (1990), Goltz (2012) and Amenc et al (2012). Finally, the APB is also tested against a common "naïve" reference given by the equally weighted portfolio.
With the APB, and the aforementioned portfolios, a backtest from April 1st 2008 to June 30th 2013 is performed in order to create an ex post time series of the simulated indexes. To simulate the future behavior of the APB and the three theoretical references, a ten year forward daily Monte Carlo simulation is performed with 10 000 scenarios by assuming that the six indexes presented in Chart 1 follow a multivariate Geometric Brownian motion. This is so because almost all the benchmarks (with the exception of the IPC and the DJ-UBS) are total return indexes.
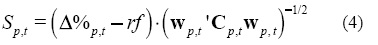
In the back test, a daily-observed Sharpe ratio is calculated with (4) in order to measure the mean-variance efficiency in each portfolio. Contrary to Srinivas and Yermo (1999); Jara, Gómez and Pardo (2005); Jara (2006), and García and Moreno (2011) for the Colombian case, we will not test if our benchmark and the Siefores are in the geometric locus of an efficient portfolio set (efficient frontier). We will neither test if our proposed benchmark is also in that set, by following the comments of Roll's (1977) critique: "if a market portfolio exists, it could possibly not be efficient". Based on the fact that even if a market portfolio does not lie in the efficient frontier, we could have a portfolio close to the max Sharpe portfolio (the tangent portfolio, given a capital allocation line). So, if we calculate (4) in our benchmark and the simulated portfolios, given CONSAR's investment level or cardinality restrictions,15 a natural proof is to test if our simulated index has a statistically equal Sharpe ratio value in our ex post simulations.16
Finally, a Max drawdown test is performed by counting (in each simulated portfolio) the number of days with a percentage variation of less than -5%. This count is compared with a Poisson 95% confidence parameter for an incidence of 10% in 1 280 days of the back test or ex post simulation (/95%,1280*10% = 143). With these results, an accumulated return, Sharpe ratio, and max drawdown comparison are made. To calculate the covariance matrix Cp,t in (4), a t-250 days17 time series is used in each t day in each market index and the simulations are made in MATLAB with data from Bloomberg, VALMER -Standard & Poors and Economatica.18
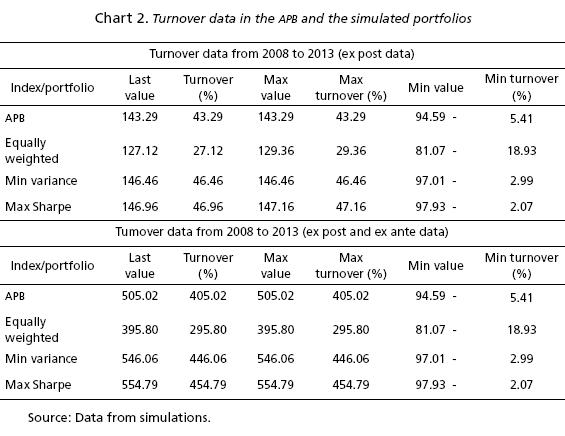
]]> 1. Empirical results: the APB turnoverGraph 1 shows the entire turnover, from an April 1, 2008 base 100 value19, of the APB and the three simulated portfolios. The results are summarized in Chart 2 and, as expected, the MSR portfolio is the one with the highest accumulated return either in the backtest (or ex post data) or in the entire simulation. The APB follows this portfolio and the min variance one with a turnover of 43.28% in the backtest and 405.02% in the entire simulation.
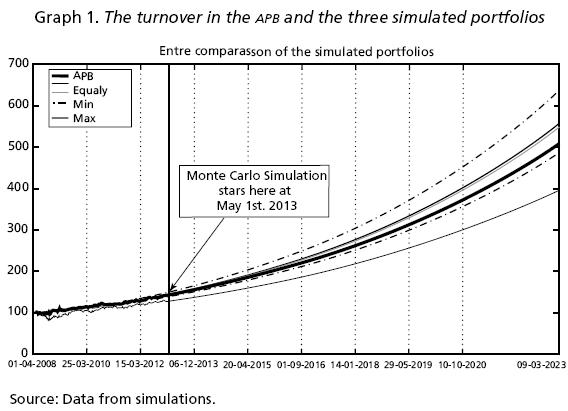
Following Graph 1, in the case of the Max Sharpe ratio portfolio, a non-parametric 90% confidence interval (dotted line) is shown with the values of the fifth and 95th percentile of the 10 000 scenarios in the 3 600 days of the Monte Carlo simulation. The reader can note that the APB lies inside this interval, near the 5th percentile level, suggesting that even though the APB gives a lower accumulated return than the MSR portfolio, its value is statistically equal to the latter.
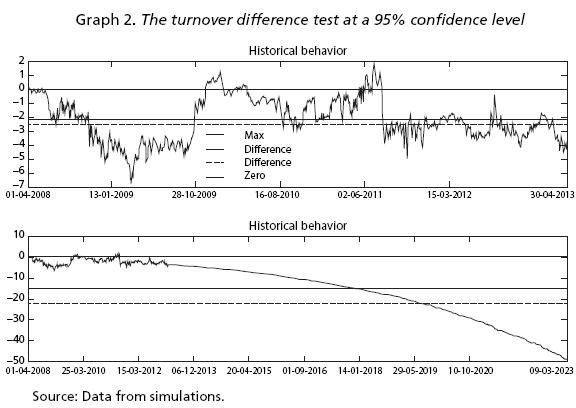
In order to support this finding, both time series (APB and MSR portfolio) were treated as coupled samples and a Neymman-Pearson coupled sample difference test will be performed resting the value of the APB to the MSR portfolio. The null hypothesis is that the mean difference is zero and the alternative that it is lower than zero. The upper chart of Graph 2 shows the test in the backtest or ex post period (April, 2008-April, 2013) where the null hypothesis is accepted with a 95% trust interval. Also, in the lower chart with the entire simulation data, the same hypothesis is accepted. These results strengthen the first finding of the statistical equality in the accumulated return results of the APB with the theoretical reference used.


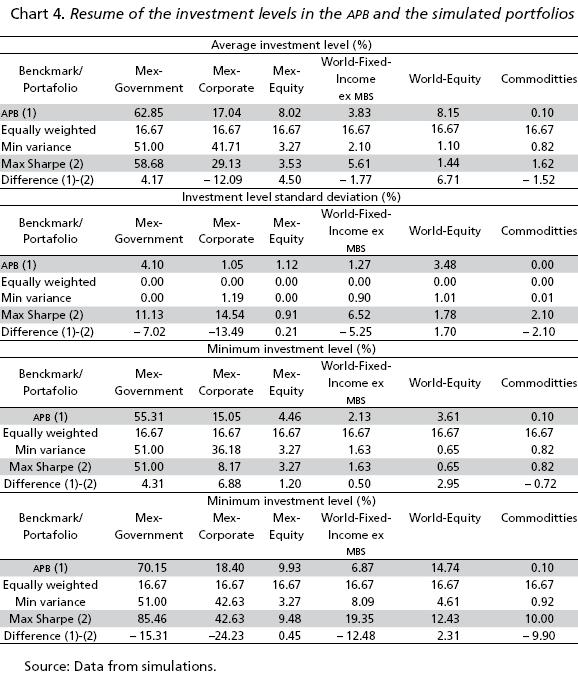
Finally, in order to find a cause to the observed result in the APB, Chart 4 presents a summary of the investment levels in the backtest. This summary shows that the investment level in the Fixed Income markets is very similar between the APB and the MSR portfolio, but the latter has a higher proportion invested in equity and commodities, leading to the superior accumulated return but also the more unstable observed Sharpe ratio levels (given the higher volatility in these type of assets).
Finally, the max drawdown test presented in Chart 5 supports the use of the APB even though the APB and the simulated portfolios have more max drawdown days20 than de 95% confidence Poisson limit of 143. An interesting result from this chart is the fact that the APB is among the portfolios with the lowest number of days below - 5% and that the min variance portfolio, as theoretically expected, has only 93 days (from a 143 days limit) in max drawdown, leaving this portfolio for further research as presented in De la Torre, Figueroa, Martínez, et al (2015) Finally and by following Tabner (2007), the equally weighted portfolio was the worst performer in the turnover and max drawdown tests.
]]>
IV. Theoretical and practical implications of the proposed benchmark: pro and cons for the Mexican and other Latin America countries experience and guidelines for further research
Up to this point we have found enough evidence to highlight the theoretical and, more important, practical kindnesses of our proposed benchmark. We resume them next:
• Even though we are not proposing a new benchmark weighting method, we suggest to extend the use of an existent and accepted methodology in the mutual fund management industry for "life cycle" mutual funds (useful for 401K pension plans in the US, an analogue of the Mexican and Chilean public pension plans).
• Even though we didn't test the geometrical position of this benchmark in its efficient frontier (by accepting the argument of Roll (1977) that the benchmark or market portfolio could not be efficient), we found that the historical observed Sharpe ratio of the proposed benchmark and its theoretical counterpart (the tangent portfolio) are statistically equal. This result supports the mean-variance efficiency of the benchmark even if the benchmark does not lie in the efficient frontier.
• By testing the mean-variance efficiency of our benchmark, we found proof that the management of the Mexican Siefores has been ex post mean-variance efficient from 2008 to 2013. This is not in line with the results found in Srinivas and Yermo (1999) who test the mean-variance efficiency of some OECD and Latin American countries or Jara, Gómez and Pardo (2005); Jara (2006), and García and Moreno (2011) who prove the inefficiency of the Colombian public defined-benefit pension funds. They do this with a contrast of the Colombian pension funds mean-variance efficiency against the efficient frontier.
• Contrary to the Colombian case we found evidence in favor of the Siefore (or Afore) management and in favor to the APB based on the fact that the Sharpe ratio is statistically equal to the ms and because the max drawdown test is very similar to the one found in the min variance portfolio.
Following this, it is necessary to mention some disadvantages of the APB benchmark. The most observable is that the weighting method is ex post to the real execution of the IPS, i.e. the investment level in each asset type or market is done with the investment levels of the previous month. Related to this, the Siefores rebalance their portfolios in a weekly or more periodical manner.
]]> By using this method, the investor or portfolio manager should assume that the actual investment level at the beginning of the month will be constant and this, by valuation or practical issues, cannot hold all the time. Despite these disadvantages, there are benefits that the proposed APB methodology has.The first one is that it replicates the IPS allowed by CONSAR because the actual position in the Siefores is the execution of that IPS and, therefore, is the "actual investment position" of the portfolios. Another theoretical advantage is that, by following the IPS of the Siefores, this benchmark is also a useful life cycle strategy benchmark and leads to stable investment levels, allowing a low trade turnover for passive portfolio management. Finally, this benchmark is among the first proposals to use non-market cap benchmarks, a method widely questioned in papers like the ones of Grinold et al (1990); Goltz and Lesourd (2011); Goltz (2012), and Amenc et al (2012).
Some of the possible counter arguments against the proposal of this sort of benchmark is that, comparing this proposal with the Colombian case, the benchmark could lead to "lazy" managers and poor performance results in the Siefores based on the fact that all these funds would replicate the benchmark. This last statement is not possible in Mexico based on the fact that the inefficient results and low replacement rate that the Colombian funds have are a result of several factors that, as stated by Jara (2006), lead to a sort of agency risk and high levels of risk aversion among managers. We resume the most relevant hints of Jara for the Colombian case:
• The most important externality: the existence of a "minimum rate" to pay each year compared to a specific formula that includes the three year average return of all the pension funds in the market If this rate is not fulfilled, the portfolio manager must pay the deficit to the investors. In the case of Uruguay, we found the opposite: there is a maximum rate to pay to investors. This in order to have control of the risk taken by pension fund managers.
• The performance benchmark used in Colombia is calculated with a specific formula that does not explain clearly neither the actual position of pension funds nor the given investment policy (please refer to Jara (2006) for further details). This lead, as all the aforementioned authors state in their papers, to a non-efficient benchmark.
• The lack of a maximum risk level and the proper acceptable method to measure it: In the case of Mexico, the CONSAR (2012) rules not only determine the maximum and minimum investment levels per asset, asset-type and FX exposure but also the max VaR and CVaR accepted values and calculation method, giving an observable freedom to pension fund managers to have tactical asset allocation.
• There are some legal restrictions for new comers (new pension fund managers) like the size of the managed portfolio. In Colombia pension fund managers can only manage a portfolio 48 times bigger21 than their technical equity. This restriction allow only to big banks or financial institutions to be the only participants, creating, as one of the consequences with a small number of managers, a sort of oligopsony in the financial markets and an oligopoly in the pension fund management industry.
If we add these factors (among the most relevant ones), we can find a cause-consequence relation for the Colombian case that does not apply for the Mexican one. Even though the present paper has more empirical than theoretical ambitions, we present proofs in favor of the existence of a performance benchmark and we found some theoretical implications form market efficiency and portfolio management. First, the existence of this index could lead to a higher informational efficiency in the Mexican pension fund market.
This is a strong support to the theory of informational efficiency based on fact that the investors could identify the "lazy" or inefficient pension funds and change their money to another pension fund with a better performance and mean-variance efficiency. They could do this by comparing their actual pension fund's performance against the other ones with a single performance index that has a comprehensible weighting method.
]]> Following this, as second theoretical hint, the existence of a mutual fund (Siefore) performance benchmark could help to increase competitiveness among pension funds based on the fact that Mexican workers do not pay marketing, insurance or account management costs22 and have, as consequence, a more flexible and more liquid secondary pension fund market i.e. they can change their money easily among Siefores with no other costs than the price movement of their pension fund portfolio.23 Therefore, the existence of a benchmark, like the proposed one, will punish bad managers and will price the best ones. As recommendations for further research we will talk of some of the drawbacks of our paper:• We calculated a benchmark that will measure the performance of all the type of Siefores. We are working in the calculation and mean-variance efficiency of a benchmark for each type of Siefore.
• The present paper does not test the observed results in periods of crisis and non-crisis. We are addressing a test for this purpose but there is a wide range of econometric tools and economic theories that could solve this drawback. We recommend this task for further research.
• We have accepted as valid or appropriate the investment level limits given in Chart 1. That is huge and delicate assumption. If we change some of these restrictions (such as the FX exposure one), the mean-variance efficiency is highly sensitive. Therefore, by following the theoretical aspects inherent to the math and geometry of the modern portfolio theory, a necessary research task is to test the actual investment policy given by CONSAR (2012) and, if necessary, to determine the proper investment level limits (i.e. the most suitable investment policy).
• The present paper uses sample methods to test the performance in the APB. Out of sample techniques (beyond our Monte Carlo simulation) are suggested as a natural extension.
• As another improvement for the present study, it is necessary to mention that the APB used market cap benchmarks in each asset type, leading to a practical and theoretical inconsistence that suggests the need and development of non-market cap market benchmarks for each asset group.
Conclusions
As the results suggest, the hypothesis of a statistical equality in the performance of the Actual position Benchmark (APB) and the max Sharpe ratio portfolio (MSR) holds by the accumulated return, max drawdown and Sharpe ratio levels observed in the simulations. Even though the MSR is the most efficient and profitable portfolio, the APB has a similar performance to the latter, and is a very comprehensible and acceptable benchmark to measure the performance of the Siefores or pension funds that want to replicate the investment policy statement (IPS) allowed in CONSAR (2012) rules.
]]> This conclusion is supported by the results in the historical turnover, the Sharpe ratio and the max drawdown test. In the first case, the historical behavior of the APB and the MSR is practically the same in the backtest. Also, in the Monte Carlo part of the simulation, a 90% confidence interval in the MSR portfolio is calculated and the APB lies within the interval, supporting the conclusion of statistical equality in the turnover of both portfolios.Despite the fact that almost all the simulated portfolios and the APB fail the max draw down Poisson test with a 95% confidence parameter /95%,1280*10% = 143, the latter has a lower number of days (against the MSR) with percentage variations of less than - 5%. Therefore, this benchmark can be used to measure the performance of the Siefores and pension funds that want to use a similar IPS by its stable risk exposure.aquii
Finally, by testing the observed mean-variance efficiency through the observed Sharpe ratio, the APB has statistically equal results to the MSR portfolio, highlighting the more stable behavior of the APB values. Among the causes that lead to the statistic equality in the performance of both portfolios, we find that both have similar investment levels in the fixed income component.
As a final practical recommendation for the Mexican pension fund management industry we state that the CONSAR should calculate this sort of Benchmark and make the data public. This is so in order to address four needs: 1) investors who want to test the performance of their pension fund (either Siefore or defined benefit pension fund) could have a public, investable, and comprehensible benchmark to test the performance of their investments in securities, 2) pension fund sponsors and portfolio managers of the Siefores could have a public reference to test their performance and the quality of their investment policies, 3) investors could have a straightforward way to compare their pension fund performance against competition and they could punish bad pension fund management and prize the best one by investing their money in the former. This could lead to higher level of competitiveness in the pension fund management industry, and 4) with this performance benchmark some other type of pension funds (such as private defined-benefit ones) could have a benchmark to determine if their actual investment policy is acceptable or not, given their financial needs.
References
Amenc, Nol; Goltz, Felix; Lodh, Ashish, and Martellini, Lionel (2012). Diversifying the Diversifiers and Tracking the Tracking Error. The Journal of Portfolio management, 38 (3), pp. 72-88. [ Links ]
Bailey, Jeffery V. (1992). Evaluating Benchmark Quality. Financial Analysts Journal, 48 (3), pp. 33-40. [ Links ]
]]>Banxico (2013). Tasas y precios de referencia. CF300 - Vector de precios de títulos gubernamentales (on the run. Available at: http://www.banxico.gob.mx/SieInternet/consultarDirectorioInternetAction.do?accion=consultarCuadro&idCuadro=CF300§or=18&locale=es [Accesed December 11, 2013] [ Links ].
Black, Fischer, and Litterman, Robert (1992). Global portfolio optimization. Financial Analysts Journal, 48 (5), pp. 28-43. doi:10.2469/faj.v48.n5.28 [ Links ]
CONSAR (2012). Disposiciones de carácter general que establecen el régimen de inversión al que deberán sujetarse las sociedades de inversión especializadas de fondos para el retiro. Normatividad-circulares CONSAR. Available at: http://www.consar.gob.mx/normatividad/normatividad-normatividad_consar-circulares.shtml [Accesed February 3, 2013] [ Links ].
---------- (2013). Inversiones de las Siefores. Información estadística. Available at: http://www.consar.gob.mx/SeriesTiempo/CuadroInicialaspx?md=21 [Accesed August 1, 2013] [ Links ].
De la Torre, Oscar; Galeana, Evaristo; Martínez, María Isabel, and Aguilasocho, Dora (2015). A minimum variance benchmark to measure the performance of pension funds in Mexico. Contaduría y Administración UNAM, 61(3), pp. 593-614. [ Links ]
García, Claudia María, and Moreno, Jilmer Arley (2011). Optimización de portafolios de pensiones en Colombia: el esquema de multifondos, 2003-2010. Ecos de Economía, 15 (33), pp. 139-183. [ Links ]
Gibbons, Michael; Ross, Stephen, and Shanken, Jay (1989). A Test of the Efficiency of a Given Portfolio. Econometrica, 57 (5), pp. 1121-1152. [ Links ]
Goltz, F. (2012). Alternative Equity Beta Benchmarks. [on line] Available at: http://www.edhec-risk.com/indexes/equity_index_research [Accesed February 13, 2013] [ Links ].
Goltz, Felix, and Le Sourd, Véronique (2011). Does Finance Theory Make the Case for Capitalization-Weighted Indexing? The Journal of Index Investing, 2 (2), pp. 59-75. [ Links ]
Grinold, Richard C. (1989). Are Benchmark Portfolios Efficient? The Journal of Portfolio Management, 19 (1), pp. 34-40. [ Links ]
Haugen, Robert A., and Baker, Nardin L. (1990). The efficient market inefficiency of capitalization-weighted stock portfolios. The Journal of Portfolio Managemen, 17 (3), pp. 35-40. [ Links ]
Ibbotson, Roger (2010). The importance of asset allocation. Financial Analysts Journal, 66 (2), pp. 18-20. [ Links ]
Jara, Diego (2006). Modelo de la regulación de las AFP en Colombia y su impacto en el portafolio de los fondos de pensiones. Ensayos sobre Política Económica, 0 (52), pp. 162-221. [ Links ]
Jara, Diego; Gómez, Carolina, and Pardo, Andrés (2005). Análisis de eficiencia de los portafolios pensionales obligatorios en Colombia. Ensayos sobre Política Económica, 23 (49), pp. 192-239. [ Links ]
Kandel, Shmuel, and Stambaugh, Robert F. (1989). A Mean-Variance Framework for Tests of Asset Pricing Models. The review of Financial Studies, 2 (2), pp. 125-156. [ Links ]
Kuenzi, David E. (2003). The Benchmark's Benchmark: Measuring the Performance of a Manager's Long-Term Strategy. Working paper, October. [ Links ]
Lintner, John (1965). The valuation of risk assets and the selection of risky investments in stock portfolios and capital budgets. The Review of Economics and Statistics, 47 (1), pp. 13-37. [ Links ]
Maggin, John L.; Donald, Tuttle; McLeavey, Dennis W., and Pinto, Jerald E. (2007). Managing Investment Portfolios: A Dynamic Process. Hoboken: John Miley and Sons. [ Links ]
Roll, Richard (1977). A critique of the asset pricing theory's tests Part I: On past and potential testability of the theory. Journal of Financial Economics, 4 (2), pp. 129-176. [ Links ]
S & P (2012). S & P Target Date Index Series Methodology. S & P Dow Jones Indices LLC. [pdf] Available at: http://latam.spindices.com/documents/methodologies/methodology-sp-target-date.pdf?force_download=true [Accesed May 27, 2013] [ Links ].
Samuelson, Paul (1965). Proof that properly anticipated prices fluctuate randomly. Industrial management Review, 6 (2), pp. 41-49. [ Links ]
Sharpe, William (1964). Capital asset prices: A theory of market equilibrium under conditions of risk. The Journal of Finance, 19 (3), pp. 425-442. [ Links ]
---------- (1966). Mutual fund performance. The Journal of Business, 39 (1), pp. 119-18. [ Links ]
Srinivas, Pulle Subrahmanya, and Yermo, Juan (1999). Do Investment Regulations Compromise Pension Fund Performance? Evidence from Latin America. Revista de Análisis Económico, 14 (1), pp. 67-120. [ Links ]
Tabner, Isaac (2007). Benchmark concentration: capitalization weights versus equal weights in the FTSE 100 Index. [on line] Avilable at: https://dspace.stir.ac.uk/bitstream/1893/2454/1/MFJ Article SSRN Version.pdf [Accesed February 3, 2013] [ Links ].
Treynor, Jack, and Black, Fisher (1973). How to Use Security Analysis to Improve Portfolio Selection. The Journal of Business, 46 (1), pp. 66-86. [ Links ]
Valdes-Prieto, Salvador (2000). Do investment regulations compromise pension fund performance? Evidence from Latin America: A comment. Revista de Análisis Económico, 15 (2), pp. 109-120. [ Links ]
Waring, Barton, and Whitney, Duane (2009). An Asset-Liability Version of the Capital Asset pricing Model with a multi-period two-fund theorem. The Journal of Portfolio management, 35 (4), pp.111-131. [ Links ]
1 The letters, in Spanish, of Pension Fund Managemet Firm (Administradora de Fondos para el Retiro –Afore–).
2 A sort of 401k plan.
3 An internal or public document that states the financial objectives of the pension fund, along with the risk exposure limits, asset types allowed in the portfolio, their investment levels, FX investment exposure and all the related risk, investment and return profile for the managed portfolio. For a straightforward review, please refer to Maggin et al (2007).
]]> 4 A State Comission that rules the Afores in Mexico.5 So sensitive it is, that an inefficient choice could lead to inefficient results. A good example of this is the investment regime of the Colombian pension system. Please refer to Srinivas and Yermo (1999), Valdes Prieto et al (2000) and specially Jara (Jara, 2006) for further details.
6 Even though Mexico has acceptably liquid treasury and corporate fixed income markets, the historical market cap information is not of public domain and is only available through propietary data of special financial services such as Reuters or Bloomberg.
7 Determining a proper cross-asset market benchmark is a task that is outside the scope of the present paper and that is in current research.
8 Even though the informational efficiency concept is quite related to this paper, only the financial or mean-variance efficiency is going to be tested. Therefore, the terms financial efficiency, mean-variance efficiency or just efficiency are used indistinctly hereafter.
9 A key concept suggested by Samuelson (1965). It sustains the acceptance of the CAMP and the market portfolio concept as suggested by Sharpe (1964) and Lintner (1965).
10 Siefore type 4 is for the younger workers and Siefore type 1 and Siefore especial are for the older and retired ones respectivelly.
11 Both funds have similar personal finance implications to workers, but the difference between a US 401K plan and a Siefore is that the former is private and optional to the US workers and the latter is public and mandatory to all Mexican persons that had a first job since 1997.
12 Published by the CONSAR at the end of month (CONSAR, 2013).
13 As a key assumption, this APB will be useful for all sorts of pension funds in Mexico as long as they follow the investment rules published by the CONSAR. The use of strategy benchmarks for different investment policies is a subject of further research.
]]> 14 An April, 1st, 2008 base 100 value15 Even though we should test our benchmark against a non restricted Max Sharpe portfolio, we will not do that based on the fact that there are real legal constraints in the investment policy. If this constraints are appropriate or not is outside the scope of the present paper and is a task under current research by one of the authors [last name will appear here once the paper is accepted] and some other Mexican researchers.
16 This will also lead, as an additional result, that the Afores have efficient portfolios with a mean-variance efficiency level close to the one of a theoretical efficient reference such as the Max Sharpe Benchmark.
17 The proper selection of the time interval (weekly, monthly or yearly) is outside the scope of the present paper. We will use a daily basis based on the fact that shorter time periodicities present shocks and more dramatic behavior in the volatility and correlation levels. We also use this periodicity because it is necessary to have a daily performance benchmarks. Mexico has one for its conventional mutual funds.
18 The risk free rate is the one month (28 days) CETES rate published by Banco de México (Banxico, 2013).
19 The actual position of each Siefore is published by CONSAR since November of 2008.
20 A daily percentage variation of less than - 5%.
21 At most and excluding government securities.
22 Based on the fact that Siefores are mutual funds, the Mexican investors pay only a management fee of 1% (at most) by the managed amount. They do not pay neither buy/sell fees nor management, insurance or marketing costs.
23 CONSAR also limits the expenses in marketing and give some guidelines for marketing practices. This is done in order to increase the informational efficiency among investors and also to promote a more honest financial advice e.g. a pension fund advisor that works with an Afore must have a pension and financial certification in order to work in the business.
]]>Información sobre los autores
Óscar De la Torre Torres. Licenciado en Administración por la Universidad La Salle Morelia y maestro en Ingeniería Económica y Financiera por la Universidad La Salle México. También, doctor en Ciencias en Negocios Internacionales por parte de la UMSNH. Actualmente cursa un doctorado en Economía de Empresa en la Universidad Autónoma de Madrid, siendo sus principales líneas de investigación la administración de portafolios en fondos de pensiones, la econometría financiera y la inversión socialmente responsable. Ha sido empresario,miembro de Coparmex y ha laborado en Vector Casa de Bolsa, la tesorería de FIRA-Banco de México, la División Corporativa de Cambios de Scotia Capital y como secretario técnico en la Secretaría de Finanzas y Administración de Michoacán. Actualmente es profesor- investigador de tiempo completo en la UMSNH y miembro nivel 1 del SNI, con perfil deseable PRODEP. áreas de especialidad: teoría de portafolios, econometría financiera, inversión sustentable.
Evaristo Galeana Figueroa. Licenciado en Administración de Empresas con especialidad en Finanzas y maestro en Administración por la UMSNH, también es doctor en Organización y Dirección de Empresas por la Universitat Rovira i Virgili, Tarragona, España. Sus principales líneas de investigación: fomento y evaluación de la competitividad, y calidad total y sus repercusiones en el sector productivo. Participa en una red tiática de colaboración con el proyecto "Factores clave para la competitividad de las pymes manufactureras, región Centro Occidente". Ha sido secretario administrativo y coordinador de la Investigación de la Facultad de Contaduría y Ciencias Administrativas de la UMSNH. Actualmente es jefe de la División de Estudios de Posgrado y profesor-investigador de tiempo completo. Esmiembro nivel 1 del SNI, con perfil deseable PRODEP.
Dora Aguliasocho Montoya. Contador público por la Universidad Michoacana de San Nicolás de Hidalgo (UMSNH), con Maestría en Administración por la misma casa de estudios y Doctorado en Organización y Dirección de Empresas por la Universitat Rovira i Virgili, de Tarragona, España. Sus principales líneas de investigación son: fomento y evaluación de la competitividad, calidad total y sus repercusiones en el sector productivo. Participa en una red temática de colaboración con el proyecto "Factores clave para la competitividad de las pymes manufactureras, región Centro Occidente". Actualmente es responsable del programa Impulsa y profesora-investigadora de tiempo completo de la Facultad de Contaduría y Ciencias Administrativas de la UMSNH. Asimismo, esmiembro nivel 1 del SNI, con perfil deseable PRODEP.
]]>