<?xml version="1.0" encoding="ISO-8859-1"?><article xmlns:mml="http://www.w3.org/1998/Math/MathML" xmlns:xlink="http://www.w3.org/1999/xlink" xmlns:xsi="http://www.w3.org/2001/XMLSchema-instance">
<front>
<journal-meta>
<journal-id>0187-6236</journal-id>
<journal-title><![CDATA[Atmósfera]]></journal-title>
<abbrev-journal-title><![CDATA[Atmósfera]]></abbrev-journal-title>
<issn>0187-6236</issn>
<publisher>
<publisher-name><![CDATA[Universidad Nacional Autónoma de México, Instituto de Ciencias de la Atmósfera y Cambio Climático]]></publisher-name>
</publisher>
</journal-meta>
<article-meta>
<article-id>S0187-62362015000200002</article-id>
<title-group>
<article-title xml:lang="en"><![CDATA[Downscaling standardized precipitation index via model output statistics]]></article-title>
</title-group>
<contrib-group>
<contrib contrib-type="author">
<name>
<surname><![CDATA[Tatli]]></surname>
<given-names><![CDATA[Hasan]]></given-names>
</name>
<xref ref-type="aff" rid="A01"/>
</contrib>
</contrib-group>
<aff id="A01">
<institution><![CDATA[,Canakkale Onsekiz Mart University Faculty of Sciences and Arts Department of Geography]]></institution>
<addr-line><![CDATA[Canakkale ]]></addr-line>
<country>Turquía</country>
</aff>
<pub-date pub-type="pub">
<day>00</day>
<month>00</month>
<year>2015</year>
</pub-date>
<pub-date pub-type="epub">
<day>00</day>
<month>00</month>
<year>2015</year>
</pub-date>
<volume>28</volume>
<numero>2</numero>
<fpage>83</fpage>
<lpage>98</lpage>
<copyright-statement/>
<copyright-year/>
<self-uri xlink:href="http://www.scielo.org.mx/scielo.php?script=sci_arttext&amp;pid=S0187-62362015000200002&amp;lng=en&amp;nrm=iso"></self-uri><self-uri xlink:href="http://www.scielo.org.mx/scielo.php?script=sci_abstract&amp;pid=S0187-62362015000200002&amp;lng=en&amp;nrm=iso"></self-uri><self-uri xlink:href="http://www.scielo.org.mx/scielo.php?script=sci_pdf&amp;pid=S0187-62362015000200002&amp;lng=en&amp;nrm=iso"></self-uri><abstract abstract-type="short" xml:lang="es"><p><![CDATA[El presente estudio analiza los posibles impactos futuros del cambio climático sobre los eventos meteorológicos de sequía en Turquía, utilizando para ello una nueva técnica estadística de reducción de escala (downscaling) basada en regresión logística politómica. Esta técnica, conocida como "estadísticas de salida del modelo" (model output statistics, MOS), está diseñada para la reducción de escala de las categorías de sequía del índice estandarizado de precipitación (SPI, por sus siglas en inglés). El principal objetivo de un procedimiento de reducción de escala es determinar la influencia de la variabilidad climática de gran escala y los cambios proyectados en las variables a nivel regional y local. Los predictores de gran escala utilizados en este estudio se obtuvieron a partir de simulaciones del modelo canadiense de circulación general acoplado de segunda generación (CGCM2, por sus siglas en inglés), las cuales abarcan de 1940 a 2100 e incluyen tres escenarios socioeconómicos: control, con los límites de la concentración atmosférica de gases de efecto invernadero en el siglo XX, y los escenarios A2 y B2 del Informe especial sobre escenarios de emisiones del Panel Intergubernamental de Cambio Climático. Se utilizaron observaciones de 96 estaciones meteorológicas para calcular los valores anuales del SPI para el periodo 1940-2010, dejando los últimos 10 años para validación contra los resultados simulados por el CGCM2. Los resultados del MOS derivados de la simulación del clima denominada control coincidieron con los patrones observados en el clima actual. Los resultados del MOS derivados de escenarios climáticos futuros llevan a concluir que hay una probabilidad disminuida de que se presenten condiciones muy húmedas o extremadamente húmedas. Adicionalmente, las probabilidades de que las condiciones sean cercanas a lo normal disminuirán en la costa del Mar Negro, y aumentarán en la transición del Mármara y en Anatolia oriental.]]></p></abstract>
<abstract abstract-type="short" xml:lang="en"><p><![CDATA[This study investigates the possible impacts of future climate change on meteorological drought events in Turkey by using a new statistical downscaling technique based on polytomous logistic regression, denoted as the model output statistics (MOS) technique. It is designed to downscale the drought classes of the 12-month Standardized Precipitation Index (SPI). The main goal of a downscaling procedure is to determine the influences of large-scale climatic variability and the projected changes on the local scale-regional variables. The large-scale predictors used in this study were obtained from the output of the Second Generation Canadian Coupled General Circulation Model (CGCM2) simulations, run from 1940 to 2100 for three socioeconomic scenarios, namely control, with the constraint of the 20th century atmospheric concentration of greenhouse gases, and the SRES A2 and B2 scenarios. Observations from 96 meteorological stations were used to estimate 12-month SPI values for the period 1940-2010, leaving the last 10 years for validation against the results simulated by the CGCM2. The MOS results derived from the control climate simulation agree with the observed patterns for present climate. The MOS results derived from future climate scenarios lead to conclude that there is a decreased probability of very wet and extremely wet conditions. In addition, the probabilities of near-normal conditions will decrease in the Black Sea coast and will increase towards the Marmara Transition and continental eastern Anatolia regions.]]></p></abstract>
<kwd-group>
<kwd lng="en"><![CDATA[Climate of Turkey]]></kwd>
<kwd lng="en"><![CDATA[statistical downscaling]]></kwd>
<kwd lng="en"><![CDATA[logistic regression]]></kwd>
<kwd lng="en"><![CDATA[standard precipitation index (SPI)]]></kwd>
</kwd-group>
</article-meta>
</front><body><![CDATA[  	    <p align="center"><font face="verdana" size="4"><b>Downscaling standardized precipitation index via model output statistics</b></font></p>  	    <p align="center"><font face="verdana" size="2">&nbsp;</font></p>  	    <p align="center"><font face="verdana" size="2"><b>Hasan Tatli</b></font></p>  	    <p align="center"><font face="verdana" size="2"><i>&#199;anakkale Onsekiz Mart University, Faculty of Sciences and Arts, Department of Geography, Physical Geography Division, Climatology/Meteorology Group, Terzio&#287;lu Campus, 17020 &#199;anakkale, Turkey</i> E&#45;mail: <a href="mailto:tatli@comu.edu.tr" target="_blank">tatli@comu.edu.tr</a>, <a href="mailto:tatli.hasan@gmail.com" target="_blank">tatli.hasan@gmail.com</a></font></p>  	    <p align="center"><font face="verdana" size="2">&nbsp;</font></p>  	    <p align="center"><font face="verdana" size="2">Received: December 10, 2013; accepted: February 4, 2015</font></p>  	    <p align="center"><font face="verdana" size="2">&nbsp;</font></p>  	    <p align="justify"><font face="verdana" size="2"><b>RESUMEN</b></font></p>  	    <p align="justify"><font face="verdana" size="2">El presente estudio analiza los posibles impactos futuros del cambio clim&aacute;tico sobre los eventos meteorol&oacute;gicos de sequ&iacute;a en Turqu&iacute;a, utilizando para ello una nueva t&eacute;cnica estad&iacute;stica de reducci&oacute;n de escala <i>(downscaling)</i> basada en regresi&oacute;n log&iacute;stica polit&oacute;mica. Esta t&eacute;cnica, conocida como "estad&iacute;sticas de salida del modelo" <i>(model output statistics,</i> MOS), est&aacute; dise&ntilde;ada para la reducci&oacute;n de escala de las categor&iacute;as de sequ&iacute;a del &iacute;ndice estandarizado de precipitaci&oacute;n (SPI, por sus siglas en ingl&eacute;s). El principal objetivo de un procedimiento de reducci&oacute;n de escala es determinar la influencia de la variabilidad clim&aacute;tica de gran escala y los cambios proyectados en las variables a nivel regional y local. Los predictores de gran escala utilizados en este estudio se obtuvieron a partir de simulaciones del modelo canadiense de circulaci&oacute;n general acoplado de segunda generaci&oacute;n (CGCM2, por sus siglas en ingl&eacute;s), las cuales abarcan de 1940 a 2100 e incluyen tres escenarios socioecon&oacute;micos: control, con los l&iacute;mites de la concentraci&oacute;n atmosf&eacute;rica de gases de efecto invernadero en el siglo XX, y los escenarios A2 y B2 del Informe especial sobre escenarios de emisiones del Panel Intergubernamental de Cambio Clim&aacute;tico. Se utilizaron observaciones de 96 estaciones meteorol&oacute;gicas para calcular los valores anuales del SPI para el periodo 1940&#45;2010, dejando los &uacute;ltimos 10 a&ntilde;os para validaci&oacute;n contra los resultados simulados por el CGCM2. Los resultados del MOS derivados de la simulaci&oacute;n del clima denominada <i>control</i> coincidieron con los patrones observados en el clima actual. Los resultados del MOS derivados de escenarios clim&aacute;ticos futuros llevan a concluir que hay una probabilidad disminuida de que se presenten condiciones muy h&uacute;medas o extremadamente h&uacute;medas. Adicionalmente, las probabilidades de que las condiciones sean cercanas a lo normal disminuir&aacute;n en la costa del Mar Negro, y aumentar&aacute;n en la transici&oacute;n del M&aacute;rmara y en Anatolia oriental.</font></p>  	    ]]></body>
<body><![CDATA[<p align="justify"><font face="verdana" size="2">&nbsp;</font></p>  	    <p align="justify"><font face="verdana" size="2"><b>ABSTRACT</b></font></p>  	    <p align="justify"><font face="verdana" size="2">This study investigates the possible impacts of future climate change on meteorological drought events in Turkey by using a new statistical downscaling technique based on polytomous logistic regression, denoted as the model output statistics (MOS) technique. It is designed to downscale the drought classes of the 12&#45;month Standardized Precipitation Index (SPI). The main goal of a downscaling procedure is to determine the influences of large&#45;scale climatic variability and the projected changes on the local scale&#45;regional variables. The large&#45;scale predictors used in this study were obtained from the output of the Second Generation Canadian Coupled General Circulation Model (CGCM2) simulations, run from 1940 to 2100 for three socioeconomic scenarios, namely <i>control,</i> with the constraint of the 20th century atmospheric concentration of greenhouse gases, and the SRES A2 and B2 scenarios. Observations from 96 meteorological stations were used to estimate 12&#45;month SPI values for the period 1940&#45;2010, leaving the last 10 years for validation against the results simulated by the CGCM2. The MOS results derived from the <i>control</i> climate simulation agree with the observed patterns for present climate. The MOS results derived from future climate scenarios lead to conclude that there is a decreased probability of <i>very wet</i> and <i>extremely wet</i> conditions. In addition, the probabilities of <i>near&#45;normal</i> conditions will decrease in the Black Sea coast and will increase towards the Marmara Transition and continental eastern Anatolia regions.</font></p>  	    <p align="justify"><font face="verdana" size="2"><b>Keywords:</b> Climate of Turkey, statistical downscaling, logistic regression, standard precipitation index (SPI).</font></p>  	    <p align="justify"><font face="verdana" size="2">&nbsp;</font></p>  	    <p align="justify"><font face="verdana" size="2"><b>1. Introduction</b></font></p>  	    <p align="justify"><font face="verdana" size="2">Droughts in any form in the meteorological, hydrological and agricultural fields are the anticipated results of climate change, particularly in subtropical regions including the Mediterranean countries. Droughts will become more prevalent and thus, more complex water management and drought monitoring tools will be required (IPCC, 2001, 2007). The impacts of climate change on future weather and climate are generally evalauted by running general circulation models (GCMs) based on various scenarios.</font></p>  	    <p align="justify"><font face="verdana" size="2">The Mediterranean region, including Turkey, is one of the areas in which GCMs simulate decreases in precipitation. For instance, Ozturk <i>et al.</i> (2012) have investigated the annual time&#45;scale performance of the regional climate model Reg&#45;CM4.0 in simulating annual change of dry&#45;spells and extreme&#45;precipitation in the central Asian region by running the model for two 30&#45;yr. periods (1971&#45;2000 and 2071&#45;2100). They used the ERA40 reanalysis as boundary conditions of the regional climate model for the present period <i>(control)</i> and global datasets of EH5OM for the future with the IPCC SRES A1B scenario. They concluded that the southern part of Central Asia will be most vulnerable for droughts in the future, and there will be an increase in extreme drought conditions over almost the whole region.</font></p>  	    <p align="justify"><font face="verdana" size="2">However, simulations of the GCMs at coarse resolution may contain inherent inconsistent variability in climate variables. In view of that, a downscaling process is necessary to reduce uncertainty. For example, in a water management plan, the possible impacts of climate change on precipitation are remarkably important for local&#45;scale studies, but the resolution of the GCMs is not suitable; hence, the scale&#45;gap should be bridged with the local&#45;scale variables (<i>i.e</i>., precipitation). This can be achieved either by empirical&#45;statistical downscaling (which also includes probabilistic weather generators, etc.), or by physical&#45;dynamical downscaling (e.g., Karl <i>et al.,</i> 1990; Wilby <i>et al.,</i> 1999; Easterling, 1999; Timothy and Hulme, 1999; Tatli <i>et al.,</i> 2004, 2005; Coulibaly <i>et al.,</i> 2005; Fowler <i>et al.,</i> 2007; Tolika <i>et al.,</i> 2007; Anandhi <i>et al.,</i> 2008; Radu <i>et al.,</i> 2008; Hertig and Jacobeit, 2008; Tatli, 2013).</font></p>  	    <p align="justify"><font face="verdana" size="2">Many useful techniques have been suggested in traditional statistical&#45;downscaling procedures, such as linear and nonlinear regression, artificial neural networks (ANNs), canonical correlation analysis (CCA) and weather generator, which are are examples of methods for deriving relationships between large&#45;scale predictors and local&#45;scale predictands (Semenov and Barrow, 1997; Conway and Jones, 1998; Wilby <i>et al.,</i> 1998; Kocak <i>et al.,</i> 2004; Tatli <i>et al.,</i> 2004, 2005; Dibike and Coulibaly, 2006; Lou&#45;kas <i>et al.,</i> 2008; Schmith, 2008; Mishra and Singh, 2009; Mishra <i>et al.,</i> 2009; Vasiliades <i>et al,</i> 2009; Tatli, 2013).</font></p>  	    ]]></body>
<body><![CDATA[<p align="justify"><font face="verdana" size="2">Additionally, other studies have proposed are dealing with new methods, concepts, comparative studies and modeling, and have been applied in many fields (e.g., Wilby and Wigley, 1997; Huth <i>et al.,</i> 2000, Hay and Clark, 2003; Fowler <i>et al.,</i> 2007; Mascaro <i>et al.,</i> 2008).</font></p>  	    <p align="justify"><font face="verdana" size="2">Monitoring drought via the standard precipitation index (SPI) was first introduced by McKee <i>et al.</i> (1993, 1995), and found immediate applications in many fields (e.g., Guttman, 1998, 1999; Hayes <i>et al,</i> 1999; Wilhelmi and Wilhite, 2002; Steinemann, 2003; Wu <i>et al,</i> 2005; Tiirkes and Tatli, 2009; Vasiliades <i>et al,</i> 2009). The SPI approach has several advantages including its simplicity and temporal flexibility, which allow its application to water resources on all timescales. For instance, Hayes <i>et al.</i> (1999), based on a case study of drought in Texas, concluded that the SPI method is an important tool that could be operationally used in a local, state, regional, or national drought monitoring system in the United States.</font></p>  	    <p align="justify"><font face="verdana" size="2">In this study, a statistical&#45;downscaling model based on the logistic regression technique is suggested for downscaling 12&#45;month SPI values using large&#45;scale precipitation series on the four nearest grid points around the selected station. The large&#45;scale simulated precipitation values are used as predictors, and logistic regression is suggested as a downscaling technique for projecting future SPI values. The paper proceeds as follows: Section 2 describes the employed methods. Results are given in Section 3. Finally, Section 4 comprises the conclusions.</font></p> 	    <p align="justify">&nbsp;</p>  	    <p align="justify"><font face="verdana" size="2"><b>2. Data and methodology</b></font></p>  	    <p align="justify"><font face="verdana" size="2"><i>2.1 Data and study area</i></font></p>  	    <p align="justify"><font face="verdana" size="2">The dataset of local&#45;scale variables used in this study is the monthly precipitation records of the Turkish</font></p>  	    <p align="justify"><font face="verdana" size="2">State Meteorological Service. The selected meteorological stations provide a suitable spatial distribution of the rainfall regions (<a href="/img/revistas/atm/v28n2/a2f1.jpg" target="_blank">Fig. 1</a>, <a href="/img/revistas/atm/v28n2/a2t1.jpg" target="_blank">Table I</a>) of Turkey.</font></p>  	    <p align="justify"><font face="verdana" size="2">The large&#45;scale predictors needed for the study were extracted from the precipitation series simulated by the Second Generation Canadian Coupled General Circulation Model (CGCM2) of the Canadian Centre for Climate Modeling and Analysis (CCCma). For more details about the CGCM2 one may refer to the website of the CCCma (<a href="http://www.cccma.ec.gc.ca/models/models.shtm" target="_blank">http://www.cccma.ec.gc.ca/models/models.shtm</a>), Flato <i>et al.</i> (2000), or the IPCC data distribution center (<a href="http://www.mad.zmaw.de/IPCCDDC/html/ddcgcmdata.html" target="_blank">http://www.mad.zmaw.de/IPCCDDC/html/ddcgcmdata.html</a>). The atmospheric component of CGCM2 is a spectral model with triangular truncation at wave number 32 and a surface grid resolution of roughly 3.75 x 3.75&deg; with 10 vertical levels.</font></p>  	    <p align="justify"><font face="verdana" size="2"><i>2.2 Methodology</i></font></p>  	    ]]></body>
<body><![CDATA[<p align="justify"><font face="verdana" size="2">A logistic regression technique is used in this study to statistically downscale results from simulations of a global climate model with coarse resolution. Some definitions are needed for clarifying the question of how a logistic regression can be used as a downscaling technique. In simple logistic regression, the dependent variable <i>(i.e.,</i> predictand) is usually dichotomous or binary, that is, the predictand can assume the value of 1(one) with a probability of <i>P</i> for success and the value of 0 (zero) with a probability of 1&#45;P for failure. However, the logistic regression can also be extended to cases where the dependent variable can take more than two values, known as <i>multinomial</i> or <i>polytomous</i> (Aldrich and Nelson, 1984; Menard, 1995; Tabachnick and Fidell, 1996; Kleinbaum and Klein, 2002; Preisler and Westerling, 2007; Prasad <i>et al.,</i> 2010). The logistic regression is more powerful than other linear regression models, and it makes no assumption on the probability distribution of the predictors. The probability distribution in question needs not to be normally distributed, linearly related or have an equal variance within each group; these restrictions are needed in the traditional linear regression applications. The relationships are derived from the so&#45;called <i>logit&#45;transformation</i> by the success probability of:</font></p>  	    <p align="center"><font face="verdana" size="2"><img src="/img/revistas/atm/v28n2/a2e1.jpg"></font></p>  	    <p align="justify"><font face="verdana" size="2">where <i>x<sub>i</sub>(i</i> = 1,2,...,<i>n</i>) is the predictor and <i>b<sub>i</sub> (i</i> = 0,1,2,...,<i>n</i>) is the coefficient of logistic regression. Since logistic regression estimates the probability of success over the probability of failure, the results of the analysis could be put as <i>odd ratios</i> in the following expression:</font></p>  	    <p align="justify"><font face="verdana" size="2">&nbsp;</font></p>  	    <p align="center"><font face="verdana" size="2"><img src="/img/revistas/atm/v28n2/a2e2.jpg"></font></p>  	    <p align="justify"><font face="verdana" size="2">The logistic regression is structurally similar to the well&#45;known multivariate linear regression, where the logits act as predictors and the predictands are natural logarithms ofthe success probabilities (i.e., the odds).</font></p>  	    <p align="justify"><font face="verdana" size="2">The coefficients are generally obtained by using the weighted Newton&#45;Raphson algorithm. This method is attractive, because the response variables can be naturally arranged as a sequence of binary choices. For this reason, it is a very suitable approach to categorize drought events. The application steps of this method are briefly summarized below according to Tabachnick and Fidell (1996), and Kleinbaum and Klein (2002):</font></p>  	    <p align="justify"><font face="verdana" size="2">1. Choose initial estimates of the regression coefficients, <i>b<sup>T</sup></i> = 0.</font></p>  	    <p align="justify"><font face="verdana" size="2">2. At each iteration step <i>k,</i> update the coefficients,</font></p>  	    <p align="center"><font face="verdana" size="2"><img src="/img/revistas/atm/v28n2/a2e3.jpg"></font></p>  	    ]]></body>
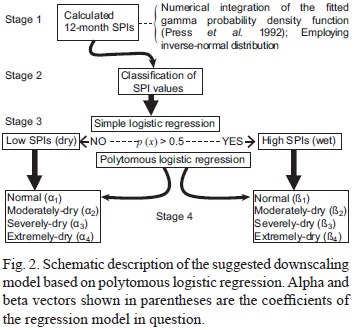
<body><![CDATA[<p align="justify"><font face="verdana" size="2">where <i>X</i> and <i>y</i> are treated as large&#45;scale predictors and predictands (containing zeros and ones), and <i>V<sub>k&#45;1</sub></i> is the weight matrix where the diagonal entries <i>p<sub>i</sub>,<sub>k&#45;1</sub>(1&#45;p<sub>k&#45;1</sub></i><sub></sub><i>)</i> represent the occurrence probability. Step 2 is repeated until <i>b<sub>k</sub></i> is close enough to b<i><sub>k&#45;1</sub></i>. The estimated asymptotic covariance matrix of the coefficients is given by (<i>X<sup>T</sup>VX</i>)<i><sup>&#45;1</sup>.</i> The Newton&#45;Raphson algorithm can be extended to a higher dimensional version (polytomous), and its parameters are illustrated with the vector of p<sub><i>k&#45;1</i></sub> in Eq. 3. The method is a multivariate regression model of the so&#45;called <i>conditional multinomial logistic regression.</i></font></p>  	    <p align="justify"><font face="verdana" size="2">The predictors illustrated with the matrix <i>X</i> are selected from the output of the simulation with the CGCM2, which is used to produce ensemble climate change projections using the IPCC's older IS92a forcing scenarios, as well as the newer SRESA2 and SRESB2 scenarios (IPCC, 2000). Note that the results of the CGCM2 are also used in the third assessment report of the IPCC (IPCC, 2001), and in the Arctic climate impact assessment.</font></p>  	    <p align="justify"><font face="verdana" size="2">The suggested procedure is schematically given in <a href="#f2">Figure 2</a>. Its source code is developed in Fortran 95, and it accounts for the missing values in the data. A test based on the index, namely the accuracy or proportion of correct predictions (Murphy, 1996; Livezey, 2003), was applied for measuring the performance of the logistic models. This test is commonly used to evaluate the performance of weather forecasting in meteorology.</font></p>  	    <p align="center"><font face="verdana" size="2"><a name="f2"></a></font></p>  	    <p align="center"><font face="verdana" size="2"><img src="/img/revistas/atm/v28n2/a2f2.jpg"></font></p>  	    <p align="justify"><font face="verdana" size="2">The drought and wet classes of 12&#45;month SPI values are calculated from the observed precipitation values as a first stage. The probability density function (PDF) of precipitation values is the first step to estimate SPI values (one may refer to Turkey and Tatli &#91;2009&#93; for a discussion on SPIs and modified&#45;SPIs). The gamma function approach is widely used to estimate the PDF of precipitation values (e.g., Thom, 1966; McKee <i>et al.,</i> 1993, 1995; Wilks, 1995; Guttman, 1998, 1999). In this study the cumulative distribution function (CDF) ofthe precipitation series is estimated by the numerical integration of fitted gamma PDF by the incomplete&#45;gamma approach (Press <i>et al.,</i> 1992). Twelve&#45;month SPI values are used, but the suggested algorithm can be easily applied to other time slices ofthe SPI values, such as 1, 3, 6,..., &#45;month, or more. The gamma PDF and CDF can be written as follows:</font></p>  	    <p align="center"><font face="verdana" size="2"><img src="/img/revistas/atm/v28n2/a2e4.jpg"></font></p>  	    <p align="justify"><font face="verdana" size="2">where <i>y</i> indicates the precipitation value, and <i>&#945; </i> and<span style="font-size:10.0pt;font-family:&quot;Verdana&quot;,&quot;sans-serif&quot;"><i> &#946;</i></span> are the shape parameter and the scale parameter of the distribution, respectively. The quantity <i>&#915; (<sup>.</sup>)</i> is the gamma function deined by</font></p>      <p align="center"><font face="verdana" size="2"><img src="/img/revistas/atm/v28n2/a2e5.jpg"></font></p>  	    <p align="justify"><font face="verdana" size="2">An improved method suggested by Bowman and Shenton (1988) was applied for estimating the shape parameter resulting from the use of an iterative sixth order polynomial. The scale parameter is then calculated by dividing the long&#45;term mean of precipitation values by the shape parameter, <i><img src="/img/revistas/atm/v28n2/a2e5.1.jpg">.</i></font></p>  	    ]]></body>
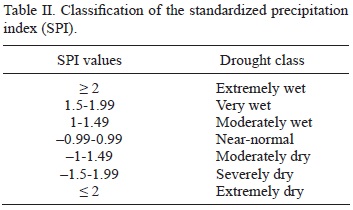
<body><![CDATA[<p align="justify"><font face="verdana" size="2">At the second stage, SPI values are classified according to <a href="#t2">Table II</a>. At the third stage, the dichotomous classes of drought and wet conditions are grouped into two classes, namely high and low SPIs treated as binary values (ones and zeros) represented by wet and dry classes in <a href="#f2">Figure 2</a>. This stage involves a simple logistic regression which classifies the occurrence probabilities of wet and dry cases.</font></p>  	    <p align="center"><font face="verdana" size="2"><a name="t2"></a></font></p>  	    <p align="center"><font face="verdana" size="2"><img src="/img/revistas/atm/v28n2/a2t2.jpg"></font></p>  	    <p align="justify"><font face="verdana" size="2">Finally, the fourth stage involves a polytomous logistic regression. In <a href="#f2">Figure 2</a>, the vectors given in the parentheses represented by alphas and betas indicate the coefficients of the specific logistic regression. The dependent variable can take four dichotomous values numbered as <i>(k =</i> 0, 1, 2, 3), representing the drought classes as shown on the left and right sides of <a href="#f2">Figure 2</a>. To further clarify this step, assume we wish to estimate the occurrence probability of a <i>moderately</i> dry class. By applying the vector of coefficients, the occurrence probabilities are calculated as:</font></p>  	    <p align="center"><font face="verdana" size="2"><img src="/img/revistas/atm/v28n2/a2e6.jpg"></font></p>  	    <p align="justify"><font face="verdana" size="2">where <i>P</i><sub>2</sub><i>(x)</i> represents the occurrence probability of a <i>moderately</i> dry class (the subscript 2 indicates the second drought class), and the vector <i>x</i> illustrates the large&#45;scale precipitation series simulated by CGCM2 in surrounding grid points to compare with non&#45;uniformly distributed station data.</font></p>  	    <p align="justify"><font face="verdana" size="2">After calculating the occurrence probabilities of the entire dry classes by using Eq. 6, the drought class of maximum probability is selected as the downscaled&#45;class for the specific station.</font></p>  	    <p align="justify"><font face="verdana" size="2">In order to measure the performance of the suggested model, the index of forecast accuracy or proportion of correct predictions (PC) was calculated between the output of the downscaling model&#45;based <i>control</i> and the observed SPI classes for the period 1970&#45;2000. For verifying multi&#45;category forecasts, the method starts with frequencies of the forecast and observations in various bins, as given in <a href="/img/revistas/atm/v28n2/a2t3.jpg" target="_blank">Table III</a>. A perfect forecast system should have values of non&#45;zero elements only along the diagonal, and values of 0 (zero) for all entries off the diagonal. The off&#45;diagonal elements give information about the specific nature of the forecast errors (Murphy, 1996; Livezey, 2003). The value of <i>PC</i> for the selected station is calculated as:</font></p>  	    <p align="center"><font face="verdana" size="2"><img src="/img/revistas/atm/v28n2/a2e7.jpg"></font></p>  	    <p align="justify"><font face="verdana" size="2"><i>PC</i> ranges from 0 to 1. If it assumes a value, close to 1, this indicates a high forecasting performance.</font></p> 	    ]]></body>
<body><![CDATA[<p align="justify">&nbsp;</p>  	    <p align="justify"><font face="verdana" size="2"><b>3. Discussion and results</b></font></p>  	    <p align="justify"><font face="verdana" size="2">The performance and results of the suggested downscaling models are compared with SPI values obtained from the observed precipitation series by covering each of the dry and wet event classes for the 12&#45;month SPIs calculated over Turkey. The performance of the suggested downscaling model based on the values of <i>PC</i> is given in <a href="/img/revistas/atm/v28n2/a2f3.jpg" target="_blank">Figure 3</a>. As shown in this figure, seven drought classes are first transformed into three major drought classes; for example, "extremely wet, very wet and moderately wet" drought classes are merged and renamed as <i>above normal.</i> Likewise, "extremely dry, severely dry and moderately dry <i>"</i> classes are merged, and renamed as <i>below normal.</i> The spatial patterns of the long&#45;term (climatological) occurrence probabilities are shown in <a href="/img/revistas/atm/v28n2/a2f4.jpg" target="_blank">Figure 4</a> and those extracted from the downscaling model are given in <a href="/img/revistas/atm/v28n2/a2f5.jpg" target="_blank">Figures 5</a> through <a href="/img/revistas/atm/v28n2/a2f7.jpg" target="_blank">7</a> (<a href="/img/revistas/atm/v28n2/a2f6.jpg" target="_blank">6</a>).</font></p>      <p align="justify"><font face="verdana" size="2">The level of long&#45;term probabilities of down&#45;scaled drought classes generally shows a zonal gradient from the rainfall regimes of the Mediterranean to the Black Sea basins. Maximum probabilities of a dry class regime are found near the border of Syria&#45;Turkey, where the warmest and driest land of Turkey is located (Tatli and T&uuml;rkes., 2011). The results of downscaled drought classes and their relationships with the synoptic&#45;climatological situations are discussed in the following sub&#45;sections.</font></p>  	    <p align="justify"><font face="verdana" size="2"><i>3.1 Extremely dry conditions and projections</i></font></p>  	    <p align="justify"><font face="verdana" size="2">According to the <i>extremely dry</i> conditions obtained from the observed rainfall totals, the long&#45;term (climatological) probabilities display a zonal&#45;pattern gradient from the Mediterranean to the Black Sea basins. Maximum probabilities are found in the warm and dry southern parts of the continental Mediterranean (CMED) rainfall regions, in which the areas of the Turkish&#45;Syrian border are located (<a href="/img/revistas/atm/v28n2/a2f4.jpg" target="_blank">Fig. 4a</a>).</font></p>  	    <p align="justify"><font face="verdana" size="2">According to the logistic model constructed by the predictors from the <i>control</i> climate simulations (<a href="/img/revistas/atm/v28n2/a2f5.jpg" target="_blank">Fig. 5a</a>), the probabilities of <i>extremely</i> dry conditions will increase in approximately 10% of the cases.</font></p>  	    <p align="justify"><font face="verdana" size="2">These downscaling results for the Mediterranean (MED) and CMED rainfall regions agree well with the observations, as seen in <a href="/img/revistas/atm/v28n2/a2f4.jpg" target="_blank">Figure 4a</a>. The probabilities of extremely dry conditions obtained from the observed values are around 1%, in spite of the results of the logistic model based on the <i>control</i> scenario indicate around 20% in the country's sub&#45;regions of the western Black Sea basin (<a href="/img/revistas/atm/v28n2/a2f5.jpg" target="_blank">Fig. 5a</a>). Additionally, the results show that the probabilities do not change sharply in the regions of the Marmara Transition (MRT) and the Mediterranean Transition (MEDT).</font></p>  	    <p align="justify"><font face="verdana" size="2">The probability patterns of downscaling models based on the IPCC SRESS A2 and B2 (<a href="/img/revistas/atm/v28n2/a2f6.jpg" target="_blank">Figs. 6</a> and <a href="/img/revistas/atm/v28n2/a2f7.jpg" target="_blank">7</a>, respectively) resemble each other. Furthermore, the estimated probabilities of <i>extremely dry</i> conditions in the Black Sea (BLS) region seem similar to the probabilities obtained by the downscaling&#45;model based on the <i>control</i> simulations. However, the estimated probabilities of <i>extremely dry</i> conditions in the MED and CMED regions are 10% higher than the values obtained from the <i>control</i> simulation (<a href="/img/revistas/atm/v28n2/a2f6.jpg" target="_blank">Figs. 6a</a> and <a href="/img/revistas/atm/v28n2/a2f7.jpg" target="_blank">7a</a>). The estimated probabilities for the eastern sub&#45;regions of the BLS and northeastern Anatolia are similar in magnitude and spatial distribution.</font></p>  	    <p align="justify"><font face="verdana" size="2"><i>3.2&nbsp;Severely dry conditions and projections</i></font></p>  	    ]]></body>
<body><![CDATA[<p align="justify"><font face="verdana" size="2">Although the observed probabilities of severely <i>dry</i> conditions are relatively low (about 2%), they increase from the MED and CMED to the northern part of the country. Furthermore, the probability values reach 4% in the eastern BLS and northern Anatolia sub&#45;regions of the Anatolian Peninsula, even though the probability values of <i>extremely dry</i> conditions are low (<a href="/img/revistas/atm/v28n2/a2f4.jpg" target="_blank">Fig. 4b</a>).</font></p>  	    <p align="justify"><font face="verdana" size="2">The logistic <i>control</i> model produces somewhat different patterns of probabilities when compared to observations, except for the MRT rainfall region (<a href="/img/revistas/atm/v28n2/a2f5.jpg" target="_blank">Fig. 5b</a>). Conversely, results ofthe logistic model based on the IPCC SRES A2 and B2 scenarios show patterns similar to the observed probabilities obtained from the <i>severely dry</i> scenario (<a href="/img/revistas/atm/v28n2/a2f6.jpg" target="_blank">Figs. 6b</a> and <a href="/img/revistas/atm/v28n2/a2f7.jpg" target="_blank">7b</a>).</font></p>  	    <p align="justify"><font face="verdana" size="2">The probabilities of a <i>severely dry</i> scenario obtained from the observations have a 2&#45;4% interval, with some exceptions as seen in the MED and CMED rainfall regions (<a href="/img/revistas/atm/v28n2/a2f4.jpg" target="_blank">Fig. 4b</a>), where the probabilities of a severely dry scenario show a negative trend. The results of the logistic model based on the IPCC SRES A2 have somewhat higher probabilities than those obtained from the IPCC SRES B2 (<a href="/img/revistas/atm/v28n2/a2f6.jpg" target="_blank">Figs. 6b</a> and <a href="/img/revistas/atm/v28n2/a2f7.jpg" target="_blank">7b</a>).</font></p>  	    <p align="justify"><font face="verdana" size="2"><i>3.3&nbsp;Moderately dry conditions and projections</i></font></p>  	    <p align="justify"><font face="verdana" size="2">The probabilities of having 12&#45;month SPI values of moderately dry class increase in rainfall regions MED and BLS, where the probabilities observed are about 4&#45;5% (<a href="/img/revistas/atm/v28n2/a2f4.jpg" target="_blank">Fig. 4c</a>). The probabilities observed in the western and eastern BLS sub&#45;regions vary from 7 to 9%, respectively.</font></p>  	    <p align="justify"><font face="verdana" size="2">The results of the logistic model based on the <i>control</i> scenario show that the pattern of higher probabilities has detailed spatial features, though some small probabilities are also observed (<a href="/img/revistas/atm/v28n2/a2f5.jpg" target="_blank">Fig. 5c</a>). According to the logistic model with predictors from the IPCC SRES A2 and B2 scenarios, the patterns of probabilities of <i>moderately</i> dry conditions have a positive trend (<a href="/img/revistas/atm/v28n2/a2f6.jpg" target="_blank">Figs. 6c</a> and <a href="/img/revistas/atm/v28n2/a2f7.jpg" target="_blank">7c</a>).</font></p>  	    <p align="justify"><font face="verdana" size="2"><i>3.4&nbsp;Normal conditions and projections</i></font></p>  	    <p align="justify"><font face="verdana" size="2">The 12&#45;month SPI values from observations in Turkey are mostly in the <i>near normal</i> class, since the climatological probabilities are generally changing from 60 to 70% (<a href="/img/revistas/atm/v28n2/a2f4.jpg" target="_blank">Fig. 4d</a>). As a result, this class could be referred to as <i>reference class,</i> which has a probability of being observed at least in 60% of the meteorological stations.</font></p>  	    <p align="justify"><font face="verdana" size="2">The probabilities of the logistic model based on the <i>control</i> scenario are in the <i>near normal</i> class, partially decreasing in the BLS basin. However, the patterns show that probabilities increase in the regions of the MRT and continental eastern Anatolia (CEAN) (<a href="/img/revistas/atm/v28n2/a2f5.jpg" target="_blank">Fig. 5d</a>), where the probabilities observed are around 80% or more.</font></p>  	    <p align="justify"><font face="verdana" size="2">The results obtained from the logistic model based on the IPCC SRES A2 and B2 scenarios are significantly similar, and related to the results obtained from the <i>control</i> scenario (<a href="/img/revistas/atm/v28n2/a2f6.jpg" target="_blank">Figs. 6d</a> and <a href="/img/revistas/atm/v28n2/a2f7.jpg" target="_blank">7d</a>). According to the downscaling results, it can be expected that the <i>near normal</i> class probability will increase about 10% as compared to its present values.</font></p>  	    ]]></body>
<body><![CDATA[<p align="justify"><font face="verdana" size="2"><i>3.5&nbsp;Moderately wet conditions and projections</i></font></p>  	    <p align="justify"><font face="verdana" size="2">In <a href="/img/revistas/atm/v28n2/a2f4.jpg" target="_blank">Figure 4e</a>, the probabilities of <i>moderately wet</i> conditions have a negative gradient from the sub&#45;rainfall regions of MED, MEDT and CMED to the BLS basin. Some of the minimum probabilities are observed on the coasts of the BLS basin, whereas the maximum values are only obtained in the CMED regions. The sub&#45;regions of western and eastern BLS and CEAN are exceptions, since the logistic model based on the <i>control</i> scenario simulates very small probabilities of <i>moderately wet</i> conditions (<a href="/img/revistas/atm/v28n2/a2f6.jpg" target="_blank">Fig. 6e</a>). The maximum probabilities are generally observed in the rainfall regimes of the MED and CMED, whereas the probabilities of the logistic model based on the <i>control</i> scenario decrease here and increase in the eastern BLS basin and north&#45;eastern Anatolia.</font></p>  	    <p align="justify"><font face="verdana" size="2">The results of the logistic model based on the IPCC SRES A2 and B2 show similarities with the <i>control</i> scenario (<a href="/img/revistas/atm/v28n2/a2f6.jpg" target="_blank">Figs. 6e</a> and <a href="/img/revistas/atm/v28n2/a2f7.jpg" target="_blank">7e</a>). These similarities may be seen in the probability patterns of <i>moderately wet</i> conditions, which decrease in the southern and western regions of the country.</font></p>  	    <p align="justify"><font face="verdana" size="2">Accordingly, it can be expected that the probabilities of <i>moderately wet</i> conditions will increase in the BLS basin and in the northeastern continental regions of the country. Furthermore, the maximum probabilities of <i>moderately wet</i> conditions are found in the eastern BLS basin for the logistic model based on the IPCC SRES A2, and in northeastern Anatolia for the model based on the IPCC SRES B2.</font></p>  	    <p align="justify"><font face="verdana" size="2"><i>3.6&nbsp;Very wet conditions and projections</i></font></p>  	    <p align="justify"><font face="verdana" size="2">The probabilities of the <i>very wet</i> class range from 3% in the CEAN region to 4% in the Aegean, Mediterranean and Black Sea regions (<a href="/img/revistas/atm/v28n2/a2f4.jpg" target="_blank">Fig. 4f</a>). The maximum probabilities of <i>very wet</i> conditions are about 5% in northeastern Anatolia. The probabilities are smaller for the logistic model based on the <i>control</i> scenario (<a href="/img/revistas/atm/v28n2/a2f5.jpg" target="_blank">Fig. 5f</a>). The probabilities in the Black Sea basin, middle&#45;northern parts of the CCAN and northeastern Anatolia are nearly 1% and close to 0% for the rest of the country.</font></p>  	    <p align="justify"><font face="verdana" size="2">The results obtained from logistic models based on the IPCC SRES A2 and B2 are consistent with the <i>control</i> simulations, in which the probabilities of <i>very wet</i> conditions are expected to be below 1% in the majority of the country (<a href="/img/revistas/atm/v28n2/a2f6.jpg" target="_blank">Figs. 6f</a> and <a href="/img/revistas/atm/v28n2/a2f7.jpg" target="_blank">7f</a>). Both models show that the maximum probabilities are seen in parts of the northern Thrace, and in the sub&#45;regions of the eastern and middle Black sea basin.</font></p>  	    <p align="justify"><font face="verdana" size="2"><i>3.7 Extremely wet conditions and projections</i></font></p>  	    <p align="justify"><font face="verdana" size="2">The probabilities of <i>extremely wet</i> conditions from observations are small in magnitude and vary from 0 to 2%. Maximum probabilities are evident over some limited areas of the eastern Black Sea basin, northeastern Anatolia and western Mediterranean coasts (<a href="/img/revistas/atm/v28n2/a2f4.jpg" target="_blank">Fig. 4g</a>). According to the results of the logistic model based on the <i>control</i> scenario, except in the sub&#45;regions of the western Black Sea basin, the probabilities are very small (<a href="/img/revistas/atm/v28n2/a2f5.jpg" target="_blank">Fig. 5g</a>). In addition, the results of logistic models based on the IPCC SRES A2 and B2 agree with the results of the logistic model based on the <i>control</i> scenario, indicating that in the future, probabilities of <i>extremely wet</i> conditions will decrease in the entire country (<a href="/img/revistas/atm/v28n2/a2f6.jpg" target="_blank">Figs. 6g</a> and <a href="/img/revistas/atm/v28n2/a2f7.jpg" target="_blank">7g</a>).</font></p>  	    <p align="justify"><font face="verdana" size="2">&nbsp;</font></p>  	    ]]></body>
<body><![CDATA[<p align="justify"><font face="verdana" size="2"><b>4. Conclusions</b></font></p>  	    <p align="justify"><font face="verdana" size="2">Climate change impacts on future weather and climate are traditionally evaluated by running general circulation models in the various socio&#45;economic scenarios. However, simulations of the GCMs at coarse grids may yield large uncertainties in climate variables. For instance, changes in global climate give rise to large uncertainties when determining its impacts on regional precipitation regimes, such as drought and wet conditions and their variability (Tatli, 2014). Downscaling techniques can provide an answer to these problems.</font></p>  	    <p align="justify"><font face="verdana" size="2">At country level, downscaling drought and wet conditions is a very important challenge, especially in management plans of water resources, energy, natural disasters, agriculture and forestry. Drought conditions often cause serious damage and negatively affect various socio&#45;economical activities. For example, they can lead to decreased crop yields and reduced fresh water resources.</font></p>  	    <p align="justify"><font face="verdana" size="2">Traditionally, downscaled precipitation is used to estimate the SPI. However, it is easier to down&#45;scale the drought classes than precipitation itself. In addition, one may employ much more sophisticated downscaling processes for selecting the appropriate predictors (e.g., Tatli <i>etal.,</i> 2004; Pryor <i>etal.,</i> 2005; Tatli, 2007, 2013).</font></p>  	    <p align="justify"><font face="verdana" size="2">Since the downscaling model based on logistic regression suggested in this study uses the large&#45;scale predictors directly from the GCMs, it should be regarded as model output statistics.</font></p>  	    <p align="justify"><font face="verdana" size="2">In this study, the risks of drought and extreme wet conditions under climate change scenarios are assessed by means of statistical downscaling. According to the logistic models applied, the results are more sensitive to the predictors obtained from large&#45;scale GCMs, while boundary conditions coming from these are sensitive, as in the dynamical&#45;downscaling procedure. The applied logistic models produce satisfactory statistical results when compared with observations. The probabilistic patterns of the results are statistically acceptable, since they capture the main features of the local&#45;scale climate. Since the main goal of downscaling is to determine the effects of large&#45;scale climatic changes on the local&#45;scale variables, the proposed model based on logistic regression produces acceptable statistical results.</font></p>  	    <p align="justify"><font face="verdana" size="2">Additionally, the results reveal that the down&#45;scaled&#45;probabilities of <i>very wet</i> and <i>extremely wet</i> conditions will decrease in the future for almost all three scenarios. However, there are some exceptions. In the future, the probabilities of <i>near&#45;normal</i> conditions will decrease in the BLS basin and relatively increase in rainfall regions of the MRT and CEAN.</font></p>  	    <p align="justify"><font face="verdana" size="2">&nbsp;</font></p>  	    <p align="justify"><font face="verdana" size="2"><b>Acknowledgments</b></font></p>  	    <p align="justify"><font face="verdana" size="2">The author acknowledges the anonymous referees for their valuable and constructive suggestions.</font></p>  	    ]]></body>
<body><![CDATA[<p align="justify"><font face="verdana" size="2">&nbsp;</font></p>  	    <p align="justify"><font face="verdana" size="2"><b>References</b></font></p>  	    <!-- ref --><p align="justify"><font face="verdana" size="2">Aldrich J. H. and F. D. Nelson, 1984. <i>Linear probability, logit, andprobit models.</i> Sage, Beverly Hills, Ca, 96 pp.    &nbsp;&nbsp;&nbsp;&nbsp;&nbsp;&nbsp;&nbsp;&nbsp;[&#160;<a href="javascript:void(0);" onclick="javascript: window.open('/scielo.php?script=sci_nlinks&ref=1311869&pid=S0187-6236201500020000200001&lng=','','width=640,height=500,resizable=yes,scrollbars=1,menubar=yes,');">Links</a>&#160;]<!-- end-ref --></font></p>  	    <!-- ref --><p align="justify"><font face="verdana" size="2">Anandhi A., V. V. Srinivas, R. S. Nanjundiah and D. N. Kumar, 2008. Downscaling precipitation to river basin in India for IPCC SRES scenarios using support vector machine. <i>Int. J. Climatol.</i> <b>28,</b> 401&#45;420.    &nbsp;&nbsp;&nbsp;&nbsp;&nbsp;&nbsp;&nbsp;&nbsp;[&#160;<a href="javascript:void(0);" onclick="javascript: window.open('/scielo.php?script=sci_nlinks&ref=1311871&pid=S0187-6236201500020000200002&lng=','','width=640,height=500,resizable=yes,scrollbars=1,menubar=yes,');">Links</a>&#160;]<!-- end-ref --></font></p>  	    <!-- ref --><p align="justify"><font face="verdana" size="2">Bowman K. O. and L. R. Shenton, 1988. <i>Properties of estimators for the gamma distribution.</i> Marcel Dekker, New York, 269 pp.    &nbsp;&nbsp;&nbsp;&nbsp;&nbsp;&nbsp;&nbsp;&nbsp;[&#160;<a href="javascript:void(0);" onclick="javascript: window.open('/scielo.php?script=sci_nlinks&ref=1311873&pid=S0187-6236201500020000200003&lng=','','width=640,height=500,resizable=yes,scrollbars=1,menubar=yes,');">Links</a>&#160;]<!-- end-ref --></font></p>  	    <!-- ref --><p align="justify"><font face="verdana" size="2">Conway D. and P. D. Jones, 1998. The use of weather types and air flow indices for GCM downscaling. <i>J. Hydrometeorol.</i> <b>212&#45;213,</b> 348&#45;361.    &nbsp;&nbsp;&nbsp;&nbsp;&nbsp;&nbsp;&nbsp;&nbsp;[&#160;<a href="javascript:void(0);" onclick="javascript: window.open('/scielo.php?script=sci_nlinks&ref=1311875&pid=S0187-6236201500020000200004&lng=','','width=640,height=500,resizable=yes,scrollbars=1,menubar=yes,');">Links</a>&#160;]<!-- end-ref --></font></p>  	    ]]></body>
<body><![CDATA[<!-- ref --><p align="justify"><font face="verdana" size="2">Coulibaly P., Y. B. Dibike and F. Anctil, 2005. Downscaling precipitation and temperature with temporal neural networks. <i>J. Hydrometeorol.</i> <b>6,</b> 483&#45;496.    &nbsp;&nbsp;&nbsp;&nbsp;&nbsp;&nbsp;&nbsp;&nbsp;[&#160;<a href="javascript:void(0);" onclick="javascript: window.open('/scielo.php?script=sci_nlinks&ref=1311877&pid=S0187-6236201500020000200005&lng=','','width=640,height=500,resizable=yes,scrollbars=1,menubar=yes,');">Links</a>&#160;]<!-- end-ref --></font></p>  	    <!-- ref --><p align="justify"><font face="verdana" size="2">Dibike Y. B. and P. Coulibaly, 2006. Temporal neural networks for downscaling climate variability and extremes. <i>Neural Networks</i> <b>19,</b> 135&#45;144.    &nbsp;&nbsp;&nbsp;&nbsp;&nbsp;&nbsp;&nbsp;&nbsp;[&#160;<a href="javascript:void(0);" onclick="javascript: window.open('/scielo.php?script=sci_nlinks&ref=1311879&pid=S0187-6236201500020000200006&lng=','','width=640,height=500,resizable=yes,scrollbars=1,menubar=yes,');">Links</a>&#160;]<!-- end-ref --></font></p>  	    <!-- ref --><p align="justify"><font face="verdana" size="2">Easterling D. R., 1999. Development of regional climate scenarios using a downscaling approach. <i>Climatic</i> <i>Change</i> <b>41,</b> 615&#45;634.    &nbsp;&nbsp;&nbsp;&nbsp;&nbsp;&nbsp;&nbsp;&nbsp;[&#160;<a href="javascript:void(0);" onclick="javascript: window.open('/scielo.php?script=sci_nlinks&ref=1311881&pid=S0187-6236201500020000200007&lng=','','width=640,height=500,resizable=yes,scrollbars=1,menubar=yes,');">Links</a>&#160;]<!-- end-ref --></font></p>  	    <!-- ref --><p align="justify"><font face="verdana" size="2">Flato G. M., G. J. Boer, W. G. Lee, N. A. McFarlane, D. Ramsden, M. C. Reader and A. J. Weaver, 2000. The Canadian Centre for Climate Modelling and analysis global coupled model and its climate. <i>Clim. Dyna.</i> <b>16,</b> 451&#45;467.    &nbsp;&nbsp;&nbsp;&nbsp;&nbsp;&nbsp;&nbsp;&nbsp;[&#160;<a href="javascript:void(0);" onclick="javascript: window.open('/scielo.php?script=sci_nlinks&ref=1311883&pid=S0187-6236201500020000200008&lng=','','width=640,height=500,resizable=yes,scrollbars=1,menubar=yes,');">Links</a>&#160;]<!-- end-ref --></font></p>  	    <!-- ref --><p align="justify"><font face="verdana" size="2">Fowler H. J., S. Blenkinsop and C. Tebaldi, 2007. Linking climate change modeling to impacts studies: Recent advances in downscaling techniques for hydrological modeling. <i>Int. J. Climatol.</i> <b>27,</b> 1547&#45;1578.    &nbsp;&nbsp;&nbsp;&nbsp;&nbsp;&nbsp;&nbsp;&nbsp;[&#160;<a href="javascript:void(0);" onclick="javascript: window.open('/scielo.php?script=sci_nlinks&ref=1311885&pid=S0187-6236201500020000200009&lng=','','width=640,height=500,resizable=yes,scrollbars=1,menubar=yes,');">Links</a>&#160;]<!-- end-ref --></font></p>  	    ]]></body>
<body><![CDATA[<!-- ref --><p align="justify"><font face="verdana" size="2">Guttman N. B., 1998. Comparing the Palmer drought index and the standardized precipitation index. <i>J.Am. Water. Resour. As.</i> <b>34</b>,113&#45;121.    &nbsp;&nbsp;&nbsp;&nbsp;&nbsp;&nbsp;&nbsp;&nbsp;[&#160;<a href="javascript:void(0);" onclick="javascript: window.open('/scielo.php?script=sci_nlinks&ref=1311887&pid=S0187-6236201500020000200010&lng=','','width=640,height=500,resizable=yes,scrollbars=1,menubar=yes,');">Links</a>&#160;]<!-- end-ref --></font></p>  	    <!-- ref --><p align="justify"><font face="verdana" size="2">Guttman N. B., 1999. Accepting the standardized precipitation index: a calculation algorithm. <i>J. Am. Water. Resour. As.</i> <b>35,</b> 311&#45;322.    &nbsp;&nbsp;&nbsp;&nbsp;&nbsp;&nbsp;&nbsp;&nbsp;[&#160;<a href="javascript:void(0);" onclick="javascript: window.open('/scielo.php?script=sci_nlinks&ref=1311889&pid=S0187-6236201500020000200011&lng=','','width=640,height=500,resizable=yes,scrollbars=1,menubar=yes,');">Links</a>&#160;]<!-- end-ref --></font></p>  	    <!-- ref --><p align="justify"><font face="verdana" size="2">Hay L. E. and M. P. Clark, 2003. Use of statistically and dynamically downscaled atmospheric model output for hydrologic simulations in three mountainous basins in the western United States. <i>J. Hydrol.</i> <b>282,</b> 56&#45;75.    &nbsp;&nbsp;&nbsp;&nbsp;&nbsp;&nbsp;&nbsp;&nbsp;[&#160;<a href="javascript:void(0);" onclick="javascript: window.open('/scielo.php?script=sci_nlinks&ref=1311891&pid=S0187-6236201500020000200012&lng=','','width=640,height=500,resizable=yes,scrollbars=1,menubar=yes,');">Links</a>&#160;]<!-- end-ref --></font></p>  	    <!-- ref --><p align="justify"><font face="verdana" size="2">Hayes M. J., M. D. Svoboda, D. A. Wilhite and O. V. Vanyarkho, 1999. Monitoring the 1996 drought using the standardized precipitation index. <i>B. Am. Meteorol. Soc.</i> <b>80,</b> 429&#45;438.    &nbsp;&nbsp;&nbsp;&nbsp;&nbsp;&nbsp;&nbsp;&nbsp;[&#160;<a href="javascript:void(0);" onclick="javascript: window.open('/scielo.php?script=sci_nlinks&ref=1311893&pid=S0187-6236201500020000200013&lng=','','width=640,height=500,resizable=yes,scrollbars=1,menubar=yes,');">Links</a>&#160;]<!-- end-ref --></font></p>  	    <!-- ref --><p align="justify"><font face="verdana" size="2">Hertig E. and J. Jacobeit, 2008. Downscaling future climate change: Temperature scenarios for the Mediterranean area. <i>Glob. Plan. Change</i> <b>63,</b> 127&#45;131</font>&nbsp;&nbsp;&nbsp;&nbsp;&nbsp;&nbsp;&nbsp;&nbsp;[&#160;<a href="javascript:void(0);" onclick="javascript: window.open('/scielo.php?script=sci_nlinks&ref=1311895&pid=S0187-6236201500020000200014&lng=','','width=640,height=500,resizable=yes,scrollbars=1,menubar=yes,');">Links</a>&#160;]<!-- end-ref --><!-- ref --><p align="justify"><font face="verdana" size="2">Huth R., J. Kysely and L. Pokorna, 2000. A GCM simulation of heat waves, dry spells, and their relationships to circulation. <i>Climatic Change</i> <b>46,</b> 29&#45;60.    &nbsp;&nbsp;&nbsp;&nbsp;&nbsp;&nbsp;&nbsp;&nbsp;[&#160;<a href="javascript:void(0);" onclick="javascript: window.open('/scielo.php?script=sci_nlinks&ref=1311896&pid=S0187-6236201500020000200015&lng=','','width=640,height=500,resizable=yes,scrollbars=1,menubar=yes,');">Links</a>&#160;]<!-- end-ref --></font></p>  	    <!-- ref --><p align="justify"><font face="verdana" size="2">IPCC, 2000. <i>Special report on emissions scenarios.</i> A special report of Working Group III of the Intergovernmental Panel on Climate Change (N. Nakicenovic, J. Alcamo, G. Davis, B. de Vries, J. Fenhann, S. Gaffin, K. Gregory, A. Griibler, T. Yong Jung, T. Kram, E. Lebre La Rovere, L. Michaelis, S. Mori, T. Morita, W. Pepper, H. Pitcher, L. Price, K. Riahi, A. Roehrl, H. Holger Rogner, A. Sankovski, M. Schlesinger, P. Shukla, S. Smith, R. Swart, S. van Rooijen, N. Victor and Z. Dadi, Eds.). Cambridge University Press, 599 pp.    &nbsp;&nbsp;&nbsp;&nbsp;&nbsp;&nbsp;&nbsp;&nbsp;[&#160;<a href="javascript:void(0);" onclick="javascript: window.open('/scielo.php?script=sci_nlinks&ref=1311898&pid=S0187-6236201500020000200016&lng=','','width=640,height=500,resizable=yes,scrollbars=1,menubar=yes,');">Links</a>&#160;]<!-- end-ref --></font></p>  	    <!-- ref --><p align="justify"><font face="verdana" size="2">IPCC, 2001. <i>Climate Change 2001: The Scientific Basis.</i> Contribution of Working Group I to the Third Assessment Report of the Intergovernmental Panel on Climate Change (J. T. Houghton, Y. Ding, D. J. Griggs, M. Noguer, P. J. van der Linden, X. Dai, K. Maskell, and C. A. Johnson, Eds.). Cambridge University Press, 881 pp.    &nbsp;&nbsp;&nbsp;&nbsp;&nbsp;&nbsp;&nbsp;&nbsp;[&#160;<a href="javascript:void(0);" onclick="javascript: window.open('/scielo.php?script=sci_nlinks&ref=1311900&pid=S0187-6236201500020000200017&lng=','','width=640,height=500,resizable=yes,scrollbars=1,menubar=yes,');">Links</a>&#160;]<!-- end-ref --></font></p>  	    <!-- ref --><p align="justify"><font face="verdana" size="2">IPCC, 2007. <i>Climate change 2007: The physical science basis.</i> Contribution of Working Group I to the Fourth Assessment Report of the Intergovernmental Panel on Climate Change (S. Solomon, D. Qin, M. Manning, Z. Chen, M. Marquis, K. B. Averyt, M. Tignor and H. L. Miller, Eds.). Cambridge University Press, 996 pp.    &nbsp;&nbsp;&nbsp;&nbsp;&nbsp;&nbsp;&nbsp;&nbsp;[&#160;<a href="javascript:void(0);" onclick="javascript: window.open('/scielo.php?script=sci_nlinks&ref=1311902&pid=S0187-6236201500020000200018&lng=','','width=640,height=500,resizable=yes,scrollbars=1,menubar=yes,');">Links</a>&#160;]<!-- end-ref --></font></p>  	    <!-- ref --><p align="justify"><font face="verdana" size="2">Karl T. R., W. C. Wang, M. E. Schlesinger, R. W. Knight and D. Portman, 1990. A method of relating general circulation model simulated climate to the observed local climate. Part I: Seasonal statistics. <i>J. Climate</i> <b>3,</b> 1053&#45;1079.    &nbsp;&nbsp;&nbsp;&nbsp;&nbsp;&nbsp;&nbsp;&nbsp;[&#160;<a href="javascript:void(0);" onclick="javascript: window.open('/scielo.php?script=sci_nlinks&ref=1311904&pid=S0187-6236201500020000200019&lng=','','width=640,height=500,resizable=yes,scrollbars=1,menubar=yes,');">Links</a>&#160;]<!-- end-ref --></font></p>  	    <!-- ref --><p align="justify"><font face="verdana" size="2">Kleinbaum D. G. and M. Klein, 2002. <i>Logistic regression.</i> Springer&#45;Verlag, Berlin, New York, London, 701 pp.    &nbsp;&nbsp;&nbsp;&nbsp;&nbsp;&nbsp;&nbsp;&nbsp;[&#160;<a href="javascript:void(0);" onclick="javascript: window.open('/scielo.php?script=sci_nlinks&ref=1311906&pid=S0187-6236201500020000200020&lng=','','width=640,height=500,resizable=yes,scrollbars=1,menubar=yes,');">Links</a>&#160;]<!-- end-ref --></font></p>  	    <!-- ref --><p align="justify"><font face="verdana" size="2">Kocak K., L. Saylan and J. Eitzinger, 2004. Nonlinear prediction of near&#45;surface temperature via univariate and multivariate time series embedding. <i>Ecol. Model.</i> <b>173,</b> 1&#45;7.    &nbsp;&nbsp;&nbsp;&nbsp;&nbsp;&nbsp;&nbsp;&nbsp;[&#160;<a href="javascript:void(0);" onclick="javascript: window.open('/scielo.php?script=sci_nlinks&ref=1311908&pid=S0187-6236201500020000200021&lng=','','width=640,height=500,resizable=yes,scrollbars=1,menubar=yes,');">Links</a>&#160;]<!-- end-ref --></font></p>  	    <!-- ref --><p align="justify"><font face="verdana" size="2">Livezey R. E., 2003. Categorical events. In: <i>Forecast verification: Practitioner's guide in atmospheric science</i> (I. T. Jolliffe and D. B. Stephenson, Eds.). John Wiley and Sons, 77&#45;96.    &nbsp;&nbsp;&nbsp;&nbsp;&nbsp;&nbsp;&nbsp;&nbsp;[&#160;<a href="javascript:void(0);" onclick="javascript: window.open('/scielo.php?script=sci_nlinks&ref=1311910&pid=S0187-6236201500020000200022&lng=','','width=640,height=500,resizable=yes,scrollbars=1,menubar=yes,');">Links</a>&#160;]<!-- end-ref --></font></p>  	    <!-- ref --><p align="justify"><font face="verdana" size="2">Loukas A., L. Vasiliades and J. Tzabiras, 2008. Climate change effects on drought severity. <i>Adv. Geosci.</i> <b>17,</b> 23&#45;29.    &nbsp;&nbsp;&nbsp;&nbsp;&nbsp;&nbsp;&nbsp;&nbsp;[&#160;<a href="javascript:void(0);" onclick="javascript: window.open('/scielo.php?script=sci_nlinks&ref=1311912&pid=S0187-6236201500020000200023&lng=','','width=640,height=500,resizable=yes,scrollbars=1,menubar=yes,');">Links</a>&#160;]<!-- end-ref --></font></p>  	    <!-- ref --><p align="justify"><font face="verdana" size="2">Mascaro G., R. Deidda and E. R. Vivoni, 2008. A new verification method to ensure consistent ensemble forecasts through calibrated precipitation downscaling models. <i>Mon. Weather Rev.</i> <b>136,</b> 3374&#45;3391.    &nbsp;&nbsp;&nbsp;&nbsp;&nbsp;&nbsp;&nbsp;&nbsp;[&#160;<a href="javascript:void(0);" onclick="javascript: window.open('/scielo.php?script=sci_nlinks&ref=1311914&pid=S0187-6236201500020000200024&lng=','','width=640,height=500,resizable=yes,scrollbars=1,menubar=yes,');">Links</a>&#160;]<!-- end-ref --></font></p>  	    <!-- ref --><p align="justify"><font face="verdana" size="2">McKee T. B., N. J. Doesken and J. Kleist, 1993. The relationship of drought frequency and duration of time scales. Proceedings of the Eighth Conference on Applied Climatology, American Meteorological Society, Anaheim, Ca, 179&#45;186.    &nbsp;&nbsp;&nbsp;&nbsp;&nbsp;&nbsp;&nbsp;&nbsp;[&#160;<a href="javascript:void(0);" onclick="javascript: window.open('/scielo.php?script=sci_nlinks&ref=1311916&pid=S0187-6236201500020000200025&lng=','','width=640,height=500,resizable=yes,scrollbars=1,menubar=yes,');">Links</a>&#160;]<!-- end-ref --></font></p>  	    <!-- ref --><p align="justify"><font face="verdana" size="2">McKee T. B., N. J. Doesken and J. Kleist, 1995. Drought monitoring with multiple time scales. Proceedings of the Ninth Conference on Applied Climatology, Dallas, Tx, American Meteorological Society, 233&#45;236.    &nbsp;&nbsp;&nbsp;&nbsp;&nbsp;&nbsp;&nbsp;&nbsp;[&#160;<a href="javascript:void(0);" onclick="javascript: window.open('/scielo.php?script=sci_nlinks&ref=1311918&pid=S0187-6236201500020000200026&lng=','','width=640,height=500,resizable=yes,scrollbars=1,menubar=yes,');">Links</a>&#160;]<!-- end-ref --></font></p>  	    <!-- ref --><p align="justify"><font face="verdana" size="2">Menard S., 1995. <i>Applied logistic regression analysis.</i> Sage, Thousand Oaks, Ca, 128 pp.    &nbsp;&nbsp;&nbsp;&nbsp;&nbsp;&nbsp;&nbsp;&nbsp;[&#160;<a href="javascript:void(0);" onclick="javascript: window.open('/scielo.php?script=sci_nlinks&ref=1311920&pid=S0187-6236201500020000200027&lng=','','width=640,height=500,resizable=yes,scrollbars=1,menubar=yes,');">Links</a>&#160;]<!-- end-ref --></font></p>  	    <!-- ref --><p align="justify"><font face="verdana" size="2">Mishra A. K., M. &Ouml;zger and V. P. Singh, 2009. Trend and persistence of precipitation under climate change scenarios for Kansabati basin, India. <i>Hydrol. Process.</i> <b>23,</b> 2345&#45;2357.    &nbsp;&nbsp;&nbsp;&nbsp;&nbsp;&nbsp;&nbsp;&nbsp;[&#160;<a href="javascript:void(0);" onclick="javascript: window.open('/scielo.php?script=sci_nlinks&ref=1311922&pid=S0187-6236201500020000200028&lng=','','width=640,height=500,resizable=yes,scrollbars=1,menubar=yes,');">Links</a>&#160;]<!-- end-ref --></font></p>  	    <!-- ref --><p align="justify"><font face="verdana" size="2">Mishra A. K. and V. P. Singh, 2009. Analysis of drought severity&#45;area&#45;frequency curves using a general circulation model and scenario uncertainty. <i>J. Geophys. Res.</i> <b>114,</b> D06120, doi:10.1029/2008JD010986.    &nbsp;&nbsp;&nbsp;&nbsp;&nbsp;&nbsp;&nbsp;&nbsp;[&#160;<a href="javascript:void(0);" onclick="javascript: window.open('/scielo.php?script=sci_nlinks&ref=1311924&pid=S0187-6236201500020000200029&lng=','','width=640,height=500,resizable=yes,scrollbars=1,menubar=yes,');">Links</a>&#160;]<!-- end-ref --></font></p>  	    <!-- ref --><p align="justify"><font face="verdana" size="2">Murphy A. H., 1996. The Finley affair: A signal event in the history of forecast verification. <i>Weather Forecast.</i> <b>11,</b> 3&#45;20.    &nbsp;&nbsp;&nbsp;&nbsp;&nbsp;&nbsp;&nbsp;&nbsp;[&#160;<a href="javascript:void(0);" onclick="javascript: window.open('/scielo.php?script=sci_nlinks&ref=1311926&pid=S0187-6236201500020000200030&lng=','','width=640,height=500,resizable=yes,scrollbars=1,menubar=yes,');">Links</a>&#160;]<!-- end-ref --></font></p>  	    <!-- ref --><p align="justify"><font face="verdana" size="2">Prasad K., S. K. Dash and U. C. Mohanty, 2010. A logistic regression approach for monthly rainfall forecasts in meteorological subdivisions of India based on DEMETER retrospective forecasts. <i>Int. J. Climatol.</i> <b>30,</b> 1577&#45;1588.    &nbsp;&nbsp;&nbsp;&nbsp;&nbsp;&nbsp;&nbsp;&nbsp;[&#160;<a href="javascript:void(0);" onclick="javascript: window.open('/scielo.php?script=sci_nlinks&ref=1311928&pid=S0187-6236201500020000200031&lng=','','width=640,height=500,resizable=yes,scrollbars=1,menubar=yes,');">Links</a>&#160;]<!-- end-ref --></font></p>  	    <!-- ref --><p align="justify"><font face="verdana" size="2">Preisler H. K. and A. L. Westerling, 2007. Statistical model for forecasting monthly large wildfire events in western United States. <i>J. Appl. Meteorol. Clim.</i> <b>46,</b> 1020&#45;1030.    &nbsp;&nbsp;&nbsp;&nbsp;&nbsp;&nbsp;&nbsp;&nbsp;[&#160;<a href="javascript:void(0);" onclick="javascript: window.open('/scielo.php?script=sci_nlinks&ref=1311930&pid=S0187-6236201500020000200032&lng=','','width=640,height=500,resizable=yes,scrollbars=1,menubar=yes,');">Links</a>&#160;]<!-- end-ref --></font></p>  	    <!-- ref --><p align="justify"><font face="verdana" size="2">Press W. H., B. P. Flannery, S. A. Teukolsky and W. T. Vetterling, 1992. <i>Numerical recipes in FORTRAN: The art of scientific computing,</i> 2<sup>nd</sup> ed. Cambridge University Press, 1486 pp.    &nbsp;&nbsp;&nbsp;&nbsp;&nbsp;&nbsp;&nbsp;&nbsp;[&#160;<a href="javascript:void(0);" onclick="javascript: window.open('/scielo.php?script=sci_nlinks&ref=1311932&pid=S0187-6236201500020000200033&lng=','','width=640,height=500,resizable=yes,scrollbars=1,menubar=yes,');">Links</a>&#160;]<!-- end-ref --> </font></p> 	    <!-- ref --><p align="justify"><font face="verdana" size="2">Pryor S. C., J. T. Schoof and R. J. Barthelmie, 2005. Empirical downscaling of wind speed probability distributions. <i>J. Geophys. Res.</i> <b>110,</b> D19109, doi:10.1029/2005JD005899.    &nbsp;&nbsp;&nbsp;&nbsp;&nbsp;&nbsp;&nbsp;&nbsp;[&#160;<a href="javascript:void(0);" onclick="javascript: window.open('/scielo.php?script=sci_nlinks&ref=1311934&pid=S0187-6236201500020000200034&lng=','','width=640,height=500,resizable=yes,scrollbars=1,menubar=yes,');">Links</a>&#160;]<!-- end-ref --></font></p>      <!-- ref --><p align="justify"><font face="verdana" size="2">&Ouml;zt&uuml;rk T., H. Altinsoy, M. T&uuml;rkes and M. L. Kurnaz, 2012. Simulation of temperature and precipitation climatology for central Asia CORDEX domain by using RegCM 4.0. <i>Clim. Res.</i> <b>52,</b> 63&#45;76.    &nbsp;&nbsp;&nbsp;&nbsp;&nbsp;&nbsp;&nbsp;&nbsp;[&#160;<a href="javascript:void(0);" onclick="javascript: window.open('/scielo.php?script=sci_nlinks&ref=1311936&pid=S0187-6236201500020000200035&lng=','','width=640,height=500,resizable=yes,scrollbars=1,menubar=yes,');">Links</a>&#160;]<!-- end-ref --></font></p>  	    <!-- ref --><p align="justify"><font face="verdana" size="2">Radu R., M. Deque and S. Somot, 2008. Spectral nudging in a spectral regional climate model. <i>Tellus A</i> <b>60,</b> 898&#45;910.    &nbsp;&nbsp;&nbsp;&nbsp;&nbsp;&nbsp;&nbsp;&nbsp;[&#160;<a href="javascript:void(0);" onclick="javascript: window.open('/scielo.php?script=sci_nlinks&ref=1311938&pid=S0187-6236201500020000200036&lng=','','width=640,height=500,resizable=yes,scrollbars=1,menubar=yes,');">Links</a>&#160;]<!-- end-ref --></font></p>  	    <!-- ref --><p align="justify"><font face="verdana" size="2">Schmith T., 2008. Stationarity of regression relationships: application to empirical downscaling. <i>J. Climate</i> <b>21,</b> 4529&#45;4537</font>&nbsp;&nbsp;&nbsp;&nbsp;&nbsp;&nbsp;&nbsp;&nbsp;[&#160;<a href="javascript:void(0);" onclick="javascript: window.open('/scielo.php?script=sci_nlinks&ref=1311940&pid=S0187-6236201500020000200037&lng=','','width=640,height=500,resizable=yes,scrollbars=1,menubar=yes,');">Links</a>&#160;]<!-- end-ref --><!-- ref --><p align="justify"><font face="verdana" size="2">Semenov M. A. and E. M. Barrow, 1997. Use of a stochastic weather generator in the development of climate change scenarios. <i>Climatic Change</i> <b>35,</b> 397&#45;414.    &nbsp;&nbsp;&nbsp;&nbsp;&nbsp;&nbsp;&nbsp;&nbsp;[&#160;<a href="javascript:void(0);" onclick="javascript: window.open('/scielo.php?script=sci_nlinks&ref=1311941&pid=S0187-6236201500020000200038&lng=','','width=640,height=500,resizable=yes,scrollbars=1,menubar=yes,');">Links</a>&#160;]<!-- end-ref --></font></p>  	    <!-- ref --><p align="justify"><font face="verdana" size="2">Steinemann A., 2003. Drought indicators and triggers: A stochastic approach to evaluation. <i>J. Am. Water.Resour.</i> <i>As.</i> <b>39,</b> 1217&#45;1233.    &nbsp;&nbsp;&nbsp;&nbsp;&nbsp;&nbsp;&nbsp;&nbsp;[&#160;<a href="javascript:void(0);" onclick="javascript: window.open('/scielo.php?script=sci_nlinks&ref=1311943&pid=S0187-6236201500020000200039&lng=','','width=640,height=500,resizable=yes,scrollbars=1,menubar=yes,');">Links</a>&#160;]<!-- end-ref --></font></p>  	    <!-- ref --><p align="justify"><font face="verdana" size="2">Tabachnick B. G. and L. S. Fidell, 1996. <i>Using multivariate statistics.</i> Harper Collins, New York, 1024 pp.    &nbsp;&nbsp;&nbsp;&nbsp;&nbsp;&nbsp;&nbsp;&nbsp;[&#160;<a href="javascript:void(0);" onclick="javascript: window.open('/scielo.php?script=sci_nlinks&ref=1311945&pid=S0187-6236201500020000200040&lng=','','width=640,height=500,resizable=yes,scrollbars=1,menubar=yes,');">Links</a>&#160;]<!-- end-ref --></font></p>  	    ]]></body>
<body><![CDATA[<!-- ref --><p align="justify"><font face="verdana" size="2">Tatli H., H. N. Dalfes and S. S. Mentes, 2004. A statistical downscaling method for monthly total precipitation over Turkey. <i>Int. J. Climatol.</i> <b>24,</b> 161&#45;180.    &nbsp;&nbsp;&nbsp;&nbsp;&nbsp;&nbsp;&nbsp;&nbsp;[&#160;<a href="javascript:void(0);" onclick="javascript: window.open('/scielo.php?script=sci_nlinks&ref=1311947&pid=S0187-6236201500020000200041&lng=','','width=640,height=500,resizable=yes,scrollbars=1,menubar=yes,');">Links</a>&#160;]<!-- end-ref --></font></p>  	    <!-- ref --><p align="justify"><font face="verdana" size="2">Tatli H., H. N. Dalfes and S. S. Mentes, 2005. Surface air temperature variability over Turkey and its connection to large&#45;scale upper air circulation via multivariate techniques. <i>Int. J. Climatol.</i> <b>25,</b> 331&#45;350.    &nbsp;&nbsp;&nbsp;&nbsp;&nbsp;&nbsp;&nbsp;&nbsp;[&#160;<a href="javascript:void(0);" onclick="javascript: window.open('/scielo.php?script=sci_nlinks&ref=1311949&pid=S0187-6236201500020000200042&lng=','','width=640,height=500,resizable=yes,scrollbars=1,menubar=yes,');">Links</a>&#160;]<!-- end-ref --></font></p>  	    <!-- ref --><p align="justify"><font face="verdana" size="2">Tatli H., 2007. Synchronization between the North Sea&#45;Caspian pattern (NCP) and surface air temperatures in NCEP. <i>Int. J. Climatol.</i> <b>27,</b> 1171&#45;1187.    &nbsp;&nbsp;&nbsp;&nbsp;&nbsp;&nbsp;&nbsp;&nbsp;[&#160;<a href="javascript:void(0);" onclick="javascript: window.open('/scielo.php?script=sci_nlinks&ref=1311951&pid=S0187-6236201500020000200043&lng=','','width=640,height=500,resizable=yes,scrollbars=1,menubar=yes,');">Links</a>&#160;]<!-- end-ref --></font></p>  	    <!-- ref --><p align="justify"><font face="verdana" size="2">Tatli H. and M. T&uuml;rke&#351;, 2011. Empirical orthogonal function analysis of the Palmer drought indices. <i>Agr. Forest. Meteorol.</i> <b>151,</b> 981&#45;991, doi:10.1016/j.agrformet.2011.03.004.    &nbsp;&nbsp;&nbsp;&nbsp;&nbsp;&nbsp;&nbsp;&nbsp;[&#160;<a href="javascript:void(0);" onclick="javascript: window.open('/scielo.php?script=sci_nlinks&ref=1311953&pid=S0187-6236201500020000200044&lng=','','width=640,height=500,resizable=yes,scrollbars=1,menubar=yes,');">Links</a>&#160;]<!-- end-ref --></font></p>  	    <!-- ref --><p align="justify"><font face="verdana" size="2">Tatli H., 2013. <i>Statistical downscaling and applications.</i> Lap Lambert Academic Publishing, Germany.    &nbsp;&nbsp;&nbsp;&nbsp;&nbsp;&nbsp;&nbsp;&nbsp;[&#160;<a href="javascript:void(0);" onclick="javascript: window.open('/scielo.php?script=sci_nlinks&ref=1311955&pid=S0187-6236201500020000200045&lng=','','width=640,height=500,resizable=yes,scrollbars=1,menubar=yes,');">Links</a>&#160;]<!-- end-ref --></font></p>  	    ]]></body>
<body><![CDATA[<!-- ref --><p align="justify"><font face="verdana" size="2">Tatli H., 2014. Statistical complexity in daily precipitation of NCEP/NCAR reanalysis over the Mediterranean basin. <i>Int. J. Climatol.</i> <b>34,</b> 155&#45;161.    &nbsp;&nbsp;&nbsp;&nbsp;&nbsp;&nbsp;&nbsp;&nbsp;[&#160;<a href="javascript:void(0);" onclick="javascript: window.open('/scielo.php?script=sci_nlinks&ref=1311957&pid=S0187-6236201500020000200046&lng=','','width=640,height=500,resizable=yes,scrollbars=1,menubar=yes,');">Links</a>&#160;]<!-- end-ref --></font></p>  	    <!-- ref --><p align="justify"><font face="verdana" size="2">Thom H. C. S., 1966. <i>Some methods of climatological analysis.</i> World Meteorological Organization, Technical Note No. 81, Geneva, Switzerland.    &nbsp;&nbsp;&nbsp;&nbsp;&nbsp;&nbsp;&nbsp;&nbsp;[&#160;<a href="javascript:void(0);" onclick="javascript: window.open('/scielo.php?script=sci_nlinks&ref=1311959&pid=S0187-6236201500020000200047&lng=','','width=640,height=500,resizable=yes,scrollbars=1,menubar=yes,');">Links</a>&#160;]<!-- end-ref --></font></p>  	    <!-- ref --><p align="justify"><font face="verdana" size="2">Timothy D. M. and M. Hulme, 1999. Predicting regional climate change: Living with uncertainty. <i>Prog. Phys. Geog.</i> <b>23,</b> 57&#45;78.    &nbsp;&nbsp;&nbsp;&nbsp;&nbsp;&nbsp;&nbsp;&nbsp;[&#160;<a href="javascript:void(0);" onclick="javascript: window.open('/scielo.php?script=sci_nlinks&ref=1311961&pid=S0187-6236201500020000200048&lng=','','width=640,height=500,resizable=yes,scrollbars=1,menubar=yes,');">Links</a>&#160;]<!-- end-ref --></font></p>  	    <!-- ref --><p align="justify"><font face="verdana" size="2">Tolika K., P. Maheras, M. Vafiadis, H. A. Flocasc and A. Arseni&#45;Papadimitriou, 2007. Simulation of seasonal precipitation and raindays over Greece: A statistical downscaling technique based on artificial neural networks (ANNs). <i>Int. J. Climatol.</i> <b>27,</b> 861&#45;881.    &nbsp;&nbsp;&nbsp;&nbsp;&nbsp;&nbsp;&nbsp;&nbsp;[&#160;<a href="javascript:void(0);" onclick="javascript: window.open('/scielo.php?script=sci_nlinks&ref=1311963&pid=S0187-6236201500020000200049&lng=','','width=640,height=500,resizable=yes,scrollbars=1,menubar=yes,');">Links</a>&#160;]<!-- end-ref --></font></p>  	    <!-- ref --><p align="justify"><font face="verdana" size="2">T&uuml;rkes M. and H. Tatli, 2009. Use of the standardized precipitation index (SPI) and a modified SPI for shaping the drought probabilities over Turkey. <i>Int. J. Climatol.</i> <b>29,</b> 2270&#45;2282.    &nbsp;&nbsp;&nbsp;&nbsp;&nbsp;&nbsp;&nbsp;&nbsp;[&#160;<a href="javascript:void(0);" onclick="javascript: window.open('/scielo.php?script=sci_nlinks&ref=1311965&pid=S0187-6236201500020000200050&lng=','','width=640,height=500,resizable=yes,scrollbars=1,menubar=yes,');">Links</a>&#160;]<!-- end-ref --></font></p>  	    ]]></body>
<body><![CDATA[<!-- ref --><p align="justify"><font face="verdana" size="2">T&uuml;rke&#351; M. and H. Tatli, 2011. Use of the spectral clustering to determine coherent precipitation regions in Turkey for the period 1929&#45;2007. <i>Int. J. Climatol.</i> <b>31,</b> 2055&#45;2067.    &nbsp;&nbsp;&nbsp;&nbsp;&nbsp;&nbsp;&nbsp;&nbsp;[&#160;<a href="javascript:void(0);" onclick="javascript: window.open('/scielo.php?script=sci_nlinks&ref=1311967&pid=S0187-6236201500020000200051&lng=','','width=640,height=500,resizable=yes,scrollbars=1,menubar=yes,');">Links</a>&#160;]<!-- end-ref --></font></p>  	    <!-- ref --><p align="justify"><font face="verdana" size="2">Vasiliades L., A. Loukas and G. Patsonas, 2009. Evaluation of a statistical downscaling procedure for the estimation of climate change impacts on droughts. <i>Nat. Hazards Earth Sys. Sci.</i> <b>9,</b> 879&#45;894.    &nbsp;&nbsp;&nbsp;&nbsp;&nbsp;&nbsp;&nbsp;&nbsp;[&#160;<a href="javascript:void(0);" onclick="javascript: window.open('/scielo.php?script=sci_nlinks&ref=1311969&pid=S0187-6236201500020000200052&lng=','','width=640,height=500,resizable=yes,scrollbars=1,menubar=yes,');">Links</a>&#160;]<!-- end-ref --></font></p>  	    <!-- ref --><p align="justify"><font face="verdana" size="2">Wilby R. L. and T. M. L. Wigley, 1997. Downscaling general circulation model output: A review of methods and limitations. <i>Prog. Phys. Geog.</i> <b>21,</b> 530&#45;548.    &nbsp;&nbsp;&nbsp;&nbsp;&nbsp;&nbsp;&nbsp;&nbsp;[&#160;<a href="javascript:void(0);" onclick="javascript: window.open('/scielo.php?script=sci_nlinks&ref=1311971&pid=S0187-6236201500020000200053&lng=','','width=640,height=500,resizable=yes,scrollbars=1,menubar=yes,');">Links</a>&#160;]<!-- end-ref --></font></p>  	    <!-- ref --><p align="justify"><font face="verdana" size="2">Wilby R. L., T. M. L. Wigley, D. Conway, P. D. Jones, B. C. Hewitson, J. Main and D. S. Wilks, 1998. Statistical downscaling of general circulation model output: A comparison of methods. <i>Water Resour. Res.</i> <b>34,</b> 2995&#45;3008.    &nbsp;&nbsp;&nbsp;&nbsp;&nbsp;&nbsp;&nbsp;&nbsp;[&#160;<a href="javascript:void(0);" onclick="javascript: window.open('/scielo.php?script=sci_nlinks&ref=1311973&pid=S0187-6236201500020000200054&lng=','','width=640,height=500,resizable=yes,scrollbars=1,menubar=yes,');">Links</a>&#160;]<!-- end-ref --></font></p>  	    <!-- ref --><p align="justify"><font face="verdana" size="2">Wilby R. L., L. E. Hay and G. H. Leavesley, 1999. A comparison of downscaled and raw GCM output: Implications for climate change scenarios in the San Juan River basin, Colorado. <i>J. Hydrol.</i> <b>225,</b> 67&#45;91.    &nbsp;&nbsp;&nbsp;&nbsp;&nbsp;&nbsp;&nbsp;&nbsp;[&#160;<a href="javascript:void(0);" onclick="javascript: window.open('/scielo.php?script=sci_nlinks&ref=1311975&pid=S0187-6236201500020000200055&lng=','','width=640,height=500,resizable=yes,scrollbars=1,menubar=yes,');">Links</a>&#160;]<!-- end-ref --></font></p>  	    ]]></body>
<body><![CDATA[<!-- ref --><p align="justify"><font face="verdana" size="2">Wilhelmi O. V. and D. A. Wilhite, 2002. Assessing vulnerability to agricultural drought: A Nebraska case study. <i>Nat. Hazards</i> <b>25,</b> 37&#45;58.    &nbsp;&nbsp;&nbsp;&nbsp;&nbsp;&nbsp;&nbsp;&nbsp;[&#160;<a href="javascript:void(0);" onclick="javascript: window.open('/scielo.php?script=sci_nlinks&ref=1311977&pid=S0187-6236201500020000200056&lng=','','width=640,height=500,resizable=yes,scrollbars=1,menubar=yes,');">Links</a>&#160;]<!-- end-ref --></font></p>  	    <!-- ref --><p align="justify"><font face="verdana" size="2">Wilks D. S., 1995. <i>Statistical methods in the atmospheric sciences: An introduction.</i> Academic Press, New York, 704 pp.    &nbsp;&nbsp;&nbsp;&nbsp;&nbsp;&nbsp;&nbsp;&nbsp;[&#160;<a href="javascript:void(0);" onclick="javascript: window.open('/scielo.php?script=sci_nlinks&ref=1311979&pid=S0187-6236201500020000200057&lng=','','width=640,height=500,resizable=yes,scrollbars=1,menubar=yes,');">Links</a>&#160;]<!-- end-ref --></font></p>  	    <!-- ref --><p align="justify"><font face="verdana" size="2">Wu H., M. J. Hayes, D. A. Wilhite and M. D. Svoboda, 2005. The effect of the length of record on the standardized precipitation index calculation. <i>Int. J. Climatol.</i> <b>25,</b> 505&#45;520.    &nbsp;&nbsp;&nbsp;&nbsp;&nbsp;&nbsp;&nbsp;&nbsp;[&#160;<a href="javascript:void(0);" onclick="javascript: window.open('/scielo.php?script=sci_nlinks&ref=1311981&pid=S0187-6236201500020000200058&lng=','','width=640,height=500,resizable=yes,scrollbars=1,menubar=yes,');">Links</a>&#160;]<!-- end-ref --></font></p>      ]]></body><back>
<ref-list>
<ref id="B1">
<nlm-citation citation-type="book">
<person-group person-group-type="author">
<name>
<surname><![CDATA[Aldrich]]></surname>
<given-names><![CDATA[J. H.]]></given-names>
</name>
<name>
<surname><![CDATA[Nelson]]></surname>
<given-names><![CDATA[F. D.]]></given-names>
</name>
</person-group>
<source><![CDATA[Linear probability, logit, andprobit models]]></source>
<year>1984</year>
<page-range>96</page-range><publisher-loc><![CDATA[Beverly Hills^eCa Ca]]></publisher-loc>
<publisher-name><![CDATA[Sage]]></publisher-name>
</nlm-citation>
</ref>
<ref id="B2">
<nlm-citation citation-type="journal">
<person-group person-group-type="author">
<name>
<surname><![CDATA[Anandhi]]></surname>
<given-names><![CDATA[A.]]></given-names>
</name>
<name>
<surname><![CDATA[Srinivas]]></surname>
<given-names><![CDATA[V. V.]]></given-names>
</name>
<name>
<surname><![CDATA[Nanjundiah]]></surname>
<given-names><![CDATA[R. S.]]></given-names>
</name>
<name>
<surname><![CDATA[Kumar]]></surname>
<given-names><![CDATA[D. N.]]></given-names>
</name>
</person-group>
<article-title xml:lang="en"><![CDATA[Downscaling precipitation to river basin in India for IPCC SRES scenarios using support vector machine]]></article-title>
<source><![CDATA[Int. J. Climatol.]]></source>
<year>2008</year>
<volume>28</volume>
<page-range>401-420</page-range></nlm-citation>
</ref>
<ref id="B3">
<nlm-citation citation-type="book">
<person-group person-group-type="author">
<name>
<surname><![CDATA[Bowman]]></surname>
<given-names><![CDATA[K. O.]]></given-names>
</name>
<name>
<surname><![CDATA[Shenton]]></surname>
<given-names><![CDATA[L. R.]]></given-names>
</name>
</person-group>
<source><![CDATA[Properties of estimators for the gamma distribution]]></source>
<year>1988</year>
<page-range>269</page-range><publisher-loc><![CDATA[New York ]]></publisher-loc>
<publisher-name><![CDATA[Marcel Dekker]]></publisher-name>
</nlm-citation>
</ref>
<ref id="B4">
<nlm-citation citation-type="journal">
<person-group person-group-type="author">
<name>
<surname><![CDATA[Conway]]></surname>
<given-names><![CDATA[D.]]></given-names>
</name>
<name>
<surname><![CDATA[Jones]]></surname>
<given-names><![CDATA[P. D.]]></given-names>
</name>
</person-group>
<article-title xml:lang="en"><![CDATA[The use of weather types and air flow indices for GCM downscaling]]></article-title>
<source><![CDATA[J. Hydrometeorol.]]></source>
<year>1998</year>
<volume>212</volume><volume>213</volume>
<page-range>348-361</page-range></nlm-citation>
</ref>
<ref id="B5">
<nlm-citation citation-type="journal">
<person-group person-group-type="author">
<name>
<surname><![CDATA[Coulibaly]]></surname>
<given-names><![CDATA[P.]]></given-names>
</name>
<name>
<surname><![CDATA[Dibike]]></surname>
<given-names><![CDATA[Y. B.]]></given-names>
</name>
<name>
<surname><![CDATA[Anctil]]></surname>
<given-names><![CDATA[F.]]></given-names>
</name>
</person-group>
<article-title xml:lang="en"><![CDATA[Downscaling precipitation and temperature with temporal neural networks]]></article-title>
<source><![CDATA[J. Hydrometeorol.]]></source>
<year>2005</year>
<volume>6</volume>
<page-range>483-496</page-range></nlm-citation>
</ref>
<ref id="B6">
<nlm-citation citation-type="journal">
<person-group person-group-type="author">
<name>
<surname><![CDATA[Dibike]]></surname>
<given-names><![CDATA[Y. B.]]></given-names>
</name>
<name>
<surname><![CDATA[Coulibaly]]></surname>
<given-names><![CDATA[P.]]></given-names>
</name>
</person-group>
<article-title xml:lang="en"><![CDATA[Temporal neural networks for downscaling climate variability and extremes]]></article-title>
<source><![CDATA[Neural Networks]]></source>
<year>2006</year>
<volume>19</volume>
<page-range>135-144</page-range></nlm-citation>
</ref>
<ref id="B7">
<nlm-citation citation-type="journal">
<person-group person-group-type="author">
<name>
<surname><![CDATA[Easterling]]></surname>
<given-names><![CDATA[D. R.]]></given-names>
</name>
</person-group>
<article-title xml:lang="en"><![CDATA[Development of regional climate scenarios using a downscaling approach]]></article-title>
<source><![CDATA[Climatic Change]]></source>
<year>1999</year>
<volume>41</volume>
<page-range>615-634</page-range></nlm-citation>
</ref>
<ref id="B8">
<nlm-citation citation-type="journal">
<person-group person-group-type="author">
<name>
<surname><![CDATA[Flato]]></surname>
<given-names><![CDATA[G. M.]]></given-names>
</name>
<name>
<surname><![CDATA[Boer]]></surname>
<given-names><![CDATA[G. J.]]></given-names>
</name>
<name>
<surname><![CDATA[Lee]]></surname>
<given-names><![CDATA[W. G.]]></given-names>
</name>
<name>
<surname><![CDATA[McFarlane]]></surname>
<given-names><![CDATA[N. A.]]></given-names>
</name>
<name>
<surname><![CDATA[Ramsden]]></surname>
<given-names><![CDATA[D.]]></given-names>
</name>
<name>
<surname><![CDATA[Reader]]></surname>
<given-names><![CDATA[M. C.]]></given-names>
</name>
<name>
<surname><![CDATA[Weaver]]></surname>
<given-names><![CDATA[A. J.]]></given-names>
</name>
</person-group>
<article-title xml:lang="en"><![CDATA[The Canadian Centre for Climate Modelling and analysis global coupled model and its climate]]></article-title>
<source><![CDATA[Clim. Dyna.]]></source>
<year>2000</year>
<volume>16</volume>
<page-range>451-467</page-range></nlm-citation>
</ref>
<ref id="B9">
<nlm-citation citation-type="journal">
<person-group person-group-type="author">
<name>
<surname><![CDATA[Fowler]]></surname>
<given-names><![CDATA[H. J.]]></given-names>
</name>
<name>
<surname><![CDATA[Blenkinsop]]></surname>
<given-names><![CDATA[S.]]></given-names>
</name>
<name>
<surname><![CDATA[Tebaldi]]></surname>
<given-names><![CDATA[C.]]></given-names>
</name>
</person-group>
<article-title xml:lang="en"><![CDATA[Linking climate change modeling to impacts studies: Recent advances in downscaling techniques for hydrological modeling]]></article-title>
<source><![CDATA[Int. J. Climatol.]]></source>
<year>2007</year>
<volume>27</volume>
<page-range>1547-1578</page-range></nlm-citation>
</ref>
<ref id="B10">
<nlm-citation citation-type="journal">
<person-group person-group-type="author">
<name>
<surname><![CDATA[Guttman]]></surname>
<given-names><![CDATA[N. B.]]></given-names>
</name>
</person-group>
<article-title xml:lang="en"><![CDATA[Comparing the Palmer drought index and the standardized precipitation index]]></article-title>
<source><![CDATA[J.Am. Water. Resour. As.]]></source>
<year>1998</year>
<volume>34</volume>
<page-range>113-121</page-range></nlm-citation>
</ref>
<ref id="B11">
<nlm-citation citation-type="journal">
<person-group person-group-type="author">
<name>
<surname><![CDATA[Guttman]]></surname>
<given-names><![CDATA[N. B.]]></given-names>
</name>
</person-group>
<article-title xml:lang="en"><![CDATA[Accepting the standardized precipitation index: a calculation algorithm]]></article-title>
<source><![CDATA[J. Am. Water. Resour. As.]]></source>
<year>1999</year>
<volume>35</volume>
<page-range>311-322</page-range></nlm-citation>
</ref>
<ref id="B12">
<nlm-citation citation-type="journal">
<person-group person-group-type="author">
<name>
<surname><![CDATA[Hay]]></surname>
<given-names><![CDATA[L. E.]]></given-names>
</name>
<name>
<surname><![CDATA[Clark]]></surname>
<given-names><![CDATA[M. P.]]></given-names>
</name>
</person-group>
<article-title xml:lang="en"><![CDATA[Use of statistically and dynamically downscaled atmospheric model output for hydrologic simulations in three mountainous basins in the western United States]]></article-title>
<source><![CDATA[J. Hydrol.]]></source>
<year>2003</year>
<volume>282</volume>
<page-range>56-75</page-range></nlm-citation>
</ref>
<ref id="B13">
<nlm-citation citation-type="journal">
<person-group person-group-type="author">
<name>
<surname><![CDATA[Hayes]]></surname>
<given-names><![CDATA[M. J.]]></given-names>
</name>
<name>
<surname><![CDATA[Svoboda]]></surname>
<given-names><![CDATA[M. D.]]></given-names>
</name>
<name>
<surname><![CDATA[Wilhite]]></surname>
<given-names><![CDATA[D. A.]]></given-names>
</name>
<name>
<surname><![CDATA[Vanyarkho]]></surname>
<given-names><![CDATA[O. V.]]></given-names>
</name>
</person-group>
<article-title xml:lang="en"><![CDATA[Monitoring the 1996 drought using the standardized precipitation index]]></article-title>
<source><![CDATA[B. Am. Meteorol. Soc.]]></source>
<year>1999</year>
<volume>80</volume>
<page-range>429-438</page-range></nlm-citation>
</ref>
<ref id="B14">
<nlm-citation citation-type="journal">
<person-group person-group-type="author">
<name>
<surname><![CDATA[Hertig]]></surname>
<given-names><![CDATA[E.]]></given-names>
</name>
<name>
<surname><![CDATA[Jacobeit]]></surname>
<given-names><![CDATA[J.]]></given-names>
</name>
</person-group>
<article-title xml:lang="en"><![CDATA[Downscaling future climate change: Temperature scenarios for the Mediterranean area]]></article-title>
<source><![CDATA[Glob. Plan. Change]]></source>
<year>2008</year>
<volume>63</volume>
<page-range>127-131</page-range></nlm-citation>
</ref>
<ref id="B15">
<nlm-citation citation-type="journal">
<person-group person-group-type="author">
<name>
<surname><![CDATA[Huth]]></surname>
<given-names><![CDATA[R.]]></given-names>
</name>
<name>
<surname><![CDATA[Kysely]]></surname>
<given-names><![CDATA[J.]]></given-names>
</name>
<name>
<surname><![CDATA[Pokorna]]></surname>
<given-names><![CDATA[L.]]></given-names>
</name>
</person-group>
<article-title xml:lang="en"><![CDATA[A GCM simulation of heat waves, dry spells, and their relationships to circulation]]></article-title>
<source><![CDATA[Climatic Change]]></source>
<year>2000</year>
<volume>46</volume>
<page-range>29-60</page-range></nlm-citation>
</ref>
<ref id="B16">
<nlm-citation citation-type="book">
<person-group person-group-type="author">
<name>
<surname><![CDATA[Nakicenovic]]></surname>
<given-names><![CDATA[N.]]></given-names>
</name>
<name>
<surname><![CDATA[Alcamo]]></surname>
<given-names><![CDATA[J.]]></given-names>
</name>
<name>
<surname><![CDATA[Davis]]></surname>
<given-names><![CDATA[G.]]></given-names>
</name>
<name>
<surname><![CDATA[de Vries]]></surname>
<given-names><![CDATA[B.]]></given-names>
</name>
<name>
<surname><![CDATA[Fenhann]]></surname>
<given-names><![CDATA[J.]]></given-names>
</name>
<name>
<surname><![CDATA[Gaffin]]></surname>
<given-names><![CDATA[S.]]></given-names>
</name>
<name>
<surname><![CDATA[Gregory]]></surname>
<given-names><![CDATA[K.]]></given-names>
</name>
<name>
<surname><![CDATA[Griibler]]></surname>
<given-names><![CDATA[A.]]></given-names>
</name>
<name>
<surname><![CDATA[Yong Jung]]></surname>
<given-names><![CDATA[T.]]></given-names>
</name>
<name>
<surname><![CDATA[Kram]]></surname>
<given-names><![CDATA[T.]]></given-names>
</name>
<name>
<surname><![CDATA[Lebre La Rovere]]></surname>
<given-names><![CDATA[E.]]></given-names>
</name>
<name>
<surname><![CDATA[Michaelis]]></surname>
<given-names><![CDATA[L.]]></given-names>
</name>
<name>
<surname><![CDATA[Mori]]></surname>
<given-names><![CDATA[S.]]></given-names>
</name>
<name>
<surname><![CDATA[Morita]]></surname>
<given-names><![CDATA[T.]]></given-names>
</name>
<name>
<surname><![CDATA[Pepper]]></surname>
<given-names><![CDATA[W.]]></given-names>
</name>
<name>
<surname><![CDATA[Pitcher]]></surname>
<given-names><![CDATA[H.]]></given-names>
</name>
<name>
<surname><![CDATA[Price]]></surname>
<given-names><![CDATA[L.]]></given-names>
</name>
<name>
<surname><![CDATA[Riahi]]></surname>
<given-names><![CDATA[K.]]></given-names>
</name>
<name>
<surname><![CDATA[Roehrl]]></surname>
<given-names><![CDATA[A.]]></given-names>
</name>
<name>
<surname><![CDATA[Holger Rogner]]></surname>
<given-names><![CDATA[H.]]></given-names>
</name>
<name>
<surname><![CDATA[Sankovski]]></surname>
<given-names><![CDATA[A.]]></given-names>
</name>
<name>
<surname><![CDATA[Schlesinger]]></surname>
<given-names><![CDATA[M.]]></given-names>
</name>
<name>
<surname><![CDATA[Shukla]]></surname>
<given-names><![CDATA[P.]]></given-names>
</name>
<name>
<surname><![CDATA[Smith]]></surname>
<given-names><![CDATA[S.]]></given-names>
</name>
<name>
<surname><![CDATA[Swart]]></surname>
<given-names><![CDATA[R.]]></given-names>
</name>
<name>
<surname><![CDATA[van Rooijen]]></surname>
<given-names><![CDATA[S.]]></given-names>
</name>
<name>
<surname><![CDATA[Victor]]></surname>
<given-names><![CDATA[N.]]></given-names>
</name>
<name>
<surname><![CDATA[Dadi]]></surname>
<given-names><![CDATA[Z.]]></given-names>
</name>
</person-group>
<collab>IPCC</collab>
<source><![CDATA[Special report on emissions scenarios]]></source>
<year>2000</year>
<page-range>599</page-range><publisher-name><![CDATA[Cambridge University Press]]></publisher-name>
</nlm-citation>
</ref>
<ref id="B17">
<nlm-citation citation-type="book">
<person-group person-group-type="author">
<name>
<surname><![CDATA[Houghton]]></surname>
<given-names><![CDATA[J. T.]]></given-names>
</name>
<name>
<surname><![CDATA[Ding]]></surname>
<given-names><![CDATA[Y.]]></given-names>
</name>
<name>
<surname><![CDATA[Griggs]]></surname>
<given-names><![CDATA[D. J.]]></given-names>
</name>
<name>
<surname><![CDATA[Noguer]]></surname>
<given-names><![CDATA[M.]]></given-names>
</name>
<name>
<surname><![CDATA[van der Linden]]></surname>
<given-names><![CDATA[P. J.]]></given-names>
</name>
<name>
<surname><![CDATA[Dai]]></surname>
<given-names><![CDATA[X.]]></given-names>
</name>
<name>
<surname><![CDATA[Maskell]]></surname>
<given-names><![CDATA[K.]]></given-names>
</name>
<name>
<surname><![CDATA[Johnson]]></surname>
<given-names><![CDATA[C. A.]]></given-names>
</name>
</person-group>
<collab>IPCC</collab>
<source><![CDATA[Climate Change 2001: The Scientific Basis]]></source>
<year>2001</year>
<page-range>881</page-range><publisher-name><![CDATA[Cambridge University Press]]></publisher-name>
</nlm-citation>
</ref>
<ref id="B18">
<nlm-citation citation-type="book">
<person-group person-group-type="author">
<name>
<surname><![CDATA[Solomon]]></surname>
<given-names><![CDATA[S.]]></given-names>
</name>
<name>
<surname><![CDATA[Qin]]></surname>
<given-names><![CDATA[D.]]></given-names>
</name>
<name>
<surname><![CDATA[Manning]]></surname>
<given-names><![CDATA[M.]]></given-names>
</name>
<name>
<surname><![CDATA[Chen]]></surname>
<given-names><![CDATA[Z.]]></given-names>
</name>
<name>
<surname><![CDATA[Marquis]]></surname>
<given-names><![CDATA[M.]]></given-names>
</name>
<name>
<surname><![CDATA[Averyt]]></surname>
<given-names><![CDATA[K. B.]]></given-names>
</name>
<name>
<surname><![CDATA[Tignor]]></surname>
<given-names><![CDATA[M.]]></given-names>
</name>
<name>
<surname><![CDATA[Miller]]></surname>
<given-names><![CDATA[H. L.]]></given-names>
</name>
</person-group>
<collab>IPCC</collab>
<source><![CDATA[Climate change 2007: The physical science basis]]></source>
<year>2007</year>
<page-range>996</page-range><publisher-name><![CDATA[Cambridge University Press]]></publisher-name>
</nlm-citation>
</ref>
<ref id="B19">
<nlm-citation citation-type="journal">
<person-group person-group-type="author">
<name>
<surname><![CDATA[Karl]]></surname>
<given-names><![CDATA[T. R.]]></given-names>
</name>
<name>
<surname><![CDATA[Wang]]></surname>
<given-names><![CDATA[W. C.]]></given-names>
</name>
<name>
<surname><![CDATA[Schlesinger]]></surname>
<given-names><![CDATA[M. E.]]></given-names>
</name>
<name>
<surname><![CDATA[Knight]]></surname>
<given-names><![CDATA[R. W.]]></given-names>
</name>
<name>
<surname><![CDATA[Portman]]></surname>
<given-names><![CDATA[D.]]></given-names>
</name>
</person-group>
<article-title xml:lang="en"><![CDATA[A method of relating general circulation model simulated climate to the observed local climate. Part I: Seasonal statistics]]></article-title>
<source><![CDATA[J. Climate]]></source>
<year>1990</year>
<volume>3</volume>
<page-range>1053-1079</page-range></nlm-citation>
</ref>
<ref id="B20">
<nlm-citation citation-type="book">
<person-group person-group-type="author">
<name>
<surname><![CDATA[Kleinbaum]]></surname>
<given-names><![CDATA[D. G.]]></given-names>
</name>
<name>
<surname><![CDATA[Klein]]></surname>
<given-names><![CDATA[M.]]></given-names>
</name>
</person-group>
<source><![CDATA[Logistic regression]]></source>
<year>2002</year>
<page-range>701</page-range><publisher-loc><![CDATA[BerlinNew YorkLondon ]]></publisher-loc>
<publisher-name><![CDATA[Springer-Verlag]]></publisher-name>
</nlm-citation>
</ref>
<ref id="B21">
<nlm-citation citation-type="journal">
<person-group person-group-type="author">
<name>
<surname><![CDATA[Kocak]]></surname>
<given-names><![CDATA[K.]]></given-names>
</name>
<name>
<surname><![CDATA[Saylan]]></surname>
<given-names><![CDATA[L.]]></given-names>
</name>
<name>
<surname><![CDATA[Eitzinger]]></surname>
<given-names><![CDATA[J.]]></given-names>
</name>
</person-group>
<article-title xml:lang="en"><![CDATA[Nonlinear prediction of near-surface temperature via univariate and multivariate time series embedding]]></article-title>
<source><![CDATA[Ecol. Model.]]></source>
<year>2004</year>
<volume>173</volume>
<page-range>1-7</page-range></nlm-citation>
</ref>
<ref id="B22">
<nlm-citation citation-type="book">
<person-group person-group-type="author">
<name>
<surname><![CDATA[Livezey]]></surname>
<given-names><![CDATA[R. E.]]></given-names>
</name>
</person-group>
<article-title xml:lang="en"><![CDATA[Categorical events]]></article-title>
<person-group person-group-type="editor">
<name>
<surname><![CDATA[Jolliffe]]></surname>
<given-names><![CDATA[I. T.]]></given-names>
</name>
<name>
<surname><![CDATA[Stephenson]]></surname>
<given-names><![CDATA[D. B.]]></given-names>
</name>
</person-group>
<source><![CDATA[Forecast verification: Practitioner's guide in atmospheric science]]></source>
<year>2003</year>
<page-range>77-96</page-range><publisher-name><![CDATA[John Wiley and Sons]]></publisher-name>
</nlm-citation>
</ref>
<ref id="B23">
<nlm-citation citation-type="journal">
<person-group person-group-type="author">
<name>
<surname><![CDATA[Loukas]]></surname>
<given-names><![CDATA[A.]]></given-names>
</name>
<name>
<surname><![CDATA[Vasiliades]]></surname>
<given-names><![CDATA[L.]]></given-names>
</name>
<name>
<surname><![CDATA[Tzabiras]]></surname>
<given-names><![CDATA[J.]]></given-names>
</name>
</person-group>
<article-title xml:lang="en"><![CDATA[Climate change effects on drought severity]]></article-title>
<source><![CDATA[Adv. Geosci.]]></source>
<year>2008</year>
<volume>17</volume>
<page-range>23-29</page-range></nlm-citation>
</ref>
<ref id="B24">
<nlm-citation citation-type="journal">
<person-group person-group-type="author">
<name>
<surname><![CDATA[Mascaro]]></surname>
<given-names><![CDATA[G.]]></given-names>
</name>
<name>
<surname><![CDATA[Deidda]]></surname>
<given-names><![CDATA[R.]]></given-names>
</name>
<name>
<surname><![CDATA[Vivoni]]></surname>
<given-names><![CDATA[E. R.]]></given-names>
</name>
</person-group>
<article-title xml:lang="en"><![CDATA[A new verification method to ensure consistent ensemble forecasts through calibrated precipitation downscaling models]]></article-title>
<source><![CDATA[Mon. Weather Rev.]]></source>
<year>2008</year>
<volume>136</volume>
<page-range>3374-3391</page-range></nlm-citation>
</ref>
<ref id="B25">
<nlm-citation citation-type="book">
<person-group person-group-type="author">
<name>
<surname><![CDATA[McKee]]></surname>
<given-names><![CDATA[T. B.]]></given-names>
</name>
<name>
<surname><![CDATA[Doesken]]></surname>
<given-names><![CDATA[N. J.]]></given-names>
</name>
<name>
<surname><![CDATA[Kleist]]></surname>
<given-names><![CDATA[J.]]></given-names>
</name>
</person-group>
<article-title xml:lang="en"><![CDATA[The relationship of drought frequency and duration of time scales]]></article-title>
<source><![CDATA[Proceedings of the Eighth Conference on Applied Climatology]]></source>
<year>1993</year>
<page-range>179-186</page-range><publisher-loc><![CDATA[Anaheim^eCa Ca]]></publisher-loc>
<publisher-name><![CDATA[American Meteorological Society]]></publisher-name>
</nlm-citation>
</ref>
<ref id="B26">
<nlm-citation citation-type="book">
<person-group person-group-type="author">
<name>
<surname><![CDATA[McKee]]></surname>
<given-names><![CDATA[T. B.]]></given-names>
</name>
<name>
<surname><![CDATA[Doesken]]></surname>
<given-names><![CDATA[N. J.]]></given-names>
</name>
<name>
<surname><![CDATA[Kleist]]></surname>
<given-names><![CDATA[J.]]></given-names>
</name>
</person-group>
<article-title xml:lang="en"><![CDATA[Drought monitoring with multiple time scales]]></article-title>
<source><![CDATA[Proceedings of the Ninth Conference on Applied Climatology]]></source>
<year>1995</year>
<page-range>233-236</page-range><publisher-loc><![CDATA[Dallas^eTx Tx]]></publisher-loc>
<publisher-name><![CDATA[American Meteorological Society]]></publisher-name>
</nlm-citation>
</ref>
<ref id="B27">
<nlm-citation citation-type="book">
<person-group person-group-type="author">
<name>
<surname><![CDATA[Menard]]></surname>
<given-names><![CDATA[S.]]></given-names>
</name>
</person-group>
<source><![CDATA[Applied logistic regression analysis]]></source>
<year>1995</year>
<page-range>128</page-range><publisher-loc><![CDATA[Thousand Oaks^eCa Ca]]></publisher-loc>
<publisher-name><![CDATA[Sage]]></publisher-name>
</nlm-citation>
</ref>
<ref id="B28">
<nlm-citation citation-type="journal">
<person-group person-group-type="author">
<name>
<surname><![CDATA[Mishra]]></surname>
<given-names><![CDATA[A. K.]]></given-names>
</name>
<name>
<surname><![CDATA[Özger]]></surname>
<given-names><![CDATA[M.]]></given-names>
</name>
<name>
<surname><![CDATA[Singh]]></surname>
<given-names><![CDATA[V. P.]]></given-names>
</name>
</person-group>
<article-title xml:lang="en"><![CDATA[Trend and persistence of precipitation under climate change scenarios for Kansabati basin, India]]></article-title>
<source><![CDATA[Hydrol. Process.]]></source>
<year>2009</year>
<volume>23</volume>
<page-range>2345-2357</page-range></nlm-citation>
</ref>
<ref id="B29">
<nlm-citation citation-type="journal">
<person-group person-group-type="author">
<name>
<surname><![CDATA[Mishra]]></surname>
<given-names><![CDATA[A. K.]]></given-names>
</name>
<name>
<surname><![CDATA[Singh]]></surname>
<given-names><![CDATA[V. P.]]></given-names>
</name>
</person-group>
<article-title xml:lang="en"><![CDATA[Analysis of drought severity-area-frequency curves using a general circulation model and scenario uncertainty]]></article-title>
<source><![CDATA[J. Geophys. Res.]]></source>
<year>2009</year>
<volume>114</volume>
<page-range>D06120</page-range></nlm-citation>
</ref>
<ref id="B30">
<nlm-citation citation-type="journal">
<person-group person-group-type="author">
<name>
<surname><![CDATA[Murphy]]></surname>
<given-names><![CDATA[A. H.]]></given-names>
</name>
</person-group>
<article-title xml:lang="en"><![CDATA[The Finley affair: A signal event in the history of forecast verification]]></article-title>
<source><![CDATA[Weather Forecast.]]></source>
<year>1996</year>
<volume>11</volume>
<page-range>3-20</page-range></nlm-citation>
</ref>
<ref id="B31">
<nlm-citation citation-type="journal">
<person-group person-group-type="author">
<name>
<surname><![CDATA[Prasad]]></surname>
<given-names><![CDATA[K.]]></given-names>
</name>
<name>
<surname><![CDATA[Dash]]></surname>
<given-names><![CDATA[S. K.]]></given-names>
</name>
<name>
<surname><![CDATA[Mohanty]]></surname>
<given-names><![CDATA[U. C.]]></given-names>
</name>
</person-group>
<article-title xml:lang="en"><![CDATA[A logistic regression approach for monthly rainfall forecasts in meteorological subdivisions of India based on DEMETER retrospective forecasts]]></article-title>
<source><![CDATA[Int. J. Climatol.]]></source>
<year>2010</year>
<volume>30</volume>
<page-range>1577-1588</page-range></nlm-citation>
</ref>
<ref id="B32">
<nlm-citation citation-type="journal">
<person-group person-group-type="author">
<name>
<surname><![CDATA[Preisler]]></surname>
<given-names><![CDATA[H. K.]]></given-names>
</name>
<name>
<surname><![CDATA[Westerling]]></surname>
<given-names><![CDATA[A. L.]]></given-names>
</name>
</person-group>
<article-title xml:lang="en"><![CDATA[Statistical model for forecasting monthly large wildfire events in western United States]]></article-title>
<source><![CDATA[J. Appl. Meteorol. Clim.]]></source>
<year>2007</year>
<volume>46</volume>
<page-range>1020-1030</page-range></nlm-citation>
</ref>
<ref id="B33">
<nlm-citation citation-type="book">
<person-group person-group-type="author">
<name>
<surname><![CDATA[Press]]></surname>
<given-names><![CDATA[W. H.]]></given-names>
</name>
<name>
<surname><![CDATA[Flannery]]></surname>
<given-names><![CDATA[B. P.]]></given-names>
</name>
<name>
<surname><![CDATA[Teukolsky]]></surname>
<given-names><![CDATA[S. A.]]></given-names>
</name>
<name>
<surname><![CDATA[Vetterling]]></surname>
<given-names><![CDATA[W. T.]]></given-names>
</name>
</person-group>
<source><![CDATA[Numerical recipes in FORTRAN: The art of scientific computing]]></source>
<year>1992</year>
<edition>2</edition>
<page-range>1486</page-range><publisher-name><![CDATA[Cambridge University Press]]></publisher-name>
</nlm-citation>
</ref>
<ref id="B34">
<nlm-citation citation-type="journal">
<person-group person-group-type="author">
<name>
<surname><![CDATA[Pryor]]></surname>
<given-names><![CDATA[S. C.]]></given-names>
</name>
<name>
<surname><![CDATA[Schoof]]></surname>
<given-names><![CDATA[J. T.]]></given-names>
</name>
<name>
<surname><![CDATA[Barthelmie]]></surname>
<given-names><![CDATA[R. J.]]></given-names>
</name>
</person-group>
<article-title xml:lang="en"><![CDATA[Empirical downscaling of wind speed probability distributions]]></article-title>
<source><![CDATA[J. Geophys. Res.]]></source>
<year>2005</year>
<volume>110</volume>
<page-range>D19109</page-range></nlm-citation>
</ref>
<ref id="B35">
<nlm-citation citation-type="journal">
<person-group person-group-type="author">
<name>
<surname><![CDATA[Öztürk]]></surname>
<given-names><![CDATA[T.]]></given-names>
</name>
<name>
<surname><![CDATA[Altinsoy]]></surname>
<given-names><![CDATA[H.]]></given-names>
</name>
<name>
<surname><![CDATA[Türkes]]></surname>
<given-names><![CDATA[M.]]></given-names>
</name>
<name>
<surname><![CDATA[Kurnaz]]></surname>
<given-names><![CDATA[M. L.]]></given-names>
</name>
</person-group>
<article-title xml:lang="en"><![CDATA[Simulation of temperature and precipitation climatology for central Asia CORDEX domain by using RegCM 4.0]]></article-title>
<source><![CDATA[Clim. Res.]]></source>
<year>2012</year>
<volume>52</volume>
<page-range>63-76</page-range></nlm-citation>
</ref>
<ref id="B36">
<nlm-citation citation-type="journal">
<person-group person-group-type="author">
<name>
<surname><![CDATA[Radu]]></surname>
<given-names><![CDATA[R.]]></given-names>
</name>
<name>
<surname><![CDATA[Deque]]></surname>
<given-names><![CDATA[M.]]></given-names>
</name>
<name>
<surname><![CDATA[Somot]]></surname>
<given-names><![CDATA[S.]]></given-names>
</name>
</person-group>
<article-title xml:lang="en"><![CDATA[Spectral nudging in a spectral regional climate model]]></article-title>
<source><![CDATA[Tellus A]]></source>
<year>2008</year>
<volume>60</volume>
<page-range>898-910</page-range></nlm-citation>
</ref>
<ref id="B37">
<nlm-citation citation-type="journal">
<person-group person-group-type="author">
<name>
<surname><![CDATA[Schmith]]></surname>
<given-names><![CDATA[T.]]></given-names>
</name>
</person-group>
<article-title xml:lang="en"><![CDATA[Stationarity of regression relationships: application to empirical downscaling]]></article-title>
<source><![CDATA[J. Climate]]></source>
<year>2008</year>
<volume>21</volume>
<page-range>4529-4537</page-range></nlm-citation>
</ref>
<ref id="B38">
<nlm-citation citation-type="journal">
<person-group person-group-type="author">
<name>
<surname><![CDATA[Semenov]]></surname>
<given-names><![CDATA[M. A.]]></given-names>
</name>
<name>
<surname><![CDATA[Barrow]]></surname>
<given-names><![CDATA[E. M.]]></given-names>
</name>
</person-group>
<article-title xml:lang="en"><![CDATA[Use of a stochastic weather generator in the development of climate change scenarios]]></article-title>
<source><![CDATA[Climatic Change]]></source>
<year>1997</year>
<volume>35</volume>
<page-range>397-414</page-range></nlm-citation>
</ref>
<ref id="B39">
<nlm-citation citation-type="journal">
<person-group person-group-type="author">
<name>
<surname><![CDATA[Steinemann]]></surname>
<given-names><![CDATA[A.]]></given-names>
</name>
</person-group>
<article-title xml:lang="en"><![CDATA[Drought indicators and triggers: A stochastic approach to evaluation]]></article-title>
<source><![CDATA[J. Am. Water.Resour. As.]]></source>
<year>2003</year>
<volume>39</volume>
<page-range>1217-1233</page-range></nlm-citation>
</ref>
<ref id="B40">
<nlm-citation citation-type="book">
<person-group person-group-type="author">
<name>
<surname><![CDATA[Tabachnick]]></surname>
<given-names><![CDATA[B. G.]]></given-names>
</name>
<name>
<surname><![CDATA[Fidell]]></surname>
<given-names><![CDATA[L. S.]]></given-names>
</name>
</person-group>
<source><![CDATA[Using multivariate statistics]]></source>
<year>1996</year>
<page-range>1024</page-range><publisher-loc><![CDATA[New York ]]></publisher-loc>
<publisher-name><![CDATA[Harper Collins]]></publisher-name>
</nlm-citation>
</ref>
<ref id="B41">
<nlm-citation citation-type="journal">
<person-group person-group-type="author">
<name>
<surname><![CDATA[Tatli]]></surname>
<given-names><![CDATA[H.]]></given-names>
</name>
<name>
<surname><![CDATA[Dalfes]]></surname>
<given-names><![CDATA[H. N.]]></given-names>
</name>
<name>
<surname><![CDATA[Mentes]]></surname>
<given-names><![CDATA[S. S.]]></given-names>
</name>
</person-group>
<article-title xml:lang="en"><![CDATA[A statistical downscaling method for monthly total precipitation over Turkey]]></article-title>
<source><![CDATA[Int. J. Climatol.]]></source>
<year>2004</year>
<volume>24</volume>
<page-range>161-180</page-range></nlm-citation>
</ref>
<ref id="B42">
<nlm-citation citation-type="journal">
<person-group person-group-type="author">
<name>
<surname><![CDATA[Tatli]]></surname>
<given-names><![CDATA[H.]]></given-names>
</name>
<name>
<surname><![CDATA[Dalfes]]></surname>
<given-names><![CDATA[H. N.]]></given-names>
</name>
<name>
<surname><![CDATA[Mentes]]></surname>
<given-names><![CDATA[S. S.]]></given-names>
</name>
</person-group>
<article-title xml:lang="en"><![CDATA[Surface air temperature variability over Turkey and its connection to large-scale upper air circulation via multivariate techniques]]></article-title>
<source><![CDATA[Int. J. Climatol.]]></source>
<year>2005</year>
<volume>25</volume>
<page-range>331-350</page-range></nlm-citation>
</ref>
<ref id="B43">
<nlm-citation citation-type="journal">
<person-group person-group-type="author">
<name>
<surname><![CDATA[Tatli]]></surname>
<given-names><![CDATA[H.]]></given-names>
</name>
</person-group>
<article-title xml:lang="en"><![CDATA[Synchronization between the North Sea-Caspian pattern (NCP) and surface air temperatures in NCEP]]></article-title>
<source><![CDATA[Int. J. Climatol.]]></source>
<year>2007</year>
<volume>27</volume>
<page-range>1171-1187</page-range></nlm-citation>
</ref>
<ref id="B44">
<nlm-citation citation-type="journal">
<person-group person-group-type="author">
<name>
<surname><![CDATA[Tatli]]></surname>
<given-names><![CDATA[H.]]></given-names>
</name>
<name>
<surname><![CDATA[Türke&#351;]]></surname>
<given-names><![CDATA[M.]]></given-names>
</name>
</person-group>
<article-title xml:lang="en"><![CDATA[Empirical orthogonal function analysis of the Palmer drought indices]]></article-title>
<source><![CDATA[Agr. Forest. Meteorol.]]></source>
<year>2011</year>
<volume>151</volume>
<page-range>981-991</page-range></nlm-citation>
</ref>
<ref id="B45">
<nlm-citation citation-type="book">
<person-group person-group-type="author">
<name>
<surname><![CDATA[Tatli]]></surname>
<given-names><![CDATA[H.]]></given-names>
</name>
</person-group>
<source><![CDATA[Statistical downscaling and applications]]></source>
<year>2013</year>
<publisher-name><![CDATA[Lap Lambert Academic Publishing]]></publisher-name>
</nlm-citation>
</ref>
<ref id="B46">
<nlm-citation citation-type="journal">
<person-group person-group-type="author">
<name>
<surname><![CDATA[Tatli]]></surname>
<given-names><![CDATA[H.]]></given-names>
</name>
</person-group>
<article-title xml:lang="en"><![CDATA[Statistical complexity in daily precipitation of NCEP/NCAR reanalysis over the Mediterranean basin]]></article-title>
<source><![CDATA[Int. J. Climatol.]]></source>
<year>2014</year>
<volume>34</volume>
<page-range>155-161</page-range></nlm-citation>
</ref>
<ref id="B47">
<nlm-citation citation-type="book">
<person-group person-group-type="author">
<name>
<surname><![CDATA[Thom]]></surname>
<given-names><![CDATA[H. C. S.]]></given-names>
</name>
</person-group>
<source><![CDATA[Some methods of climatological analysis]]></source>
<year>1966</year>
<publisher-loc><![CDATA[Geneva ]]></publisher-loc>
<publisher-name><![CDATA[World Meteorological Organization]]></publisher-name>
</nlm-citation>
</ref>
<ref id="B48">
<nlm-citation citation-type="journal">
<person-group person-group-type="author">
<name>
<surname><![CDATA[Timothy]]></surname>
<given-names><![CDATA[D. M.]]></given-names>
</name>
<name>
<surname><![CDATA[Hulme]]></surname>
<given-names><![CDATA[M.]]></given-names>
</name>
</person-group>
<article-title xml:lang="en"><![CDATA[Predicting regional climate change: Living with uncertainty]]></article-title>
<source><![CDATA[Prog. Phys. Geog.]]></source>
<year>1999</year>
<volume>23</volume>
<page-range>57-78</page-range></nlm-citation>
</ref>
<ref id="B49">
<nlm-citation citation-type="journal">
<person-group person-group-type="author">
<name>
<surname><![CDATA[Tolika]]></surname>
<given-names><![CDATA[K.]]></given-names>
</name>
<name>
<surname><![CDATA[Maheras]]></surname>
<given-names><![CDATA[P.]]></given-names>
</name>
<name>
<surname><![CDATA[Vafiadis]]></surname>
<given-names><![CDATA[M.]]></given-names>
</name>
<name>
<surname><![CDATA[Flocasc]]></surname>
<given-names><![CDATA[H. A.]]></given-names>
</name>
<name>
<surname><![CDATA[Arseni-Papadimitriou]]></surname>
<given-names><![CDATA[A.]]></given-names>
</name>
</person-group>
<article-title xml:lang="en"><![CDATA[Simulation of seasonal precipitation and raindays over Greece: A statistical downscaling technique based on artificial neural networks (ANNs)]]></article-title>
<source><![CDATA[Int. J. Climatol.]]></source>
<year>2007</year>
<volume>27</volume>
<page-range>861-881</page-range></nlm-citation>
</ref>
<ref id="B50">
<nlm-citation citation-type="journal">
<person-group person-group-type="author">
<name>
<surname><![CDATA[Türkes]]></surname>
<given-names><![CDATA[M.]]></given-names>
</name>
<name>
<surname><![CDATA[Tatli]]></surname>
<given-names><![CDATA[H.]]></given-names>
</name>
</person-group>
<article-title xml:lang="en"><![CDATA[Use of the standardized precipitation index (SPI) and a modified SPI for shaping the drought probabilities over Turkey]]></article-title>
<source><![CDATA[Int. J. Climatol.]]></source>
<year>2009</year>
<volume>29</volume>
<page-range>2270-2282</page-range></nlm-citation>
</ref>
<ref id="B51">
<nlm-citation citation-type="journal">
<person-group person-group-type="author">
<name>
<surname><![CDATA[Türke&#351;]]></surname>
<given-names><![CDATA[M.]]></given-names>
</name>
<name>
<surname><![CDATA[Tatli]]></surname>
<given-names><![CDATA[H.]]></given-names>
</name>
</person-group>
<article-title xml:lang="en"><![CDATA[Use of the spectral clustering to determine coherent precipitation regions in Turkey for the period 1929-2007]]></article-title>
<source><![CDATA[Int. J. Climatol.]]></source>
<year>2011</year>
<volume>31</volume>
<page-range>2055-2067</page-range></nlm-citation>
</ref>
<ref id="B52">
<nlm-citation citation-type="journal">
<person-group person-group-type="author">
<name>
<surname><![CDATA[Vasiliades]]></surname>
<given-names><![CDATA[L.]]></given-names>
</name>
<name>
<surname><![CDATA[Loukas]]></surname>
<given-names><![CDATA[A.]]></given-names>
</name>
<name>
<surname><![CDATA[Patsonas]]></surname>
<given-names><![CDATA[G.]]></given-names>
</name>
</person-group>
<article-title xml:lang="en"><![CDATA[Evaluation of a statistical downscaling procedure for the estimation of climate change impacts on droughts]]></article-title>
<source><![CDATA[Nat. Hazards Earth Sys. Sci.]]></source>
<year>2009</year>
<volume>9</volume>
<page-range>879-894</page-range></nlm-citation>
</ref>
<ref id="B53">
<nlm-citation citation-type="journal">
<person-group person-group-type="author">
<name>
<surname><![CDATA[Wilby]]></surname>
<given-names><![CDATA[R. L.]]></given-names>
</name>
<name>
<surname><![CDATA[Wigley]]></surname>
<given-names><![CDATA[T. M. L.]]></given-names>
</name>
</person-group>
<article-title xml:lang="en"><![CDATA[Downscaling general circulation model output: A review of methods and limitations]]></article-title>
<source><![CDATA[Prog. Phys. Geog.]]></source>
<year>1997</year>
<volume>21</volume>
<page-range>530-548</page-range></nlm-citation>
</ref>
<ref id="B54">
<nlm-citation citation-type="journal">
<person-group person-group-type="author">
<name>
<surname><![CDATA[Wilby]]></surname>
<given-names><![CDATA[R. L.]]></given-names>
</name>
<name>
<surname><![CDATA[Wigley]]></surname>
<given-names><![CDATA[T. M. L.]]></given-names>
</name>
<name>
<surname><![CDATA[Conway]]></surname>
<given-names><![CDATA[D.]]></given-names>
</name>
<name>
<surname><![CDATA[Jones]]></surname>
<given-names><![CDATA[P. D.]]></given-names>
</name>
<name>
<surname><![CDATA[Hewitson]]></surname>
<given-names><![CDATA[B. C.]]></given-names>
</name>
<name>
<surname><![CDATA[Main]]></surname>
<given-names><![CDATA[J.]]></given-names>
</name>
<name>
<surname><![CDATA[Wilks]]></surname>
<given-names><![CDATA[D. S.]]></given-names>
</name>
</person-group>
<article-title xml:lang="en"><![CDATA[Statistical downscaling of general circulation model output: A comparison of methods]]></article-title>
<source><![CDATA[Water Resour. Res.]]></source>
<year>1998</year>
<volume>34</volume>
<page-range>2995-3008</page-range></nlm-citation>
</ref>
<ref id="B55">
<nlm-citation citation-type="journal">
<person-group person-group-type="author">
<name>
<surname><![CDATA[Wilby]]></surname>
<given-names><![CDATA[R. L.]]></given-names>
</name>
<name>
<surname><![CDATA[Hay]]></surname>
<given-names><![CDATA[L. E.]]></given-names>
</name>
<name>
<surname><![CDATA[Leavesley]]></surname>
<given-names><![CDATA[G. H.]]></given-names>
</name>
</person-group>
<article-title xml:lang="en"><![CDATA[A comparison of downscaled and raw GCM output: Implications for climate change scenarios in the San Juan River basin, Colorado]]></article-title>
<source><![CDATA[J. Hydrol.]]></source>
<year>1999</year>
<volume>225</volume>
<page-range>67-91</page-range></nlm-citation>
</ref>
<ref id="B56">
<nlm-citation citation-type="journal">
<person-group person-group-type="author">
<name>
<surname><![CDATA[Wilhelmi]]></surname>
<given-names><![CDATA[O. V.]]></given-names>
</name>
<name>
<surname><![CDATA[Wilhite]]></surname>
<given-names><![CDATA[D. A.]]></given-names>
</name>
</person-group>
<article-title xml:lang="en"><![CDATA[Assessing vulnerability to agricultural drought: A Nebraska case study]]></article-title>
<source><![CDATA[Nat. Hazards]]></source>
<year>2002</year>
<volume>25</volume>
<page-range>37-58</page-range></nlm-citation>
</ref>
<ref id="B57">
<nlm-citation citation-type="book">
<person-group person-group-type="author">
<name>
<surname><![CDATA[Wilks]]></surname>
<given-names><![CDATA[D. S.]]></given-names>
</name>
</person-group>
<source><![CDATA[Statistical methods in the atmospheric sciences: An introduction]]></source>
<year>1995</year>
<page-range>704</page-range><publisher-loc><![CDATA[New York ]]></publisher-loc>
<publisher-name><![CDATA[Academic Press]]></publisher-name>
</nlm-citation>
</ref>
<ref id="B58">
<nlm-citation citation-type="journal">
<person-group person-group-type="author">
<name>
<surname><![CDATA[Wu]]></surname>
<given-names><![CDATA[H.]]></given-names>
</name>
<name>
<surname><![CDATA[Hayes]]></surname>
<given-names><![CDATA[M. J.]]></given-names>
</name>
<name>
<surname><![CDATA[Wilhite]]></surname>
<given-names><![CDATA[D. A.]]></given-names>
</name>
<name>
<surname><![CDATA[Svoboda]]></surname>
<given-names><![CDATA[M. D.]]></given-names>
</name>
</person-group>
<article-title xml:lang="en"><![CDATA[The effect of the length of record on the standardized precipitation index calculation]]></article-title>
<source><![CDATA[Int. J. Climatol.]]></source>
<year>2005</year>
<volume>25</volume>
<page-range>505-520</page-range></nlm-citation>
</ref>
</ref-list>
</back>
</article>