<?xml version="1.0" encoding="ISO-8859-1"?><article xmlns:mml="http://www.w3.org/1998/Math/MathML" xmlns:xlink="http://www.w3.org/1999/xlink" xmlns:xsi="http://www.w3.org/2001/XMLSchema-instance">
<front>
<journal-meta>
<journal-id>0187-6236</journal-id>
<journal-title><![CDATA[Atmósfera]]></journal-title>
<abbrev-journal-title><![CDATA[Atmósfera]]></abbrev-journal-title>
<issn>0187-6236</issn>
<publisher>
<publisher-name><![CDATA[Universidad Nacional Autónoma de México, Instituto de Ciencias de la Atmósfera y Cambio Climático]]></publisher-name>
</publisher>
</journal-meta>
<article-meta>
<article-id>S0187-62362013000200008</article-id>
<title-group>
<article-title xml:lang="en"><![CDATA[Daily precipitation distributions over the intra-Americas sea and their interannual variability]]></article-title>
</title-group>
<contrib-group>
<contrib contrib-type="author">
<name>
<surname><![CDATA[Curtis]]></surname>
<given-names><![CDATA[S.]]></given-names>
</name>
<xref ref-type="aff" rid="A01"/>
</contrib>
</contrib-group>
<aff id="A01">
<institution><![CDATA[,East Carolina University Department of Geography Applied Atmospheric Science Program]]></institution>
<addr-line><![CDATA[Greenville North Carolina]]></addr-line>
</aff>
<pub-date pub-type="pub">
<day>01</day>
<month>04</month>
<year>2013</year>
</pub-date>
<pub-date pub-type="epub">
<day>01</day>
<month>04</month>
<year>2013</year>
</pub-date>
<volume>26</volume>
<numero>2</numero>
<fpage>243</fpage>
<lpage>259</lpage>
<copyright-statement/>
<copyright-year/>
<self-uri xlink:href="http://www.scielo.org.mx/scielo.php?script=sci_arttext&amp;pid=S0187-62362013000200008&amp;lng=en&amp;nrm=iso"></self-uri><self-uri xlink:href="http://www.scielo.org.mx/scielo.php?script=sci_abstract&amp;pid=S0187-62362013000200008&amp;lng=en&amp;nrm=iso"></self-uri><self-uri xlink:href="http://www.scielo.org.mx/scielo.php?script=sci_pdf&amp;pid=S0187-62362013000200008&amp;lng=en&amp;nrm=iso"></self-uri><abstract abstract-type="short" xml:lang="es"><p><![CDATA[Se analiza la variabilidad estacional (de marzo a octubre) e interanual de la función de distribución acumulativa (FDA) relativa a la precipitación en Mesoamérica, el Pacífico oriental y el Atlántico occidental, que suelen denominarse mar intraamericano. Se desarrollaron FDA para grandes áreas de precipitación en tierra y albercas de agua caliente mayores a 28.5 °C y de 26.5 a 28.5 °C. Los valores de las distribuciones de precipitación relativas a aguas de menor temperatura tienden a ser menores en comparación con los de tierra y los de la alberca de agua caliente del hemisferio occidental (WHWP, por sus siglas en inglés). Las distribuciones de la precipitación en tierra y en la WHWP tienen valores similares de marzo a mayo. De junio a octubre, el histograma de precipitación en tierra es más estrecho (menor lluvia ligera e intensa) que el de la WHWP. En ésta, la lluvia intensa a extrema tiene mayor probabilidad de presentarse en junio. De 1997 a 2008, la Oscilación del Sur/El Niño (ENSO, por sus siglas en inglés) se vinculó con las FDA de la precipitación en tierra durante el verano, donde en fases de El Niño se observa una tendencia a menor lluvia total. No hay una relación fuerte entre ENSO y las CDF de la precipitación sobre las WHWP. Por último, una extensa WHWP de mayo a julio se relaciona con las FDA de precipitación sobre las WHWP en octubre, es decir, se observa una tendencia hacia valores más altos de lluvia total y a mayor presencia de eventos extremos. El tamaño de la WHWP en julio explica el 75% de la variabilidad en la frecuencia de precipitaciones mayores a 50 mm en dicha alberca caliente en octubre, y la raíz del error cuadrático medio entre los puntos observados y el modelo lineal es de alrededor de 0.005. Sin embargo, esta aparente predictibilidad no se debe únicamente a una anomalía estacional cálida que conduce a efectos termodinámicos locales. La correlación simultánea entre la extensión de la WHWP en octubre y la FDA de las precipitaciones en ese lugar es baja, lo cual indica ausencia de una respuesta coincidente. Este trabajo muestra, mediante el reanálisis oceánico-atmosférico, que los extremos de precipitación en octubre dependen del desarrollo de la porción atlántica de la WHWP entre mayo y julio. Las WHWP extensas en estos meses son consistentes con el inicio temprano de la alberca caliente del Atlántico y la inestabilidad atmosférica sobre Centroamérica que conduce a eventos extremos de precipitación durante el verano.]]></p></abstract>
<abstract abstract-type="short" xml:lang="en"><p><![CDATA[The seasonal (March to October) and interannual variability of the cumulative distribution function (CDF) of precipitation is examined for Meso-America, the eastern Pacific and western Atlantic, commonly referred to as the intra-Americas sea (IAS). Large-area precipitation CDFs were constructed over land and temperature pools greater than 28.5° C and between 26.5° and 28.5° C. The cooler waters tend to have their precipitation distributions shifted to lower values as compared to land and the western hemisphere warm pool (WHWP). The land and the WHWP have similar precipitation distributions from March to May. From June to October the land histogram of precipitation is narrower (less light and heavy rainfall) relative to the WHWP histogram. The highest probability of finding heavy to extreme precipitation over the WHWP is in June. From 1997 to 2008, in the summer months, the El Niño/Southern Oscillation (ENSO) is related to the CDFs of precipitation over land, where during El Niño there is a shift toward lower daily rain totals. There is not a strong relationship between ENSO and the CDFs of precipitation over the ocean pools. Finally, a large WHWP in May-June-July is related to the CDF of precipitation over the WHWP in October, namely a shift towards higher daily rain totals and more extreme events. The size of the July WHWP explains 75% of the variability in the frequency of rainfall greater than 50 mm within the WHWP in October, and the root mean square error between the observed points and the linear models is about 0.005. However, the reason for this apparent predictability is not simply due to a warm seasonal anomaly leading to local ther-modynamic effects. The concurrent correlation between the size of the WHWP in October and the CDF of precipitation therein is small, indicating a lack of a contemporaneous response. Here it is shown through atmospheric-oceanic reanalysis that rainfall extremes in October are dependent upon the development of the Atlantic portion of the WHWP in May-June-July. Large WHWPs in these months are consistent with an early onset of the Atlantic warm pool and atmospheric instability over Central America leading to extreme precipitation events in the fall.]]></p></abstract>
<kwd-group>
<kwd lng="en"><![CDATA[Daily precipitation]]></kwd>
<kwd lng="en"><![CDATA[climate variability]]></kwd>
<kwd lng="en"><![CDATA[western hemisphere warm pool]]></kwd>
<kwd lng="en"><![CDATA[satellites]]></kwd>
</kwd-group>
</article-meta>
</front><body><![CDATA[  	    <p align="center"><font face="verdana" size="4"><b>Daily precipitation distributions over the intra&#45;Americas sea and their</b> <b>interannual variability</b></font></p>  	    <p align="center"><font face="verdana" size="2">&nbsp;</font></p>  	    <p align="center"><font face="verdana" size="2"><b>S. Curtis</b></font></p>  	    <p align="center"><font face="verdana" size="2"><i>Department of Geography/Applied Atmospheric Science Program, East Carolina University, Brewster A232, Greenville, North Carolina 27858</i> e&#45;mail: <a href="mailto:curtisw@ecu.edu">curtisw@ecu.edu</a></font></p>  	    <p align="center"><font face="verdana" size="2">&nbsp;</font></p>  	    <p align="center"><font face="verdana" size="2">Received October 11, 2011; accepted May 30, 2012</font></p>  	    <p align="center"><font face="verdana" size="2">&nbsp;</font></p>  	    <p align="justify"><font face="verdana" size="2"><b>RESUMEN</b></font></p>  	    <p align="justify"><font face="verdana" size="2">Se analiza la variabilidad estacional (de marzo a octubre) e interanual de la funci&oacute;n de distribuci&oacute;n acumulativa (FDA) relativa a la precipitaci&oacute;n en Mesoam&eacute;rica, el Pac&iacute;fico oriental y el Atl&aacute;ntico occidental, que suelen denominarse mar intraamericano. Se desarrollaron FDA para grandes &aacute;reas de precipitaci&oacute;n en tierra y albercas de agua caliente mayores a 28.5 &deg;C y de 26.5 a 28.5 &deg;C. Los valores de las distribuciones de precipitaci&oacute;n relativas a aguas de menor temperatura tienden a ser menores en comparaci&oacute;n con los de tierra y los de la alberca de agua caliente del hemisferio occidental (WHWP, por sus siglas en ingl&eacute;s). Las distribuciones de la precipitaci&oacute;n en tierra y en la WHWP tienen valores similares de marzo a mayo. De junio a octubre, el histograma de precipitaci&oacute;n en tierra es m&aacute;s estrecho (menor lluvia ligera e intensa) que el de la WHWP. En &eacute;sta, la lluvia intensa a extrema tiene mayor probabilidad de presentarse en junio. De 1997 a 2008, la Oscilaci&oacute;n del Sur/El Ni&ntilde;o (ENSO, por sus siglas en ingl&eacute;s) se vincul&oacute; con las FDA de la precipitaci&oacute;n en tierra durante el verano, donde en fases de El Ni&ntilde;o se observa una tendencia a menor lluvia total. No hay una relaci&oacute;n fuerte entre ENSO y las CDF de la precipitaci&oacute;n sobre las WHWP. Por &uacute;ltimo, una extensa WHWP de mayo a julio se relaciona con las FDA de precipitaci&oacute;n sobre las WHWP en octubre, es decir, se observa una tendencia hacia valores m&aacute;s altos de lluvia total y a mayor presencia de eventos extremos. El tama&ntilde;o de la WHWP en julio explica el 75% de la variabilidad en la frecuencia de precipitaciones mayores a 50 mm en dicha alberca caliente en octubre, y la ra&iacute;z del error cuadr&aacute;tico medio entre los puntos observados y el modelo lineal es de alrededor de 0.005. Sin embargo, esta aparente predictibilidad no se debe &uacute;nicamente a una anomal&iacute;a estacional c&aacute;lida que conduce a efectos termodin&aacute;micos locales. La correlaci&oacute;n simult&aacute;nea entre la extensi&oacute;n de la WHWP en octubre y la FDA de las precipitaciones en ese lugar es baja, lo cual indica ausencia de una respuesta coincidente. Este trabajo muestra, mediante el rean&aacute;lisis oce&aacute;nico&#45;atmosf&eacute;rico, que los extremos de precipitaci&oacute;n en octubre dependen del desarrollo de la porci&oacute;n atl&aacute;ntica de la WHWP entre mayo y julio. Las WHWP extensas en estos meses son consistentes con el inicio temprano de la alberca caliente del Atl&aacute;ntico y la inestabilidad atmosf&eacute;rica sobre Centroam&eacute;rica que conduce a eventos extremos de precipitaci&oacute;n durante el verano.</font></p>  	    ]]></body>
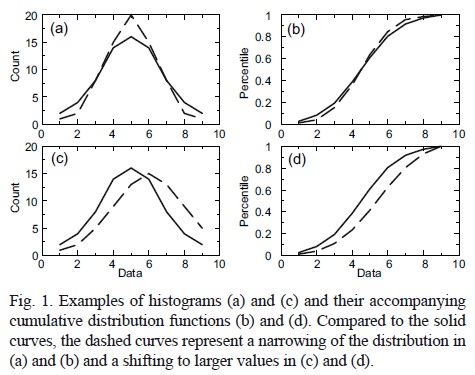
<body><![CDATA[<p align="justify"><font face="verdana" size="2">&nbsp;</font></p>  	    <p align="justify"><font face="verdana" size="2"><b>ABSTRACT</b></font></p>  	    <p align="justify"><font face="verdana" size="2">The seasonal (March to October) and interannual variability of the cumulative distribution function (CDF) of precipitation is examined for Meso&#45;America, the eastern Pacific and western Atlantic, commonly referred to as the intra&#45;Americas sea (IAS). Large&#45;area precipitation CDFs were constructed over land and temperature pools greater than 28.5&deg; C and between 26.5&deg; and 28.5&deg; C. The cooler waters tend to have their precipitation distributions shifted to lower values as compared to land and the western hemisphere warm pool (WHWP). The land and the WHWP have similar precipitation distributions from March to May. From June to October the land histogram of precipitation is narrower (less light and heavy rainfall) relative to the WHWP histogram. The highest probability of finding heavy to extreme precipitation over the WHWP is in June. From 1997 to 2008, in the summer months, the El Ni&ntilde;o/Southern Oscillation (ENSO) is related to the CDFs of precipitation over land, where during El Ni&ntilde;o there is a shift toward lower daily rain totals. There is not a strong relationship between ENSO and the CDFs of precipitation over the ocean pools. Finally, a large WHWP in May&#45;June&#45;July is related to the CDF of precipitation over the WHWP in October, namely a shift towards higher daily rain totals and more extreme events. The size of the July WHWP explains 75% of the variability in the frequency of rainfall greater than 50 mm within the WHWP in October, and the root mean square error between the observed points and the linear models is about 0.005. However, the reason for this apparent predictability is not simply due to a warm seasonal anomaly leading to local ther&#45;modynamic effects. The concurrent correlation between the size of the WHWP in October and the CDF of precipitation therein is small, indicating a lack of a contemporaneous response. Here it is shown through atmospheric&#45;oceanic reanalysis that rainfall extremes in October are dependent upon the development of the Atlantic portion of the WHWP in May&#45;June&#45;July. Large WHWPs in these months are consistent with an early onset of the Atlantic warm pool and atmospheric instability over Central America leading to extreme precipitation events in the fall.</font></p>  	    <p align="justify"><font face="verdana" size="2"><b>Keywords:</b> Daily precipitation, climate variability, western hemisphere warm pool, satellites.</font></p>  	    <p align="justify"><font face="verdana" size="2">&nbsp;</font></p>  	    <p align="justify"><font face="verdana" size="2"><b>1. Introduction</b></font></p>  	    <p align="justify"><font face="verdana" size="2">The intra&#45;Americas sea (IAS) includes the Caribbean Sea, western Atlantic, eastern Pacific, Gulf of Mexico and surrounding countries. One important feature of the IAS is the western hemisphere warm pool (WHWP), which was first defined by Wang and Enfield (2001) as the area covered by sea surface temperatures (SST) greater than 28.5&deg; C. The WHWP generally begins in March in the eastern Pacific, crosses Central America in June and reaches a maximum extent (mostly in the Atlantic) in September, before shrinking in October (Wang and Enfield, 2003). The WHWP is accompanied by low sea level pressure and the prevalence of clouds, convection, and tropical cyclones. Just considering the Atlantic portion of the WHWP, there is a strong contemporaneous relationship between the size of the warm pool and rainfall over the Caribbean and Central America (Wang <i>et al.,</i> 2006).</font></p>  	    <p align="justify"><font face="verdana" size="2">While some recent work has focused on the predictability of seasonal hurricane activity in the IAS given SSTs in the WHWP region and the El Ni&ntilde;o/Southern Oscillation (ENSO) (Jury and Enfield, 2010; Klotzbach, 2011), these climate features have not been examined in relation to the distribution of daily rainfall. This is very important, however, as extreme events in the tropics are manifested in tropical cyclones, but also the more numerous convective downpours that can lead to flash flooding and landslides. It is hypothesized that because non&#45;cyclone extreme events are of ten thermodynamically forced by the underlying SSTs, they should have a stronger relationship with the WHWP than tropical cyclones, which frequently enter the IAS from the coast of Africa (Jury and Enfield, 2010).</font></p>  	    <p align="justify"><font face="verdana" size="2">Daily rainfall is analyzed through the cumulative distribution function (CDF). The CDF relates the probability of rainfall greater than (or less than) a particular amount. The differences between two CDFs can be quantified and related to changes in rain histograms over space or time. For example, the widening of a histogram <i>(i.e.,</i> larger tails and smaller middle) is represented by a flattening of the CDF (<a href="#f1">Fig. 1a, b</a>), up to the limit of a linear CDF, where all values have equal probability. A shift in a histogram <i>(i.e.</i>, an extension of one tail and contraction of the other) leads to a displacement of the CDF to higher or lower probabilities (<a href="#f1">Fig. 1c, d</a>). In the example in <a href="#f1">Figure 1</a>, the histogram weighted towards high values has a CDF that is plotted below the CDF of the histogram weighted towards low values. There is a 60% probability of finding values greater than 5 in the data set represented by the dashed curve, whereas there is only a 40% probability of finding values greater than 5 in the data set represented by the solid curve. Seasonal histograms of daily precipitation have been examined recently in the regional climate literature <i>(e.g.,</i> Higgins <i>et al.,</i> 2007; Ropelewski and Bell, 2008; Black, 2009; Robertson <i>et al.,</i> 2009; Munroe <i>et al.,</i> 2013).</font></p>  	    <p align="center"><font face="verdana" size="2"><a name="f1"></a></font></p>  	    ]]></body>
<body><![CDATA[<p align="center"><font face="verdana" size="2"><img src="/img/revistas/atm/v26n2/a8f1.jpg"></font></p>  	    <p align="justify"><font face="verdana" size="2">While the WHWP and the Atlantic warm pool (AWP) have been investigated in terms of their impact on the seasonal climate of the IAS region, little work has been done to relate these temperature pools to the daily distribution of rainfall. Thus, the primary objective of this study is to investigate the CDFs of daily satellite&#45;estimated precipitation from March to October over the twelve year period 1997 to 2008 grouped by their underlying surface type: land, the WHWP, and surrounding cooler waters. A second objective is to determine whether the CDFs are related to the size of the temperature pools and ENSO, with the ultimate goal of predictability of the distribution of daily rainfall in the IAS. Specific data and methodology are given in section 2, results in section 3, discussion in section 4, and some concluding thoughts in section 5.</font></p>  	    <p align="justify"><font face="verdana" size="2">&nbsp;</font></p>  	    <p align="justify"><font face="verdana" size="2"><b>2. Data and methods</b></font></p>  	    <p align="justify"><font face="verdana" size="2">Precipitation data was obtained from the Global Precipitation Climatology Project (GPCP) One Degree Daily (1DD) version 1.1 (Huffman <i>etal.,</i> 2001, 2009) product. In the area of interest, 1DD is based on Geo&#45;IR satellite brightness temperatures with the final rain rates forced to sum to the GPCP version 2.1 monthly satellite&#45;gauge combination, thus limiting land biases. Besides the advantages of high time and space resolution, estimates of precipitation are computed over the ocean. The primary limitation is the length of the 1DD product, which is currently 12 years (1997 to 2008). Monthly SST at the same one&#45;degree resolution (Reynolds <i>et al.,</i> 2002) was used to define the temperature pools. To extend the analysis in time and provide a dynamical explanation to the statistical results, an index of the size of the WHWP (Wang and Enfield, 2001) was extracted from the Earth System Research Laboratory, NOAA for the period 1950 to 2011. This index was then related to measures of atmospheric stability that would favor convection and extreme precipitation, namely 500 hPa pressure vertical velocity and 200 hPa divergence and velocity potential. The gradient of velocity potential (<i>x</i>) is defined as the divergent wind vector (u):</font></p>  	    <p align="center"><font face="verdana" size="2"><img src="/img/revistas/atm/v26n2/a8e1.jpg"></font></p>      <p align="justify"><font face="verdana" size="2">So <i>u</i> is normal to and directed from negative to positive isolines of velocity potential. Finally, NCEP&#45;SST was used to examine the areal extent of the WHWP in relation to the atmospheric dynamics.</font></p>  	    <p align="justify"><font face="verdana" size="2">Three geographic zones were defined on a one&#45;degree grid over an identical domain (120&#45;40&deg; W and 0&#45;30&deg; N) as the Wang and Enfield (2003) study for all months and years (see example in <a href="/img/revistas/atm/v26n2/a8f2.jpg" target="_blank">Fig. 2</a>). The first zone is land, which is equivalent to 6.4 x 10<sup>6</sup> km<sup>2</sup> and includes Mexico, Central America, northern South America, Florida, and the largest Caribbean islands. The second zone comprises the western hemisphere warm pool (WHWP), which are all grid boxes with values greater than 28.5&deg; C in the monthly SST data set. The WHWP was further subdivided into a Pacific warm pool (PWP) and AWP, as these pools have different dynamics despite being interconnected (Maga&ntilde;a and Caetano, 2005). The third zone is defined by SSTs between 26.5 and 28.5 &deg;C and hereafter referred to as the "cool pool". The cool pool essentially acts as a reference from which to compare the WHWP and was not subdivided.</font></p>  	    <p align="justify"><font face="verdana" size="2">Next precipitation CDFs were computed for each month (8), year (12), and zone (5) for days with measurable rainfall (&gt; 0.01 mm), yielding a total of 480 CDFs. Characteristics of the CDFs were related to the size of the warm pools, size of the cool pool, and the state of ENSO as determined by the Ni&ntilde;o3.4 SST index. Pearson and Spearman correlations, differences in means, and two&#45;tailed t&#45;test were used to quantify relationships and their significances.</font></p> 	    <p align="justify">&nbsp;</p>      ]]></body>
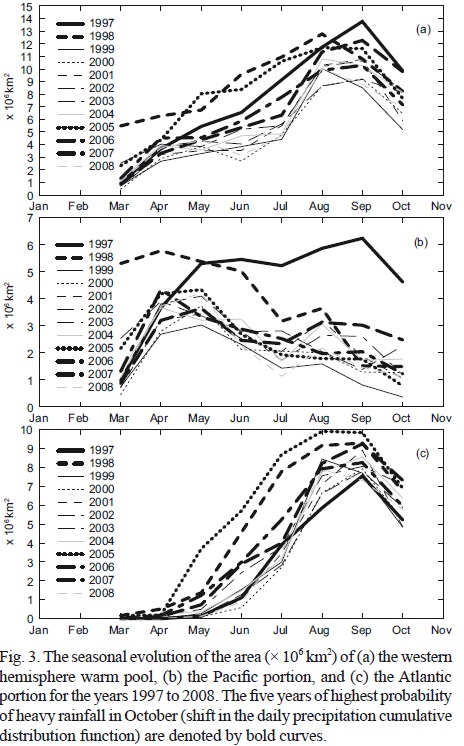
<body><![CDATA[<p align="justify"><font face="verdana" size="2"><b>3. Results</b></font></p>  	    <p align="justify"><font face="verdana" size="2"><i>3.1 Seasonal evolution of the WHWP</i></font></p>  	    <p align="justify"><font face="verdana" size="2"><a href="#f3">Figure 3</a> shows the interannual variability of the area of the WHWP, PWP, and AWP for the months March to October 1997&#45;2008. The size of the WHWP reaches a maximum in August and September consistent with Wang and Enfield (2001, 2003) with the largest variability in June and July. The extent of the variability can be seen in the maps of June 1998 and 2000 (<a href="/img/revistas/atm/v26n2/a8f2.jpg" target="_blank">Fig. 2</a>), representing the largest and smallest WHWP respectively (<a href="#f3">Fig. 3a</a>). In March and April the WHWP is small and relegated to the Pacific. In subsequent months, with the exception of 1997 during the strong El Ni&ntilde;o, the Pacific portion of the WHWP shrinks and the AWP grows. The area of SSTs greater than 28.5 &deg;C is approximately even between the Atlantic and Pacific in June (<a href="#f3">Fig. 3</a>). However, the Pacific accounted for a large majority of the area of the WHWP during this month (<a href="/img/revistas/atm/v26n2/a8f2.jpg" target="_blank">Fig. 2</a>) when it was at its largest extent in 1997 (83%) and smallest extent in 2000 (78%). The WHWP reaches its maximum size in August&#45;September mostly due to the AWP. Interestingly, the Spearman rank correlation shows that the size of the PWP is more related to the overall size of the WHWP in all months except June and July when the AWP has a stronger relationship.</font></p>  	    <p align="center"><font face="verdana" size="2"><a name="f3"></a></font></p>  	    <p align="center"><font face="verdana" size="2"><img src="/img/revistas/atm/v26n2/a8f3.jpg"></font></p>  	    <p align="justify"><font face="verdana" size="2">For all months there is a strong inverse relationship between the size of the WHWP and cool pool. However, this is mostly a function of the domain size. An anomalously warm intra&#45;Americas sea (IAS) would be consistent with cooler waters (&lt; 28.5 &deg;C) being found outside the study region and not included in the area computation (e.g., <a href="/img/revistas/atm/v26n2/a8f2.jpg" target="_blank">Fig. 2a</a>). However, an expansion of the analysis domain was rejected because (1) the present focus is precipitation that could ultimately impact the countries of the IAS, and (2) the WHWP is well captured by the current domain (Wang and Enfield, 2003).</font></p>  	    <p align="justify"><font face="verdana" size="2">&nbsp;</font></p>  	    <p align="justify"><font face="verdana" size="2"><i>3.2&nbsp;Cumulative distribution functions of precipitation in the WHWP</i></font></p>  	    <p align="justify"><font face="verdana" size="2">Both intrazonal and interzonal analyses of the CDFs were conducted and the vast majority of CDFs were found to be significantly different from one another according to a Kolmogrov&#45;Smirnov test. The precipitation CDFs of the WHWP, cool pool, and land were plotted by month. Given the fact that 20 to 40% of daily rainfall was less than 1 mm, the x&#45;axis is given on a logarithmic scale (<a href="/img/revistas/atm/v26n2/a8f4.jpg" target="_blank">Fig. 4</a>). To further characterize the CDFs of each zone the mean and standard deviation of the percentiles were also computed at two rain amounts: 0.1 and 10 mm (<a href="/img/revistas/atm/v26n2/a8f5.jpg" target="_blank">Fig. 5</a>). There is a large spread of WHWP CDFs in March (<a href="/img/revistas/atm/v26n2/a8f4.jpg" target="_blank">Fig. 4a</a>), with a few distributions being substantially shifted to the high end as compared to cool pool and land CDFs. Recall from the introduction that a CDF with relatively lower percentiles is one where there is an increased (decreased) probability of high (low) rainfall totals (see <a href="#f1">Fig. 1</a>). In general over the cool pool low (high) rainfall amounts are more (less) likely to occur. In April and May the land and WHWP CDFs are fairly consistent and separate from the cool pool CDFs (<a href="/img/revistas/atm/v26n2/a8f4.jpg" target="_blank">Fig. 4b, c</a>). In June WHWP percentiles are lower than land percentiles at the high rain totals and higher than the land percentiles at the low rain totals (<a href="/img/revistas/atm/v26n2/a8f4.jpg" target="_blank">Fig. 4d</a>). This suggests in a relative sense that the histogram of rainfall over land is narrower than over the WHWP, or in other words the WHWP has a greater frequency of low and high rain totals and less in the mid&#45;range as compared to land (see <a href="#f1">Fig. 1</a>). From July to September there is little difference in the frequency of &gt; 10 mm rain amounts among the three zones (<a href="/img/revistas/atm/v26n2/a8f5.jpg" target="_blank">Fig. 5b</a>), but in October the most extreme events preferentially occur over the WHWP (<a href="/img/revistas/atm/v26n2/a8f4.jpg" target="_blank">Fig. 4h</a>). In the transition to fall land continues to have a narrower distribution of rainfall with much fewer precipitation totals &lt; 0.1 mm (<a href="/img/revistas/atm/v26n2/a8f5.jpg" target="_blank">Fig. 5a</a>). This is likely due to the climatological change in terrestrial precipitation in this domain. Light rain is generally more prevalent in the spring rather than summer and fall. Percentiles decrease at both tails of the CDF (0.1 and 10 mm) from March to October in the cool pool average (<a href="/img/revistas/atm/v26n2/a8f5.jpg" target="_blank">Fig. 5a, b</a>), indicating an overall shift to greater rain amounts, although it is not until August that the mean CDF becomes comparable to the WHWP and land zones. The WHWP mean CDF favors higher rain totals in May&#45;June. In particular, in June about 40% of daily accumulations are greater than 10 mm (Figs. 4d, 5b). The spread of WHWP CDFs in March is denoted by large standard deviation values, which decrease into the summer season (<a href="/img/revistas/atm/v26n2/a8f5.jpg" target="_blank">Fig. 5c, d</a>). Conversely, standard deviations for the cool pool CDFs are largest in August&#45;September.</font></p>  	    <p align="justify"><font face="verdana" size="2">&nbsp;</font></p>  	    ]]></body>
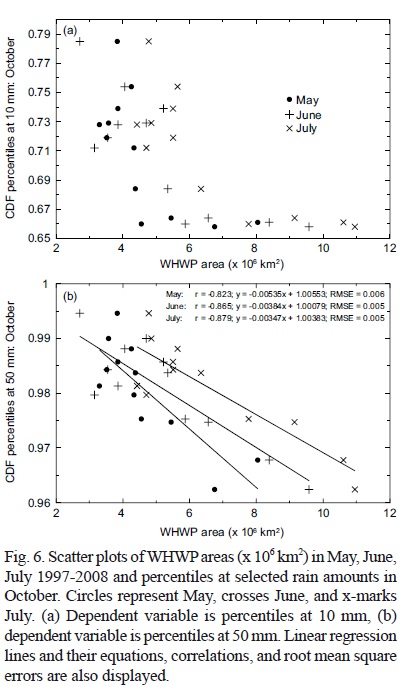
<body><![CDATA[<p align="justify"><font face="verdana" size="2"><i>3.3&nbsp;Surface forcings of the CDFs of precipitation</i></font></p>  	    <p align="justify"><font face="verdana" size="2">Next it is determined if features of the CDFs can be related to the interannual variability of ENSO and the sizes of the WHWP and cool pool. Given the low sample size of 12 CDFs for each month, a stringent significance threshold of 99% (p &lt; 0.01) is imposed. Also, since there is an interest in predictability and our forcing mechanism is the ocean, a time lag is included to account for "memory" across months. The dependent variable is the relative order of the CDFs based on the D&#45;statistic, or the largest difference in percentiles between two CDFs. In <a href="#f1">Figure 1</a> the solid line CDF would be ranked 1 and the dashed line CDF would be ranked 2. Spearman's ranked correction is applied.</font></p>  	    <p align="justify"><font face="verdana" size="2"><a href="/img/revistas/atm/v26n2/a8t1.jpg" target="_blank">Table I</a> shows that most of the non&#45;parametric correlations between the Ni&ntilde;o 3.4 SST anomalies and the ranking of the CDFs over the WHWP are negative, but none reach statistical significance. <a href="/img/revistas/atm/v26n2/a8t2.jpg" target="_blank">Table II</a> repeats <a href="/img/revistas/atm/v26n2/a8t1.jpg" target="_blank">Table I</a>, except now the cool pool CDFs are examined. Here the relationships are mostly positive, but again statistical significance is not achieved. Since lower percentiles indicate a shift of the histogram of rainfall to higher values, the sign of the correlations suggest that El Ni&ntilde;o events would be accompanied by higher daily totals than La Ni&ntilde;a over the WHWP and the opposite would hold for the cool pool. One reason the relationships may be weak is that the size of the pools are not taken into account, and large WHWPs do not always follow El Ni&ntilde;o events, especially in the Atlantic (Enfield <i>etal.,</i> 2006; Wang <i>etal.,</i> 2006). However, additional years of data may increase our confidence in these ENSO relationships. Interestingly, significant relationships between ENSO and the CDFs are observed over the land areas (<a href="/img/revistas/atm/v26n2/a8t3.jpg" target="_blank">Table III</a>). Here summer Pacific temperature anomalies are significantly related to the precipitation distributions over land in August in the sense that El Ni&ntilde;o would be associated with a decrease in the frequency of heavy rain events. This is not too surprising as several authors have noted a decrease in precipitation over Mexico and Central America during El Ni&ntilde;o summers (e.g., Maga&ntilde;a, 2000; Curtis, 2002; Poveda <i>et al.,</i> 2006; Bravo Cabrera <i>et al.,</i> 2010). Also, the predictive power is rather weak (0&#45;2 month lead) as summer precipitation anomalies in the IAS actually lead the boreal winter El Ni&ntilde;o maximum.</font></p>      <p align="justify"><font face="verdana" size="2"><a href="/img/revistas/atm/v26n2/a8t4.jpg" target="_blank">Tables IV</a> and <a href="/img/revistas/atm/v26n2/a8t5.jpg" target="_blank">V</a> show the relationships between the sizes of the WHWPs and cool pools, respectively, and the rank order of CDFs. The October CDF is significantly correlated (negatively) with the size of the WHWP in May&#45;June&#45;July, suggesting a large WHWP in early summer is accompanied by a greater frequency of heavy daily rainfall 3&#45;5 months later. This is borne out in <a href="#f3">Figure 3a</a>, where the five years with the most extreme October precipitation (1997, 1998, 2005, 2006, and 2007) all have anomalously large WHWPs in May, June, and July. Further, scatter plots of the WHWP sizes and CDF percentiles at 10 and 50 mm are shown in <a href="#f6">Figure 6</a>. At 10 mm, for the seven years when the July WHWP was less than 6 x 10<sup>6</sup> km<sup>2</sup>, between 22&#45;29% of rain days exceeded 10 mm (<a href="#f6">Fig. 6a</a>). However, for the five years when the WHWP was larger than 6 x 10<sup>6</sup> km<sup>2</sup> (<a href="#f3">Fig. 3a</a>), between 32&#45;34% of the days exceeded 10 mm. May and June WHWP sizes yield a similar albeit slightly weaker relationship. The same five years of largest WHWPs and lowest percentiles are evident (<a href="#f6">Fig. 6a</a>), but the thresholds have changed due to the climatological expansion of the WHWP from spring to summer (<a href="#f3">Fig. 3a</a>). For May it is 4.35 x 10<sup>6</sup> km<sup>2</sup> and for June it is 5.3 x 10<sup>6</sup> km<sup>2</sup>. However, the strongest correlations and most linear relationships occur at the extreme daily rain total (<a href="#f6">Fig. 6b</a>). The size of the July WHWP explains 75% of the variability in the frequency of rainfall greater than 50 mm within the WHWP in October (using the adjusted <i>r<sup>2</sup>).</i> The root mean square error between the observed points and the linear models is about 0.005 for all months (<a href="#f6">Fig. 6b</a>). May's linear regression is most steep, and would suggest that for every 2 x 10<sup>6</sup> km<sup>2</sup> increase in the size of the warm pool there is over a 1% increase in the probability of daily rainfall greater than 50 mm in October. Since the average percent probability of obtaining a daily precipitation total greater than 50 mm is about 2%, a 1% increase is substantial. There is not a strong consistent relationship between the size of the cool pool and the shape of the CDFs of rainfall within this zone (<a href="/img/revistas/atm/v26n2/a8t5.jpg" target="_blank">Table V</a>).</font></p>  	    <p align="justify"><font face="verdana" size="2">To differentiate between the warm pool's impact on overall rainfall and extreme events, the monthly sizes of the WHWP were related to the percentile of 50 mm rainfall and the monthly average of measurable rainfall in October from 1997 to 2008. <a href="/img/revistas/atm/v26n2/a8f7.jpg" target="_blank">Figure 7</a> shows that the relationship with the extremes is stronger than with the mean from March to July and then weaker from August to October.</font></p>  	    <p align="center"><font face="verdana" size="2"><a name="f6"></a></font></p>  	    <p align="center"><font face="verdana" size="2"><img src="/img/revistas/atm/v26n2/a8f6.jpg"></font></p>  	    <p align="center"><font face="verdana" size="2">&nbsp;</font></p>  	    <p align="justify"><font face="verdana" size="2"><i>3.4 Atmospheric forcings of the CDFs of precipitation</i></font></p>  	    <p align="justify"><font face="verdana" size="2">It is clear that the size of the WHWP in May&#45;June&#45;July is related to extreme precipitation events over the WHWP in October. Since this relationship is lagged by several months, it is less likely forced directly by thermodynamics and is more likely communicated through an atmospheric bridge mechanism (Enfield <i>et al.,</i> 2006). In this section a longer time period was examined between atmospheric variables that indicate instability and extreme precipitation and the size of the WHWP. The 500 hPa pressure vertical velocity (omega), 200 hPa divergence, and 200 hPa velocity potential in October were averaged for the eight years with the largest WHWPs (1958, 1969, 1983, 1987, 1997, 1998, 2005, and 2010) and the eight years with the smallest WHWPs (1950, 1955, 1956, 1967, 1968, 1971, 1984, and 1986) in June. Second, the same methodology was repeated for the eight largest (1987, 1997, 1998, 2002, 2003, 2004, 2006, and 2009) and smallest (1954, 1971, 1974, 1975, 1982, 1984, 1985, and 1988) WHWPs in October to help determine why there is not a contemporaneous relationship between WHWP size and extreme events. It should be noted that only two of the eight years with smallest WHWPs in June also appeared in the October composite (1971 and 1984), and three of the eight years with largest WHWPs in June were also largest in October (1987, 1997, and 1998).</font></p>  	    ]]></body>
<body><![CDATA[<p align="justify"><font face="verdana" size="2">The Octobers that follow large WHWPs in June exhibit ascending air in the mid&#45;troposphere over the Pacific, across Central America, and into the Caribbean, with certain areas reaching statistical significance (<a href="/img/revistas/atm/v26n2/a8f8.jpg" target="_blank">Fig. 8e</a>). Descending air is noted over the tropical North Atlantic (TNA). Rising air feeds divergent flow with significant divergence across Honduras, over Colombia, and off the northwest coast of Mexico (<a href="/img/revistas/atm/v26n2/a8f8.jpg" target="_blank">Fig. 8c</a>) and a center of negative velocity potential over Costa Rica (<a href="/img/revistas/atm/v26n2/a8f8.jpg" target="_blank">Fig. 8a</a>). The Octobers with large WHWPs show very different dynamics. Over the Pacific there is significant mid&#45;tropospheric rising air and upper&#45;tropospheric divergence. However, on the Atlantic side from the TNA to the Bahamas there is significant descent (<a href="/img/revistas/atm/v26n2/a8f8.jpg" target="_blank">Fig. 8f</a>) and convergence (<a href="/img/revistas/atm/v26n2/a8f8.jpg" target="_blank">Fig. 8d</a>). The difference map of 200 hPa velocity potential would indicate strong anomalous westerly divergent flow crossing Central America and the western Caribbean (<a href="/img/revistas/atm/v26n2/a8f8.jpg" target="_blank">Fig. 8b</a>), likely shearing off any developing convection in the IAS.</font></p>  	    <p align="justify"><font face="verdana" size="2">Returning to the oceanic forcing, there is little difference in the size of the mean October WHWP for the eight years of the largest June WHWPs and the eight years of the largest October WHWPs (<a href="/img/revistas/atm/v26n2/a8f9.jpg" target="_blank">Fig. 9c, d</a>). However, June WHWPs prior to large October WHWPs do not have the same extension over the Atlantic as do the large June WHWPs (<a href="/img/revistas/atm/v26n2/a8f9.jpg" target="_blank">Fig. 9a, b</a>). Large June WHWPs cover much of the eastern Caribbean and TNA.</font></p>  	    <p align="justify"><font face="verdana" size="2">&nbsp;</font></p>  	    <p align="justify"><font face="verdana" size="2"><b>4. Discussion</b></font></p>  	    <p align="justify"><font face="verdana" size="2">The recent seasonal and interannual variability of the size of the western hemisphere warm pool (WHWP) was examined, and found to agree with previous climatological studies. An additional "cool pool" (SSTs between 26.5 and 28.5 &deg;C) was also defined here as a reference of comparison with the WHWP. The cumulative distribution functions (CDFs) of daily rainfall were then examined over the WHWP (with contributions from the Atlantic and Pacific), cool pool, and land seasonally. The spread of the CDFs (denoted by standard deviations of percentiles at two rain values) appears to be inversely related to the size of the temperature pools. The WHWP is small at the beginning of the season leading to low numbers of raining days and more uncertainty in the CDFs. From March to May the CDFs over land and the WHWP are similar and shifting to higher rain totals, with lower rainfall amounts found over the cool pool. The frequency of precipitation &gt; 10 mm peaks in June over the WHWP, and then the CDFs of precipitation in the WHWP quickly shift to lower rain amounts in July, consistent with the onset of the midsummer drought (Maga&ntilde;a <i>et al.,</i> 1999). Also, on average, the size of the PWP decreases to a relative minimum in July (<a href="#f3">Fig. 3</a>c), which agrees with the Maga&ntilde;a <i>et al.</i> (1999) hypothesis that an increase in cloudiness in the Northeast Pacific in June leads to a radiational blocking effect, reducing SSTs and rainfall in July. June also marks the establishment of the WHWP into the Atlantic, however, the size of the AWP in June can vary considerably. Wang and Enfield (2001) suggest that the expansion of the warm pool leads to pervasive rainfall and clouds which trap longwave radiation, and in turn increase SST and further grow the warm pool. From the analysis it appears that these 'WTHWP sustaining" rain events from July onward are weaker than the initial ones in June.</font></p>  	    <p align="justify"><font face="verdana" size="2">Generally, ENSO has a weak relationship with the CDFs of precipitation in the WHWP and cool pool, but the tendency is for a shift to higher rain amounts during El Ni&ntilde;o in the warm pool and La Ni&ntilde;a in the cool pool. The former is likely responding to large WHWPs in the eastern Pacific during El Ni&ntilde;o, which coincide with heavy convection near the equator. The state of ENSO in August is strongly related to the land CDFs in August. Consistent with previous studies, precipitation decreases over Mexico and Central America in the summer of an El Ni&ntilde;o (0) year.</font></p>  	    <p align="justify"><font face="verdana" size="2">It was discovered that the distribution of daily rainfall over the WHWP was related to the size of the WHWP from 1997 to 2008. This relationship was most significant for rainfall in October, but surprisingly it was not contemporaneous. The shift to higher rain totals occurred 3&#45;5 months after the presence of large warm pools in May, June, and July. This lagged relationship is not communicated through the size of the warm pool. In fact, very large WHWPs in October are weakly related to the CDFs of precipitation (&#45;0.21).</font></p>  	    <p align="justify"><font face="verdana" size="2">Interestingly, it appears that extremes, rather than normal rain amounts, in October are more sensitive to the size of the early&#45;summer WHWPs. Once WHWP sizes reach a seasonally varying threshold <i>(e.g.</i>, 6 x 10<sup>6</sup> km<sup>2</sup> in July), the chances of obtaining rain amounts greater than 10 mm in October do not change (<a href="/img/revistas/atm/v26n2/a8f7.jpg" target="_blank">Fig. 7a</a>), but the probability of obtaining rain amounts greater than 50 mm continues to increase with increasing size (<a href="#f6">Fig. 6b</a>). Further, extreme events in October respond more significantly to the size of the WHWP earlier in the season than average rainfall in October does (<a href="/img/revistas/atm/v26n2/a8f7.jpg" target="_blank">Fig. 7</a>).</font></p>  	    <p align="justify"><font face="verdana" size="2">The WHWP is composed of the AWP and PWP, which are generated by different forcing mechanisms. However, the surface warming combines in terms of destabilizing the atmosphere. This may explain the reason, for example, that the area of the WHWP in May has a stronger relationship with the October CDF of precipitation over the WHWP (&#45;0.762, see <a href="/img/revistas/atm/v26n2/a8t4.jpg" target="_blank">Table IV</a>) as compared to the relationship between the area of the AWP in May and the October CDF of precipitation over the AWP (&#45;0.587) or the area of the PWP in May and the October CDF of precipitation over the PWP (&#45;0.147).</font></p>  	    <p align="justify"><font face="verdana" size="2">To explore this concept further, measures of atmospheric stability for Octobers having large WHWPs and following large June WHWPs were examined over a longer time period (1950&#45;2011).</font></p>  	    ]]></body>
<body><![CDATA[<p align="justify"><font face="verdana" size="2">The correlation between an index of the size of the June WHWP and the October WHWP from 1950 to 2011 is 0.60. However, the large scale dynamics are quite different. Fields of 500 hPa pressure vertical velocity, 200 hPa divergence, and 200 hPa velocity potential show patterns consistent with an unstable atmosphere over portions of both the Pacific and Atlantic basins, focused over Central America, in the June case. As discussed previously, large June WHWPs are prominent in the Atlantic, and it is the size of the AWP in May&#45;June&#45;July (<a href="#f3">Fig. 3c</a>), rather than the size of the PWP (<a href="#f3">Fig. 3b</a>), that has the greater influence on whether there will be more or less precipitation extremes come October. Temperatures above 28.5 &deg;C can lead to organized convection (Graham and Barnett, 1987), destabilizing the atmosphere over time. In the October case the instability is confined to the Pacific and the Atlantic is stable. June WHWPs prior to large October WHWPs do not show the same expansion into the Atlantic, but are larger in the Pacific, thus the center of instability is shifted westward come October. Therefore, in both cases the atmosphere is conducive to extreme events over the PWP in October, whereas only in the June&#45;leading case is the atmosphere conducive to extreme events over the Caribbean Sea bounded by Cuba, Jamaica, and the Yucat&aacute;n peninsula&#151;a region where a large proportion of daily rainfall totals greater than 50 mm occur (not shown).</font></p>  	    <p align="justify"><font face="verdana" size="2">&nbsp;</font></p>  	    <p align="justify"><font face="verdana" size="2"><b>5. Conclusions</b></font></p>  	    <p align="justify"><font face="verdana" size="2">This is the first study to relate the size of the WHWP to the distribution of daily precipitation over both land and ocean and has demonstrated the utility of satellite&#45;based precipitation estimates. The highest probability of finding heavy to extreme precipitation over the WHWP is in June. This is also the season when the WHWP first crosses Central America. Further, the precipitation distribution, and particularly extreme events, over the WHWP at the end of the season are sensitive to the size of the WHWP at the beginning of the season. The early season warm pool is primarily in the Pacific, while the late season warm pool is a feature of the Atlantic. It appears that an early transition of warm waters from the Pacific to the Atlantic, or onset of the AWP, is important for generating heavy to extreme events in the Atlantic at the end of the season, while the size of the WHWP has little impact on the simultaneous development of extreme events. Thus, what matters is the destabilization of the atmosphere over 3&#45;5 months. The relationship between the size of the WHWP in early&#45;summer and extreme precipitation events over the warm pool in fall is highly significant, and may be useful for climate prediction. For example, if the May, June, or July WHWP is large then the forecast would be for a greater probability of extreme precipitation events over the IAS in October. It was found that a simple linear model explains up to 75% of the variance, and the model would suggest that a WHWP in May that is 2 x 10<sup>6</sup> km<sup>2</sup> larger than normal equates to a doubling of the probability of precipitation greater than 50 mm over the warm pool in October, with the preferred location being over the western Caribbean Sea.</font></p>  	    <p align="justify"><font face="verdana" size="2">&nbsp;</font></p>  	    <p align="justify"><font face="verdana" size="2"><b>Acknowledgements</b></font></p>  	    <p align="justify"><font face="verdana" size="2">The author would like to thank two anonymous reviewers and the assistance of guest editor Dr. Henry Diaz, which improved an earlier version of the manuscript. This study was funded by the University of Maryland through a NASA Energy and Water Cycle Study: "Global precipitation variations and extremes". The author thanks Dr. Robert Adler for his leadership on the project.</font></p>  	    <p align="justify"><font face="verdana" size="2">&nbsp;</font></p>  	    <p align="justify"><font face="verdana" size="2"><b>References</b></font></p>  	    <!-- ref --><p align="justify"><font face="verdana" size="2">Black E., 2009. The impact of climate change on daily precipitation statistics in Jordan and Israel. <i>Atmos. Sci. Lett.</i> <b>10,</b> 192&#45;200.    &nbsp;&nbsp;&nbsp;&nbsp;&nbsp;&nbsp;&nbsp;&nbsp;[&#160;<a href="javascript:void(0);" onclick="javascript: window.open('/scielo.php?script=sci_nlinks&ref=1297238&pid=S0187-6236201300020000800001&lng=','','width=640,height=500,resizable=yes,scrollbars=1,menubar=yes,');">Links</a>&#160;]<!-- end-ref --></font></p>  	    <!-- ref --><p align="justify"><font face="verdana" size="2">Bravo Cabrera J. L., E. Azpra Romero, V. Zarraluqui Such, C. Gay Garc&iacute;a and F. Estrada Porr&uacute;a, 2010. Significance tests for the relationship between "El Ni&ntilde;o" phenomenon and precipitation in Mexico. <i>Geofis. Int.</i> <b>49,</b> 245&#45;261.    &nbsp;&nbsp;&nbsp;&nbsp;&nbsp;&nbsp;&nbsp;&nbsp;[&#160;<a href="javascript:void(0);" onclick="javascript: window.open('/scielo.php?script=sci_nlinks&ref=1297240&pid=S0187-6236201300020000800002&lng=','','width=640,height=500,resizable=yes,scrollbars=1,menubar=yes,');">Links</a>&#160;]<!-- end-ref --></font></p>  	    <!-- ref --><p align="justify"><font face="verdana" size="2">Curtis S., 2002. Interannual variability of the bimodal distribution of summertime rainfall over Central America and tropical storm activity in the far&#45;eastern <i>Pacific. Clim. Res.</i> <b>22,</b> 141&#45;146.    &nbsp;&nbsp;&nbsp;&nbsp;&nbsp;&nbsp;&nbsp;&nbsp;[&#160;<a href="javascript:void(0);" onclick="javascript: window.open('/scielo.php?script=sci_nlinks&ref=1297242&pid=S0187-6236201300020000800003&lng=','','width=640,height=500,resizable=yes,scrollbars=1,menubar=yes,');">Links</a>&#160;]<!-- end-ref --></font></p>  	    <!-- ref --><p align="justify"><font face="verdana" size="2">Enfield D. B, S. K. Lee and C. Wang, 2006. How are large Western Hemisphere warm pools formed? <i>Prog. Oceanogr.</i> <b>70,</b> 346&#45;365.    &nbsp;&nbsp;&nbsp;&nbsp;&nbsp;&nbsp;&nbsp;&nbsp;[&#160;<a href="javascript:void(0);" onclick="javascript: window.open('/scielo.php?script=sci_nlinks&ref=1297244&pid=S0187-6236201300020000800004&lng=','','width=640,height=500,resizable=yes,scrollbars=1,menubar=yes,');">Links</a>&#160;]<!-- end-ref --></font></p>  	    <!-- ref --><p align="justify"><font face="verdana" size="2">Graham N. E. and T. P. Barnett, 1987. Sea surface temperature, surface wind divergence, and convection over tropical oceans. <i>Science</i> <b>238,</b> 657&#45;659.    &nbsp;&nbsp;&nbsp;&nbsp;&nbsp;&nbsp;&nbsp;&nbsp;[&#160;<a href="javascript:void(0);" onclick="javascript: window.open('/scielo.php?script=sci_nlinks&ref=1297246&pid=S0187-6236201300020000800005&lng=','','width=640,height=500,resizable=yes,scrollbars=1,menubar=yes,');">Links</a>&#160;]<!-- end-ref --></font></p>  	    <!-- ref --><p align="justify"><font face="verdana" size="2">Higgins R. W., V. B. S. Silva, W. Shi and J. Larson, 2007. Relationships between climate variability and fluctuations in daily precipitation over the United States. <i>J. Climate</i> <b>20,</b> 3561&#45;3579.    &nbsp;&nbsp;&nbsp;&nbsp;&nbsp;&nbsp;&nbsp;&nbsp;[&#160;<a href="javascript:void(0);" onclick="javascript: window.open('/scielo.php?script=sci_nlinks&ref=1297248&pid=S0187-6236201300020000800006&lng=','','width=640,height=500,resizable=yes,scrollbars=1,menubar=yes,');">Links</a>&#160;]<!-- end-ref --></font></p>  	    <!-- ref --><p align="justify"><font face="verdana" size="2">Huffman G. J., R. F. Adler, M. Morrissey, D. T. Bolvin, S. Curtis, R. Joyce, B. McGayock and J. Susskind, 2001. Global precipitation at one&#45;degree daily resolution from multi&#45;satellite observations. <i>J. Hydrometeorol.</i> <b>2,</b> 36&#45;50.    &nbsp;&nbsp;&nbsp;&nbsp;&nbsp;&nbsp;&nbsp;&nbsp;[&#160;<a href="javascript:void(0);" onclick="javascript: window.open('/scielo.php?script=sci_nlinks&ref=1297250&pid=S0187-6236201300020000800007&lng=','','width=640,height=500,resizable=yes,scrollbars=1,menubar=yes,');">Links</a>&#160;]<!-- end-ref --></font></p>  	    <!-- ref --><p align="justify"><font face="verdana" size="2">Huffman G. J., R. F. Adler, D. T. Bolvin and G. Gu, 2009. Improving the global precipitation record: GPCP Version 2.1. <i>Geophys. Res. Lett.</i> <b>36,</b> doi:10.1029/2009GL040000.    &nbsp;&nbsp;&nbsp;&nbsp;&nbsp;&nbsp;&nbsp;&nbsp;[&#160;<a href="javascript:void(0);" onclick="javascript: window.open('/scielo.php?script=sci_nlinks&ref=1297252&pid=S0187-6236201300020000800008&lng=','','width=640,height=500,resizable=yes,scrollbars=1,menubar=yes,');">Links</a>&#160;]<!-- end-ref --></font></p>  	    <!-- ref --><p align="justify"><font face="verdana" size="2">Jury M. R. and D. B. Enfield, 2010. Environmental patterns associated with active and inactive Caribbean hurricane seasons. <i>J. Climate</i> <b>23,</b> 2146&#45;2160.    &nbsp;&nbsp;&nbsp;&nbsp;&nbsp;&nbsp;&nbsp;&nbsp;[&#160;<a href="javascript:void(0);" onclick="javascript: window.open('/scielo.php?script=sci_nlinks&ref=1297254&pid=S0187-6236201300020000800009&lng=','','width=640,height=500,resizable=yes,scrollbars=1,menubar=yes,');">Links</a>&#160;]<!-- end-ref --></font></p>  	    <!-- ref --><p align="justify"><font face="verdana" size="2">Klotzbach P. J., 2011. The influence of El Ni&ntilde;o&#45;Southern Oscillation and the Atlantic Multidecadal Oscillation on Caribbean tropical cyclones. <i>J. Climate</i> <b>24,</b> 721&#45;731.    &nbsp;&nbsp;&nbsp;&nbsp;&nbsp;&nbsp;&nbsp;&nbsp;[&#160;<a href="javascript:void(0);" onclick="javascript: window.open('/scielo.php?script=sci_nlinks&ref=1297256&pid=S0187-6236201300020000800010&lng=','','width=640,height=500,resizable=yes,scrollbars=1,menubar=yes,');">Links</a>&#160;]<!-- end-ref --></font></p>  	    <!-- ref --><p align="justify"><font face="verdana" size="2">Maga&ntilde;a V., J. Amador and S. Medina, 1999. The midsummer drought over Mexico and Central America. <i>J. Climate</i> <b>12,</b> 1577&#45;1588.    &nbsp;&nbsp;&nbsp;&nbsp;&nbsp;&nbsp;&nbsp;&nbsp;[&#160;<a href="javascript:void(0);" onclick="javascript: window.open('/scielo.php?script=sci_nlinks&ref=1297258&pid=S0187-6236201300020000800011&lng=','','width=640,height=500,resizable=yes,scrollbars=1,menubar=yes,');">Links</a>&#160;]<!-- end-ref --></font></p>  	    <!-- ref --><p align="justify"><font face="verdana" size="2">Maga&ntilde;a V., 2000. Interannual climate variability in the Mexico, Central America, and Caribbean region. <i>CLIVAR Exchanges</i> <b>16,</b> 1&#45;12.    &nbsp;&nbsp;&nbsp;&nbsp;&nbsp;&nbsp;&nbsp;&nbsp;[&#160;<a href="javascript:void(0);" onclick="javascript: window.open('/scielo.php?script=sci_nlinks&ref=1297260&pid=S0187-6236201300020000800012&lng=','','width=640,height=500,resizable=yes,scrollbars=1,menubar=yes,');">Links</a>&#160;]<!-- end-ref --></font></p>  	    <!-- ref --><p align="justify"><font face="verdana" size="2">Maga&ntilde;a V. and E. Caetano, 2005. Temporal evolution of summer convective activity over the Americas warm pools. <i>Geophys. Res. Lett.</i> <b>32,</b> doi:10.1029/2004GL021033.    &nbsp;&nbsp;&nbsp;&nbsp;&nbsp;&nbsp;&nbsp;&nbsp;[&#160;<a href="javascript:void(0);" onclick="javascript: window.open('/scielo.php?script=sci_nlinks&ref=1297262&pid=S0187-6236201300020000800013&lng=','','width=640,height=500,resizable=yes,scrollbars=1,menubar=yes,');">Links</a>&#160;]<!-- end-ref --></font></p>  	    <!-- ref --><p align="justify"><font face="verdana" size="2">Munroe R., T. Crawford and S. Curtis, 2012. Geospatial analysis of space&#45;time patterning of ENSO forced daily precipitation distributions in the Gulf of Mexico. <i>Prof. Geograph.</i> (forthcoming in 2013).    &nbsp;&nbsp;&nbsp;&nbsp;&nbsp;&nbsp;&nbsp;&nbsp;[&#160;<a href="javascript:void(0);" onclick="javascript: window.open('/scielo.php?script=sci_nlinks&ref=1297264&pid=S0187-6236201300020000800014&lng=','','width=640,height=500,resizable=yes,scrollbars=1,menubar=yes,');">Links</a>&#160;]<!-- end-ref --></font></p>  	    <!-- ref --><p align="justify"><font face="verdana" size="2">Poveda G., P. R. Waylen and R. S. Pulwarty, 2006. Annual and inter&#45;annual variability of the present climate in northern South America and southern Mesoamerica. <i>Palaeogeogr. Palaeoclimatol. Palaeoecol.</i> <b>234,</b> 3&#45;27.    &nbsp;&nbsp;&nbsp;&nbsp;&nbsp;&nbsp;&nbsp;&nbsp;[&#160;<a href="javascript:void(0);" onclick="javascript: window.open('/scielo.php?script=sci_nlinks&ref=1297266&pid=S0187-6236201300020000800015&lng=','','width=640,height=500,resizable=yes,scrollbars=1,menubar=yes,');">Links</a>&#160;]<!-- end-ref --></font></p>  	    <!-- ref --><p align="justify"><font face="verdana" size="2">Reynolds R. W., N. A. Rayner, T. M. Smith, D. C. Stokes and W. Wang, 2002. An improved <i>in situ</i> and satellite SST analysis for climate. <i>J. Climate</i> <b>15,</b> 1609&#45;1625.    &nbsp;&nbsp;&nbsp;&nbsp;&nbsp;&nbsp;&nbsp;&nbsp;[&#160;<a href="javascript:void(0);" onclick="javascript: window.open('/scielo.php?script=sci_nlinks&ref=1297268&pid=S0187-6236201300020000800016&lng=','','width=640,height=500,resizable=yes,scrollbars=1,menubar=yes,');">Links</a>&#160;]<!-- end-ref --></font></p>  	    <!-- ref --><p align="justify"><font face="verdana" size="2">Robertson A. W., V. Moron and Y. Swarinoto, 2009. Seasonal predictability of daily rainfall statistics over the Indramayu district, Indonesia. <i>Int. J. Climatol.</i> <b>29,</b> 1449&#45;1462.    &nbsp;&nbsp;&nbsp;&nbsp;&nbsp;&nbsp;&nbsp;&nbsp;[&#160;<a href="javascript:void(0);" onclick="javascript: window.open('/scielo.php?script=sci_nlinks&ref=1297270&pid=S0187-6236201300020000800017&lng=','','width=640,height=500,resizable=yes,scrollbars=1,menubar=yes,');">Links</a>&#160;]<!-- end-ref --></font></p>  	    <!-- ref --><p align="justify"><font face="verdana" size="2">Ropelewski C. F. and M. A. Bell, 2008. Shifts in the statistics of daily rainfall in South America conditional on ENSO phases. <i>J. Climate</i> <b>21,</b> 849&#45;865.    &nbsp;&nbsp;&nbsp;&nbsp;&nbsp;&nbsp;&nbsp;&nbsp;[&#160;<a href="javascript:void(0);" onclick="javascript: window.open('/scielo.php?script=sci_nlinks&ref=1297272&pid=S0187-6236201300020000800018&lng=','','width=640,height=500,resizable=yes,scrollbars=1,menubar=yes,');">Links</a>&#160;]<!-- end-ref --></font></p>  	    <!-- ref --><p align="justify"><font face="verdana" size="2">Wang C. Z. and D. B. Enfield, 2001. The tropical Western Hemisphere warm pool. <i>Geophys. Res. Lett.</i> <b>28,</b> 1635&#45;1638.    &nbsp;&nbsp;&nbsp;&nbsp;&nbsp;&nbsp;&nbsp;&nbsp;[&#160;<a href="javascript:void(0);" onclick="javascript: window.open('/scielo.php?script=sci_nlinks&ref=1297274&pid=S0187-6236201300020000800019&lng=','','width=640,height=500,resizable=yes,scrollbars=1,menubar=yes,');">Links</a>&#160;]<!-- end-ref --></font></p>  	    <!-- ref --><p align="justify"><font face="verdana" size="2">Wang C. Z. and D. B. Enfield, 2003. A further study of the tropical Western Hemisphere warm pool. <i>J. Climate</i> <b>16,</b> 1476&#45;1493.    &nbsp;&nbsp;&nbsp;&nbsp;&nbsp;&nbsp;&nbsp;&nbsp;[&#160;<a href="javascript:void(0);" onclick="javascript: window.open('/scielo.php?script=sci_nlinks&ref=1297276&pid=S0187-6236201300020000800020&lng=','','width=640,height=500,resizable=yes,scrollbars=1,menubar=yes,');">Links</a>&#160;]<!-- end-ref --></font></p>  	    <!-- ref --><p align="justify"><font face="verdana" size="2">Wang C. Z., D. B. Enfield, S. K. Lee and C. W. Landsea, 2006. Influences of the Atlantic warm pool on western hemisphere summer rainfall and Atlantic hurricanes. <i>J. Climate</i> <b>19,</b> 3011&#45;3028.    &nbsp;&nbsp;&nbsp;&nbsp;&nbsp;&nbsp;&nbsp;&nbsp;[&#160;<a href="javascript:void(0);" onclick="javascript: window.open('/scielo.php?script=sci_nlinks&ref=1297278&pid=S0187-6236201300020000800021&lng=','','width=640,height=500,resizable=yes,scrollbars=1,menubar=yes,');">Links</a>&#160;]<!-- end-ref --></font></p>      ]]></body><back>
<ref-list>
<ref id="B1">
<nlm-citation citation-type="journal">
<person-group person-group-type="author">
<name>
<surname><![CDATA[Black]]></surname>
<given-names><![CDATA[E.]]></given-names>
</name>
</person-group>
<article-title xml:lang="en"><![CDATA[The impact of climate change on daily precipitation statistics in Jordan and Israel]]></article-title>
<source><![CDATA[Atmos. Sci. Lett.]]></source>
<year>2009</year>
<volume>10</volume>
<page-range>192-200</page-range></nlm-citation>
</ref>
<ref id="B2">
<nlm-citation citation-type="journal">
<person-group person-group-type="author">
<name>
<surname><![CDATA[Bravo Cabrera]]></surname>
<given-names><![CDATA[J. L.]]></given-names>
</name>
<name>
<surname><![CDATA[Azpra Romero]]></surname>
<given-names><![CDATA[E.]]></given-names>
</name>
<name>
<surname><![CDATA[Zarraluqui Such]]></surname>
<given-names><![CDATA[V.]]></given-names>
</name>
<name>
<surname><![CDATA[Gay García]]></surname>
<given-names><![CDATA[C.]]></given-names>
</name>
<name>
<surname><![CDATA[Estrada Porrúa]]></surname>
<given-names><![CDATA[F.]]></given-names>
</name>
</person-group>
<article-title xml:lang="en"><![CDATA[Significance tests for the relationship between "El Niño" phenomenon and precipitation in Mexico]]></article-title>
<source><![CDATA[Geofis. Int.]]></source>
<year>2010</year>
<volume>49</volume>
<page-range>245-261</page-range></nlm-citation>
</ref>
<ref id="B3">
<nlm-citation citation-type="journal">
<person-group person-group-type="author">
<name>
<surname><![CDATA[Curtis]]></surname>
<given-names><![CDATA[S.]]></given-names>
</name>
</person-group>
<article-title xml:lang="en"><![CDATA[Interannual variability of the bimodal distribution of summertime rainfall over Central America and tropical storm activity in the far-eastern Pacific]]></article-title>
<source><![CDATA[Clim. Res.]]></source>
<year>2002</year>
<volume>22</volume>
<page-range>141-146</page-range></nlm-citation>
</ref>
<ref id="B4">
<nlm-citation citation-type="journal">
<person-group person-group-type="author">
<name>
<surname><![CDATA[Enfield]]></surname>
<given-names><![CDATA[D. B]]></given-names>
</name>
<name>
<surname><![CDATA[Lee]]></surname>
<given-names><![CDATA[S. K.]]></given-names>
</name>
<name>
<surname><![CDATA[Wang]]></surname>
<given-names><![CDATA[C.]]></given-names>
</name>
</person-group>
<article-title xml:lang="en"><![CDATA[How are large Western Hemisphere warm pools formed? Prog]]></article-title>
<source><![CDATA[Oceanogr.]]></source>
<year>2006</year>
<volume>70</volume>
<page-range>346-365</page-range></nlm-citation>
</ref>
<ref id="B5">
<nlm-citation citation-type="journal">
<person-group person-group-type="author">
<name>
<surname><![CDATA[Graham]]></surname>
<given-names><![CDATA[N. E.]]></given-names>
</name>
<name>
<surname><![CDATA[Barnett]]></surname>
<given-names><![CDATA[T. P.]]></given-names>
</name>
</person-group>
<article-title xml:lang="en"><![CDATA[Sea surface temperature, surface wind divergence, and convection over tropical oceans]]></article-title>
<source><![CDATA[Science]]></source>
<year>1987</year>
<volume>238</volume>
<page-range>657-659</page-range></nlm-citation>
</ref>
<ref id="B6">
<nlm-citation citation-type="journal">
<person-group person-group-type="author">
<name>
<surname><![CDATA[Higgins]]></surname>
<given-names><![CDATA[R. W.]]></given-names>
</name>
<name>
<surname><![CDATA[Silva]]></surname>
<given-names><![CDATA[V. B. S.]]></given-names>
</name>
<name>
<surname><![CDATA[Shi]]></surname>
<given-names><![CDATA[W.]]></given-names>
</name>
<name>
<surname><![CDATA[Larson]]></surname>
<given-names><![CDATA[J.]]></given-names>
</name>
</person-group>
<article-title xml:lang="en"><![CDATA[Relationships between climate variability and fluctuations in daily precipitation over the United States]]></article-title>
<source><![CDATA[J. Climate]]></source>
<year>2007</year>
<volume>20</volume>
<page-range>3561-3579</page-range></nlm-citation>
</ref>
<ref id="B7">
<nlm-citation citation-type="journal">
<person-group person-group-type="author">
<name>
<surname><![CDATA[Huffman]]></surname>
<given-names><![CDATA[G. J.]]></given-names>
</name>
<name>
<surname><![CDATA[Adler]]></surname>
<given-names><![CDATA[R. F.]]></given-names>
</name>
<name>
<surname><![CDATA[Morrissey]]></surname>
<given-names><![CDATA[M.]]></given-names>
</name>
<name>
<surname><![CDATA[Bolvin]]></surname>
<given-names><![CDATA[D. T.]]></given-names>
</name>
<name>
<surname><![CDATA[Curtis]]></surname>
<given-names><![CDATA[S.]]></given-names>
</name>
<name>
<surname><![CDATA[Joyce]]></surname>
<given-names><![CDATA[R.]]></given-names>
</name>
<name>
<surname><![CDATA[McGayock]]></surname>
<given-names><![CDATA[B.]]></given-names>
</name>
<name>
<surname><![CDATA[Susskind]]></surname>
<given-names><![CDATA[J.]]></given-names>
</name>
</person-group>
<article-title xml:lang="en"><![CDATA[Global precipitation at one-degree daily resolution from multi-satellite observations]]></article-title>
<source><![CDATA[J. Hydrometeorol.]]></source>
<year>2001</year>
<volume>2</volume>
<page-range>36-50</page-range></nlm-citation>
</ref>
<ref id="B8">
<nlm-citation citation-type="journal">
<person-group person-group-type="author">
<name>
<surname><![CDATA[Huffman]]></surname>
<given-names><![CDATA[G. J.]]></given-names>
</name>
<name>
<surname><![CDATA[Adler]]></surname>
<given-names><![CDATA[R. F.]]></given-names>
</name>
<name>
<surname><![CDATA[Bolvin]]></surname>
<given-names><![CDATA[D. T.]]></given-names>
</name>
<name>
<surname><![CDATA[Gu]]></surname>
<given-names><![CDATA[G.]]></given-names>
</name>
</person-group>
<article-title xml:lang="en"><![CDATA[Improving the global precipitation record: GPCP Version 2.1]]></article-title>
<source><![CDATA[Geophys. Res. Lett.]]></source>
<year>2009</year>
<volume>36</volume>
</nlm-citation>
</ref>
<ref id="B9">
<nlm-citation citation-type="journal">
<person-group person-group-type="author">
<name>
<surname><![CDATA[Jury]]></surname>
<given-names><![CDATA[M. R.]]></given-names>
</name>
<name>
<surname><![CDATA[Enfield]]></surname>
<given-names><![CDATA[D. B.]]></given-names>
</name>
</person-group>
<article-title xml:lang="en"><![CDATA[Environmental patterns associated with active and inactive Caribbean hurricane seasons]]></article-title>
<source><![CDATA[J. Climate]]></source>
<year>2010</year>
<volume>23</volume>
<page-range>2146-2160</page-range></nlm-citation>
</ref>
<ref id="B10">
<nlm-citation citation-type="journal">
<person-group person-group-type="author">
<name>
<surname><![CDATA[Klotzbach]]></surname>
<given-names><![CDATA[P. J.]]></given-names>
</name>
</person-group>
<article-title xml:lang="en"><![CDATA[The influence of El Niño-Southern Oscillation and the Atlantic Multidecadal Oscillation on Caribbean tropical cyclones]]></article-title>
<source><![CDATA[J. Climate]]></source>
<year>2011</year>
<volume>24</volume>
<page-range>721-731</page-range></nlm-citation>
</ref>
<ref id="B11">
<nlm-citation citation-type="journal">
<person-group person-group-type="author">
<name>
<surname><![CDATA[Magaña]]></surname>
<given-names><![CDATA[V.]]></given-names>
</name>
<name>
<surname><![CDATA[Amador]]></surname>
<given-names><![CDATA[J.]]></given-names>
</name>
<name>
<surname><![CDATA[Medina]]></surname>
<given-names><![CDATA[S.]]></given-names>
</name>
</person-group>
<article-title xml:lang="en"><![CDATA[The midsummer drought over Mexico and Central America]]></article-title>
<source><![CDATA[J. Climate]]></source>
<year>1999</year>
<volume>12</volume>
<page-range>1577-1588</page-range></nlm-citation>
</ref>
<ref id="B12">
<nlm-citation citation-type="journal">
<person-group person-group-type="author">
<name>
<surname><![CDATA[Magaña]]></surname>
<given-names><![CDATA[V.]]></given-names>
</name>
</person-group>
<article-title xml:lang="en"><![CDATA[Interannual climate variability in the Mexico, Central America, and Caribbean region]]></article-title>
<source><![CDATA[CLIVAR Exchanges]]></source>
<year>2000</year>
<volume>16</volume>
<page-range>1-12</page-range></nlm-citation>
</ref>
<ref id="B13">
<nlm-citation citation-type="journal">
<person-group person-group-type="author">
<name>
<surname><![CDATA[Magaña]]></surname>
<given-names><![CDATA[V.]]></given-names>
</name>
<name>
<surname><![CDATA[Caetano]]></surname>
<given-names><![CDATA[E.]]></given-names>
</name>
</person-group>
<article-title xml:lang="en"><![CDATA[Temporal evolution of summer convective activity over the Americas warm pools]]></article-title>
<source><![CDATA[Geophys. Res. Lett.]]></source>
<year>2005</year>
<volume>32</volume>
</nlm-citation>
</ref>
<ref id="B14">
<nlm-citation citation-type="">
<person-group person-group-type="author">
<name>
<surname><![CDATA[Munroe]]></surname>
<given-names><![CDATA[R.]]></given-names>
</name>
<name>
<surname><![CDATA[Crawford]]></surname>
<given-names><![CDATA[T.]]></given-names>
</name>
<name>
<surname><![CDATA[Curtis]]></surname>
<given-names><![CDATA[S.]]></given-names>
</name>
</person-group>
<source><![CDATA[Geospatial analysis of space-time patterning of ENSO forced daily precipitation distributions in the Gulf of Mexico]]></source>
<year>2012</year>
</nlm-citation>
</ref>
<ref id="B15">
<nlm-citation citation-type="journal">
<person-group person-group-type="author">
<name>
<surname><![CDATA[Poveda]]></surname>
<given-names><![CDATA[G.]]></given-names>
</name>
<name>
<surname><![CDATA[Waylen]]></surname>
<given-names><![CDATA[P. R.]]></given-names>
</name>
<name>
<surname><![CDATA[Pulwarty]]></surname>
<given-names><![CDATA[R. S.]]></given-names>
</name>
</person-group>
<article-title xml:lang="en"><![CDATA[Annual and inter-annual variability of the present climate in northern South America and southern Mesoamerica]]></article-title>
<source><![CDATA[Palaeogeogr. Palaeoclimatol. Palaeoecol.]]></source>
<year>2006</year>
<volume>234</volume>
<page-range>3-27</page-range></nlm-citation>
</ref>
<ref id="B16">
<nlm-citation citation-type="journal">
<person-group person-group-type="author">
<name>
<surname><![CDATA[Reynolds]]></surname>
<given-names><![CDATA[R. W.]]></given-names>
</name>
<name>
<surname><![CDATA[Rayner]]></surname>
<given-names><![CDATA[N. A.]]></given-names>
</name>
<name>
<surname><![CDATA[Smith]]></surname>
<given-names><![CDATA[T. M.]]></given-names>
</name>
<name>
<surname><![CDATA[Stokes]]></surname>
<given-names><![CDATA[D. C.]]></given-names>
</name>
<name>
<surname><![CDATA[Wang]]></surname>
<given-names><![CDATA[W.]]></given-names>
</name>
</person-group>
<article-title xml:lang="en"><![CDATA[An improved in situ and satellite SST analysis for climate]]></article-title>
<source><![CDATA[J. Climate]]></source>
<year>2002</year>
<volume>15</volume>
<page-range>1609-1625</page-range></nlm-citation>
</ref>
<ref id="B17">
<nlm-citation citation-type="journal">
<person-group person-group-type="author">
<name>
<surname><![CDATA[Robertson]]></surname>
<given-names><![CDATA[A. W.]]></given-names>
</name>
<name>
<surname><![CDATA[Moron]]></surname>
<given-names><![CDATA[V.]]></given-names>
</name>
<name>
<surname><![CDATA[Swarinoto]]></surname>
<given-names><![CDATA[Y.]]></given-names>
</name>
</person-group>
<article-title xml:lang="en"><![CDATA[Seasonal predictability of daily rainfall statistics over the Indramayu district, Indonesia]]></article-title>
<source><![CDATA[Int. J. Climatol.]]></source>
<year>2009</year>
<volume>29</volume>
<page-range>1449-1462</page-range></nlm-citation>
</ref>
<ref id="B18">
<nlm-citation citation-type="journal">
<person-group person-group-type="author">
<name>
<surname><![CDATA[Ropelewski]]></surname>
<given-names><![CDATA[C. F.]]></given-names>
</name>
<name>
<surname><![CDATA[Bell]]></surname>
<given-names><![CDATA[M. A.]]></given-names>
</name>
</person-group>
<article-title xml:lang="en"><![CDATA[Shifts in the statistics of daily rainfall in South America conditional on ENSO phases]]></article-title>
<source><![CDATA[J. Climate]]></source>
<year>2008</year>
<volume>21</volume>
<page-range>849-865</page-range></nlm-citation>
</ref>
<ref id="B19">
<nlm-citation citation-type="journal">
<person-group person-group-type="author">
<name>
<surname><![CDATA[Wang]]></surname>
<given-names><![CDATA[C. Z.]]></given-names>
</name>
<name>
<surname><![CDATA[Enfield]]></surname>
<given-names><![CDATA[D. B.]]></given-names>
</name>
</person-group>
<article-title xml:lang="en"><![CDATA[The tropical Western Hemisphere warm pool]]></article-title>
<source><![CDATA[Geophys. Res. Lett.]]></source>
<year>2001</year>
<volume>28</volume>
<page-range>1635-1638</page-range></nlm-citation>
</ref>
<ref id="B20">
<nlm-citation citation-type="journal">
<person-group person-group-type="author">
<name>
<surname><![CDATA[Wang]]></surname>
<given-names><![CDATA[C. Z.]]></given-names>
</name>
<name>
<surname><![CDATA[Enfield]]></surname>
<given-names><![CDATA[D. B.]]></given-names>
</name>
</person-group>
<article-title xml:lang="en"><![CDATA[A further study of the tropical Western Hemisphere warm pool]]></article-title>
<source><![CDATA[J. Climate]]></source>
<year>2003</year>
<volume>16</volume>
<page-range>1476-1493</page-range></nlm-citation>
</ref>
<ref id="B21">
<nlm-citation citation-type="journal">
<person-group person-group-type="author">
<name>
<surname><![CDATA[Wang]]></surname>
<given-names><![CDATA[C. Z.]]></given-names>
</name>
<name>
<surname><![CDATA[Enfield]]></surname>
<given-names><![CDATA[D. B.]]></given-names>
</name>
<name>
<surname><![CDATA[Lee]]></surname>
<given-names><![CDATA[S. K.]]></given-names>
</name>
<name>
<surname><![CDATA[Landsea]]></surname>
<given-names><![CDATA[C. W.]]></given-names>
</name>
</person-group>
<article-title xml:lang="en"><![CDATA[Influences of the Atlantic warm pool on western hemisphere summer rainfall and Atlantic hurricanes]]></article-title>
<source><![CDATA[J. Climate]]></source>
<year>2006</year>
<volume>19</volume>
<page-range>3011-3028</page-range></nlm-citation>
</ref>
</ref-list>
</back>
</article>