<?xml version="1.0" encoding="ISO-8859-1"?><article xmlns:mml="http://www.w3.org/1998/Math/MathML" xmlns:xlink="http://www.w3.org/1999/xlink" xmlns:xsi="http://www.w3.org/2001/XMLSchema-instance">
<front>
<journal-meta>
<journal-id>0187-6236</journal-id>
<journal-title><![CDATA[Atmósfera]]></journal-title>
<abbrev-journal-title><![CDATA[Atmósfera]]></abbrev-journal-title>
<issn>0187-6236</issn>
<publisher>
<publisher-name><![CDATA[Universidad Nacional Autónoma de México, Instituto de Ciencias de la Atmósfera y Cambio Climático]]></publisher-name>
</publisher>
</journal-meta>
<article-meta>
<article-id>S0187-62362010000400002</article-id>
<title-group>
<article-title xml:lang="en"><![CDATA[Concentration of PM10 in the Metropolitan Area of Costa Rica, Central America: Chemical composition and potential sources]]></article-title>
</title-group>
<contrib-group>
<contrib contrib-type="author">
<name>
<surname><![CDATA[HERRERA MURILLO]]></surname>
<given-names><![CDATA[J.]]></given-names>
</name>
<xref ref-type="aff" rid="A01"/>
</contrib>
<contrib contrib-type="author">
<name>
<surname><![CDATA[ROJAS MARÍN]]></surname>
<given-names><![CDATA[J. F.]]></given-names>
</name>
<xref ref-type="aff" rid="A01"/>
</contrib>
<contrib contrib-type="author">
<name>
<surname><![CDATA[RODRÍGUEZ ROMÁN]]></surname>
<given-names><![CDATA[S.]]></given-names>
</name>
<xref ref-type="aff" rid="A02"/>
</contrib>
<contrib contrib-type="author">
<name>
<surname><![CDATA[BAEZ PEDRAJO]]></surname>
<given-names><![CDATA[A. P.]]></given-names>
</name>
<xref ref-type="aff" rid="A03"/>
</contrib>
</contrib-group>
<aff id="A01">
<institution><![CDATA[,Universidad Nacional Escuela de Ciencias Ambientales Laboratorio de Análisis Ambiental]]></institution>
<addr-line><![CDATA[Heredia ]]></addr-line>
<country>Costa Rica</country>
</aff>
<aff id="A02">
<institution><![CDATA[,Universidad de Costa Rica Escuela de Química ]]></institution>
<addr-line><![CDATA[San Pedro de Montes de Oca ]]></addr-line>
<country>Costa Rica</country>
</aff>
<aff id="A03">
<institution><![CDATA[,Universidad Nacional Autónoma de México Centro de Ciencias de la Atmósfera ]]></institution>
<addr-line><![CDATA[México D. F]]></addr-line>
<country>México</country>
</aff>
<pub-date pub-type="pub">
<day>01</day>
<month>10</month>
<year>2010</year>
</pub-date>
<pub-date pub-type="epub">
<day>01</day>
<month>10</month>
<year>2010</year>
</pub-date>
<volume>23</volume>
<numero>4</numero>
<fpage>307</fpage>
<lpage>323</lpage>
<copyright-statement/>
<copyright-year/>
<self-uri xlink:href="http://www.scielo.org.mx/scielo.php?script=sci_arttext&amp;pid=S0187-62362010000400002&amp;lng=en&amp;nrm=iso"></self-uri><self-uri xlink:href="http://www.scielo.org.mx/scielo.php?script=sci_abstract&amp;pid=S0187-62362010000400002&amp;lng=en&amp;nrm=iso"></self-uri><self-uri xlink:href="http://www.scielo.org.mx/scielo.php?script=sci_pdf&amp;pid=S0187-62362010000400002&amp;lng=en&amp;nrm=iso"></self-uri><abstract abstract-type="short" xml:lang="es"><p><![CDATA[Se realizaron mediciones de metales e iones inorgánicos presentes en muestras de PM10 colectadas en cinco sitios distribuidos en las ciudades de San José, Heredia y Belén. Las muestras fueron colectadas con muestreadores de alto volumen marca Thermo Andersen sobre filtros de fibra de vidrio y cuarzo. Los iones SO4(2-), NO3-, Cl-, F-, PO4(3-), NH4+, K+, Na+, Ca2+, Mg2+ fueron analizados por cromatografía de intercambio iónico, mientras que los metales traza (V, Cu, Cr, Pb, Ni, Mn y Fe) se cuantificaron por absorción atómica con horno de grafito. Los resultados obtenidos indican que el SO4(2-) es el ion más abundante, mientras que el Al y el Fe son los metales que presentan mayores concentraciones. Al aplicar correlaciones de Spearman a los datos, se muestra una alta correlación entre SO4(2-), NO3- NH4+ indicando un origen antrópico común. De las especies metálicas analizadas solamente el Pb y el Cu presentan factores de enriquecimiento mayores a 10, indicando una posible contribución de origen antrópico. Las partículas colectadas en la ciudad de Belén muestran un mayor nivel de acidez y contenido de metales debido a la concentración de importantes actividades industriales en la zona.]]></p></abstract>
<abstract abstract-type="short" xml:lang="en"><p><![CDATA[Measurements of metals and inorganic ions were carried out on PM10. Sampling was made in five sites distributed in San José, Heredia and Belén cities. Samples were collected using Thermo Andersen PM10 high volume samplers with glass fiber and quartz filters. The ions SO4(2-), NO3-, Cl-, F-, PO4(3-), NH4+, K+, Na+, Ca2+, Mg2+ were analyzed by ion chromatography and in the case of metals V, Cu, Cr, Pb, Ni, Mn, Fe, Al using an atomic absorption spectrometer with a graphite furnace attachment. The results indicated that SO4(2-) was the most abundant ion, and with respect to metals, Al and Fe had the highest concentration. Spearman correlation, applied to all data, showed a high correlation between SO4(2-), NO3- and NH4+ indicating a common anthropogenic origin. From the metal species that were assessed only Pb and Cu presented enrichment factors higher than 10, indicating an anthropogenic contribution. Particles collected in the industrial zone of Belén showed the highest level of acidity and metal content.]]></p></abstract>
<kwd-group>
<kwd lng="en"><![CDATA[Water soluble ions]]></kwd>
<kwd lng="en"><![CDATA[particulate matter]]></kwd>
<kwd lng="en"><![CDATA[metals]]></kwd>
<kwd lng="en"><![CDATA[Costa Rica]]></kwd>
</kwd-group>
</article-meta>
</front><body><![CDATA[ <p align="center"><font face="verdana" size="4"><b>Concentration of PM<Sub>10</Sub> in the Metropolitan Area of Costa Rica, Central America: Chemical composition and potential sources</b></font></p>     <p align="center"><font face="verdana" size="2">&nbsp;</font></p>     <p align="center"><font face="verdana" size="2"><b>J. HERRERA MURILLO, J. F. ROJAS MAR&Iacute;N    <br> </b><I>Laboratorio de An&aacute;lisis Ambiental, Escuela de Ciencias Ambientales, Universidad Nacional,    <br> Campus Omar Dengo, Heredia, Costa Rica. Corresponding author: J. Herrera Murillo; email:</I> <a href="mailto:jherrer@una.ac.cr">jherrer@una.ac.cr</a></font></p>     <p align="center"><font face="verdana" size="2"><b>S. RODR&Iacute;GUEZ ROM&Aacute;N    <br> </b><I>Escuela de Qu&iacute;mica, Universidad de Costa Rica, Ciudad Universitaria Rodrigo Facio San Pedro de Montes de Oca, Costa Rica</I></font></p>     <p align="center"><font face="verdana" size="2"><b>A. P. BAEZ PEDRAJO    <br> </b><I>Centro de Ciencias de la Atm&oacute;sfera, Universidad Nacional Aut&oacute;noma de M&eacute;xico    <br> Circuito Exterior, Ciudad Universitaria, M&eacute;xico D. F. M&eacute;xico</I></font></p>     ]]></body>
<body><![CDATA[<p align="center"><font face="verdana" size="2">&nbsp;</font></p>     <p align="center"><font face="verdana" size="2">Received December 8, 2009; Accepted June 21, 2010</font></p>     <p align="justify"><font face="verdana" size="2">&nbsp;</font></p>     <p align="justify"><font face="verdana" size="2"><b>RESUMEN</b></font></p>     <p align="justify"><font face="verdana" size="2">Se realizaron mediciones de metales e iones inorg&aacute;nicos presentes en muestras de PM<Sub>10</Sub> colectadas en cinco sitios distribuidos en las ciudades de San Jos&eacute;, Heredia y Bel&eacute;n. Las muestras fueron colectadas con muestreadores de alto volumen marca Thermo Andersen sobre filtros de fibra de vidrio y cuarzo. Los iones SO<Sub>4</Sub><Sup>2&#150;</Sup>, NO<Sub>3</Sub><Sup>&#150;</Sup>, Cl<Sup>&#150;</Sup>, F<Sup>&#150;</Sup>, PO<Sub>4</Sub><Sup>3&#150;</Sup>, NH<Sub>4</Sub><Sup>+</Sup>, K<Sup>+</Sup>, Na<Sup>+</Sup>, Ca<Sup>2+</Sup>, Mg<Sup>2+</Sup> fueron analizados por cromatograf&iacute;a de intercambio i&oacute;nico, mientras que los metales traza (V, Cu, Cr, Pb, Ni, Mn y Fe) se cuantificaron por absorci&oacute;n at&oacute;mica con horno de grafito. Los resultados obtenidos indican que el SO<Sub>4</Sub><Sup>2&#150; </Sup>es el ion m&aacute;s abundante, mientras que el Al y el Fe son los metales que presentan mayores concentraciones. Al aplicar correlaciones de Spearman a los datos, se muestra una alta correlaci&oacute;n entre SO<Sub>4</Sub><Sup>2&#150;</Sup>, NO<Sub>3</Sub><Sup>&#150;</Sup> NH<Sub>4</Sub><Sup>+</Sup> indicando un origen antr&oacute;pico com&uacute;n. De las especies met&aacute;licas analizadas solamente el Pb y el Cu presentan factores de enriquecimiento mayores a 10, indicando una posible contribuci&oacute;n de origen antr&oacute;pico. Las part&iacute;culas colectadas en la ciudad de Bel&eacute;n muestran un mayor nivel de acidez y contenido de metales debido a la concentraci&oacute;n de importantes actividades industriales en la zona.</font></p>     <p align="justify"><font face="verdana" size="2">&nbsp;</font></p>     <p align="justify"><font face="verdana" size="2"><b>ABSTRACT</b></font></p>     <p align="justify"><font face="verdana" size="2">Measurements of metals and inorganic ions were carried out on PM<Sub>10</Sub>. Sampling was made in five sites distributed in San Jos&eacute;, Heredia and Bel&eacute;n cities. Samples were collected using Thermo Andersen PM<Sub>10</Sub> high volume samplers with glass fiber and quartz filters. The ions SO<Sub>4</Sub><Sup>2&#150;</Sup>, NO<Sub>3</Sub><Sup>&#150;</Sup>, Cl<Sup>&#150;</Sup>, F<Sup>&#150;</Sup>, PO<Sub>4</Sub><Sup>3&#150;</Sup>, NH<Sub>4</Sub><Sup>+</Sup>, K<Sup>+</Sup>, Na<Sup>+</Sup>, Ca<Sup>2+</Sup>, Mg<Sup>2+</Sup> were analyzed by ion chromatography and in the case of metals V, Cu, Cr, Pb, Ni, Mn, Fe, Al using an atomic absorption spectrometer with a graphite furnace attachment. The results indicated that SO<Sub>4</Sub><Sup>2&#150;</Sup> was the most abundant ion, and with respect to metals, Al and Fe had the highest concentration. Spearman correlation, applied to all data, showed a high correlation between SO<Sub>4</Sub><Sup>2&#150;</Sup>, NO<Sub>3</Sub><Sup>&#150;</Sup> and NH<Sub>4</Sub><Sup>+</Sup> indicating a common anthropogenic origin. From the metal species that were assessed only Pb and Cu presented enrichment factors higher than 10, indicating an anthropogenic contribution. Particles collected in the industrial zone of Bel&eacute;n showed the highest level of acidity and metal content.</font></p>     <p align="justify"><font face="verdana" size="2"><B>Keywords</B>: Water soluble ions, particulate matter, metals, Costa Rica.</font></p>     <p align="justify"><font face="verdana" size="2">&nbsp;</font></p>     ]]></body>
<body><![CDATA[<p align="justify"><font face="verdana" size="2"><b>1.	Introduction</b></font></p>     <p align="justify"><font face="verdana" size="2"></B>The country of Costa Rica is crossed by a mountain range system running from NW to SE. The system includes many volcano cones with elevations up to 3600 m above sea level (asl), forming a central plateau known as the Gran Area Metropolitana (Metropolitan Area) at 1100 m asl with an area of about 3000 km<Sup>2</Sup>. This region contains 75% percent of the motor vehicles (734 200), 85% of the industry and 60% of the population (2,580,000) of the country, according to the latest census (INEC, 2000).</font></p>     <p align="justify"><font face="verdana" size="2">The Metropolitan Area is the highest&#150;ranking center in the urban system in Costa Rica as a result of productive activity, economic and public services that are concentrated in this area. Four cities form the Metropolitan Area (Alajuela, Heredia, Cartago and San Jos&eacute;) and many smaller population centers that, a few years ago, were in the middle of crop areas, but now, due to the region growth pattern, have been consolidated into a single urban center together with the main cities. Lack of urban planning has implicated a considerable ruin of air quality, as a result of growth experienced by the cities of the Metropolitan Area of Costa Rica during the past 20 years. Therefore, inhabitans have been exposed to annual average concentrations of PM<Sub>10</Sub> close to 46 &micro;g/m<Sup>3</Sup> (Herrera and Rodr&iacute;guez, 2007).</font></p>     <p align="justify"><font face="verdana" size="2">Atmospheric particles are made up of a mix of direct emissions generated from wide variety of sources and are formed by different mechanisms such as gas&#150;particle conversion. Particles have an important influence in the transmission of radiation in the atmosphere and water cycle. For this reason, they can alter the energy exchange system between earth and the atmosphere by absorbing and scattering solar radiation, directly affecting the climate (Meinrat <I>et al.</I>, 1997; Su and Chen, 1997; Qian <I>et al.</I>, 1999; Dusek <I>et al.</I>, 2006).</font></p>     <p align="justify"><font face="verdana" size="2">In addition, these particles can generate other effects to the environment, such as enrichment of coastal ecosystems due to air&#150;water transfer and impact on health, worsening conditions such as asthma, chronic bronchitis and decreased lung function, among others (USEPA, 1997).</font></p>     <p align="justify"><font face="verdana" size="2">The assessment of chemical composition of particle determines not only their toxicological potential and behavior on the environment (Pacyna, 1998), but also it becomes a very valuable aid to assess the contribution of different sources, especially when developing strategies to control and reduce air pollution (Simpson <I>et al.</I>, 2003; Bessagnet <I>et al.</I>, 2004).</font></p>     <p align="justify"><font face="verdana" size="2">For the reasons mentioned above, this study determines concentrations of V, Cr, Cu, Ni, Pb, Mn, Fe, Al and inorganic ions SO<Sub>4</Sub><Sup>2&#150;</Sup>, NO<Sub>3</Sub><Sup>&#150;</Sup>, Cl<Sup>&#150;</Sup>, F<Sup>&#150;</Sup>, PO<Sub>4</Sub><Sup>3&#150;</Sup>, NH<Sub>4</Sub><Sup>+</Sup>, K<Sup>+</Sup>, Na<Sup>+</Sup>, Ca<Sup>2+</Sup>, Mg<Sup>2+</Sup> in PM<Sub>10</Sub> collected in five sites of the Costa Rican Metropolitan Area during May to November, 2007.</font></p>     <p align="justify"><font face="verdana" size="2">&nbsp;</font></p>     <p align="justify"><font face="verdana" size="2"><b>2.	Experimental</b></font></p>     <p align="justify"><font face="verdana" size="2"><I>2.1 Sampling</I></font></p>     ]]></body>
<body><![CDATA[<p align="justify"><font face="verdana" size="2">For the PM<Sub>10</Sub> sampling, five monitoring sites were selected (<a href="#t1">Table I</a>). The sites were representative of commercial, industrial and residential areas, all located in the municipalities of San Jos&eacute;, Heredia and Bel&eacute;n. All of them belongs to Costa Rica metropolitan area. <a href="/img/revistas/atm/v23n4/a2f1.jpg" target="_blank">Figure 1</a> shows the spatial distribution of the sampling sites.</font></p>     <p align="center"><font face="verdana" size="2"><a name="t1"></a></font></p>     <p align="center"><font face="verdana" size="2"><img src="/img/revistas/atm/v23n4/a2t1.jpg"></font></p>     <p align="justify"><font face="verdana" size="2">Sampling campaign was conducted between May and November 2007. Samples were collected three times a week: Mondays, Wednesdays and Fridays. To collect the samples, five high volume air samplers, Thermo Andersen with MFC (mass flow controller) were used during 24 &plusmn; 1 h, with a flow rate of 1.13 &plusmn; 10% m<Sup>3</Sup> min<Sup>&#150;1</Sup>. Once every three samplings, flow calibration of each sampler was performed comparing the readings of pressure drop generated by the flow passing through a calibrated critical orifice, Tisch Variflo model 454, with the sampler drop pressure reading.</font></p>     <p align="justify"><font face="verdana" size="2">For each sampling, ambient temperature and atmospheric pressure readings were taken using a Kestrel anemometer model 5000.</font></p>     <p align="justify"><font face="verdana" size="2">For sampling collection, Whatman Cat No. 1829&#150;932 fiberglass filters were used twice a week. Whatman Cat No. 1851&#150;865 quartz filters were used for the subsequent analysis of metals at least once a week. For the inorganic ions analysis, the samples collected in glass fiber filters and quartz were used for a total of three samples per week, while for analysis of metals only the filters of quartz (a weekly sample) were used. Those filters were conditioned at least 24 h in a desiccator under the following conditions: temperature of 15&#150;30 &deg;C and humidity less than 40%, before being weighted in an analytical balance. Plastic bags with hermetic seals were used to transport the filters to the field and back to the laboratory.</font></p>     <p align="justify"><font face="verdana" size="2"><I>2.2 Chemical analysis</I></font></p>     <p align="justify"><font face="verdana" size="2"><I>2.2.1 Inorganic ions</I></font></p>     <p align="justify"><font face="verdana" size="2">From each filter, a strip of 2.54 cm wide and 23.0 cm in length was cut. Then, it was placed in a 150 mL beaker and 75 mL of deionized water (DW) was added. After that, they were located in an ultrasonic bath tempered at 35 &deg;C for 60 minutes. The obtained extract was transferred quantitatively to a 100 mL volumetric flask, then a portion was filtered for further analysis.</font></p>     <p align="justify"><font face="verdana" size="2">
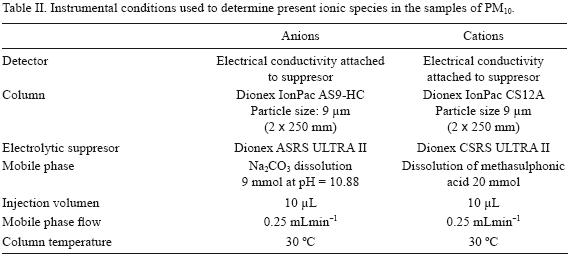
The analysis of ionic species was performed by microbore suppresed ion chromatography with suppression using a Dionex ICS&#150;3000 equipment with a quaternary pump, according to the specifications listed in <a href="#t2">Table II</a>.</font></p>     ]]></body>
<body><![CDATA[<p align="center"><font face="verdana" size="2"><a name="t2"></a></font></p>     <p align="center"><font face="verdana" size="2"><img src="/img/revistas/atm/v23n4/a2t2.jpg"></font></p>     <p align="justify"><font face="verdana" size="2">Ionic species were identified and quantified by interpolation in a calibration curve of seven standard solutions prepared in a working range of 0.25 to 10 mgL<Sup>&#150;1</Sup> for anions and 0.10 to 8 mgL<Sup>&#150;1</Sup> for cations, from 1000 mgL<Sup>&#150;1</Sup> stock solutions prepared from certified salts, Merck Suprapur. A fresh calibration curve was prepared for every 20 samples, together with a dissolution of quality control of 5 mgL<Sup>&#150;1</Sup> prepared from a certified Dionex synthetic sample. All the above steps were done in order to monitor the response and reproducibility of the peak shape and retention times.</font></p>     <p align="justify"><font face="verdana" size="2">In addition, the detection limit for each ion were determined. To achieve this, 10 sample blanks of different filters measured once at a time, using the same analysis procedure applied to collected samples, were analyzed. Detection limits were calculated by the concentration that generates a signal equal to the average of the signal of the blanks plus three times the blank's standard deviation. The results are shown in <a href="#t3">Table III</a>.</font></p>     <p align="center"><font face="verdana" size="2"><a name="t3"></a></font></p>     <p align="center"><font face="verdana" size="2"><img src="/img/revistas/atm/v23n4/a2t3.jpg"></font></p>     <p align="justify"><font face="verdana" size="2"><I>2.2.2 Metals</I></font></p>     <p align="justify"><font face="verdana" size="2">The 2.54 by 23 cm strip for the quartz fiber filters were extracted in a 150 mL beaker by adding 5 ml of ultra&#150;pure concentrated nitric acid and 25 ml DW were added, and heated on a hot plate until almost dryness. The solution remaining was poured into a 25 mL volumetric flask and DW was added up the mark.</font></p>     <p align="justify"><font face="verdana" size="2">Analysis of metals was made using atomic absorption spectrometry with an equipped Perkin Elmer Analyst 700 graphite furnace with autosampler. Metal species were identified and quantified by interpolation in a calibration curve of five standard solutions prepared in a working range from 5 to 50 &micro;gL<Sup>&#150;1</Sup> for V, Cu, Cr, Ni, Pb, Fe and Al, and 5 to 30 &micro;gL<Sup>&#150;1</Sup> for Mn, from the following 1000 mgL<Sup>&#150;1</Sup> certified commercial dissolutions, Perkin Elmer with traceability to NIST. Detection limits in ngm<Sup>&#150;3</Sup>, using the IUPAC method, were obtained. The results are shown in <a href="#t3">Table III</a>.</font></p>     <p align="justify"><font face="verdana" size="2">Blank filters were analyzed for metals and inorganic ions, obtaining lower concentrations of 5% of those found in samples.</font></p>     ]]></body>
<body><![CDATA[<p align="justify"><font face="verdana" size="2">&nbsp;</font></p>     <p align="justify"><font face="verdana" size="2"><b>3.	Results and discussion</b></font></p>     <p align="justify"><font face="verdana" size="2"><I>3.1 Chemical composition</I></font></p>     <p align="justify"><font face="verdana" size="2">The average and the standard deviation of valid data concentration of PM<Sub>10</Sub>, ions and metals, for each of the sampling site, are presented in <a href="#t4">Table IV</a>. According to the obtained results, only the sampling site REC&#150;HE, has an annual average value greater than 50 &micro;gm<Sup>&#150;3</Sup> (Reference value for PM<Sub>10</Sub> in Decree 30221&#150;S "Limits inmission of air pollutants in Costa Rica". The average concentration of PM<Sub>10</Sub>, were found to be higher for sites located in high traffic flow and industrial areas (41&#150;58 &micro;gm<Sup>&#150;3</Sup>) than for those sites in commercial/residential mixed areas (30&#150;33 &micro;gm<Sup>&#150;3</Sup>).</font></p>     <p align="center"><font face="verdana" size="2"><a name="t4"></a></font></p>     <p align="center"><font face="verdana" size="2"><img src="/img/revistas/atm/v23n4/a2t4.jpg"></font></p>     <p align="justify"><font face="verdana" size="2">The predominants ions were found to be SO<Sub>4</Sub><Sup>2&#150;</Sup> and Na<Sup>+</Sup> followed by Cl<Sup>&#150;</Sup>, PO<Sub>4</Sub><Sup>3&#150;</Sup>, NH<Sub>4</Sub><Sup>+</Sup> and NO<Sub>3</Sub><Sup>&#150;</Sup> for those with high vehicular flow (CCLR&#150;BE, CAT&#150;SJ and REC&#150;HE) while in the sites of the commercial/residential areas, the concentration of PO<Sub>4</Sub><Sup>3&#150;</Sup> turned out to be greater than that of Cl<Sup>&#150;</Sup>. Ionic constituents represent 22.0, 20.0, 14.6, 20.8 and 15.7% of total mass of PM<Sub>10</Sub>, collected in the sampling sites of CAT&#150;SJ, JE&#150;SJ, REC&#150;HE, GOB&#150;SJ and CCLR&#150;BE, respectively. In the case of metals, Fe, Al, Mn and Cu concentrations were the most abundant in PM<Sub>10</Sub>, while Cr and Ni were the less abundant species with exception of the sites located in Heredia, where the Cr concentration was higher. This can be explained because the city of Heredia has an important concentration of metal&#150;mechanic industries and high traffic flow.</font></p>     <p align="justify"><font face="verdana" size="2">To determine the degree of similarity or difference of the found PM<Sub>10</Sub>, ions and metals concentrations between the different sampling sites, the divergence ratio was calculated. It is defined as follows (Park and Kim, 2004):</font></p>     <p align="center"><font face="verdana" size="2"><img src="/img/revistas/atm/v23n4/a2s1.jpg"></font></p>     <p align="justify"><font face="verdana" size="2">where <I>x</I><Sub><I>ij</I></Sub> represents the average concentration of chemical species <I>i</I> in a given sampling site. Meanwhile,<I> j</I> and <I>k</I> represent two sampling sites and <I>p</I> the number of chemical components. If the value of CD is close to zero, data from both sites are considered to be similar. Otherwise, if the value tends to one, both are seen as different sites. <a href="#t5">Table V</a> presents the calculated CD values from the PM<Sub>10</Sub> and 16 different chemical species (ions and metals) for all the sampling sites. Based on the results, it can be noticed that the biggest differences are found between the site located in industrial zone (CCLR&#150;BE) and those located in urban centers, especially with low vehicular flow such as JE&#150;SJ. However, differences between coefficients are very small, so it can be inferred that large&#150;scale transportation phenomena in the metropolitan area is more important that the contribution of local sources of emission.</font></p>     ]]></body>
<body><![CDATA[<p align="center"><font face="verdana" size="2"><a name="t5"></a></font></p>     <p align="center"><font face="verdana" size="2"><img src="/img/revistas/atm/v23n4/a2t5.jpg"></font></p>     <p align="justify"><font face="verdana" size="2">In order to obtain a better explanation of the differences between the monitoring sites, the analyzed chemical species in the particles were divided into 5 classes: crustal origin, contribution of secondary components, sea salt, smoke and metals. The contribution of each category was estimated from the results of chemical analysis and the following guidelines: (1) crustal origin = concentration Al / 0.08, (2) contribution of secondary components = concentration SO<Sub>4</Sub><Sup>2&#150;</Sup> + concentration NO<Sub>3</Sub><Sup>&#150;</Sup> + concentration NH<Sub>4</Sub><Sup>+</Sup>, (3) sea salt = 2.54 (concentration Na &#150; 0.3 concentration Al ), and here the expression (concentration Na &#150; 0.3 concentration Al) represents the fraction of sodium that comes only from the marine aerosol (Chan <I>et al.</I>, 1997), (4) smoke (calculated from the K fraction of non&#150;crustal original) = concentration K &#150; 0.25 concentration Al (Chan <I>et al.</I>, 1997), (5) metals = the total of mass from all metals analized in the particles. The contribution of the five categories to PM<Sub>10 </Sub>is shown in <a href="#f2">Figure 2</a>, where it can be seen that crustal origin particles are the main contributor in all the sites. In addition, it can be noted that contribution of marine aerosol is greater for sites located in Heredia city, due to the pattern of prevailing winds in the large metropolitan area, while the greatest contribution of metals is found in Bel&eacute;n, where there is a significant concentration of industrial activities.</font></p>     <p align="center"><font face="verdana" size="2"><a name="f2"></a></font></p>     <p align="center"><font face="verdana" size="2"><img src="/img/revistas/atm/v23n4/a2f2.jpg"></font></p>     <p align="justify"><font face="verdana" size="2"><I>3.2 Chemical forms of the main ionic species present in PM</I><Sub><I>10</I></Sub></font></p>     <p align="justify"><font face="verdana" size="2">Chemical forms of the ions present in particles were determined from the calculation of Spearman correlations (<a href="#t6">Table VI</a>). It can be seen that NH<Sub>4</Sub><Sup>+</Sup> is strongly correlated with SO<Sub>4</Sub><Sup>2&#150; </Sup>and NO<Sub>3</Sub><Sup>&#150;</Sup>. According to the results showed in <a href="#t6">Table VI</a>, it is suggested that the species that may be present in PM<Sub>10</Sub> are: NaCl, KNO<Sub>3</Sub>, MgSO<Sub>4</Sub>, (NH<Sub>4</Sub>)<Sub>2</Sub>SO<Sub>4</Sub>, NaNO<Sub>3</Sub>, NH<Sub>4</Sub>NO<Sub>3</Sub> and CaSO<Sub>4</Sub>.</font></p>     <p align="center"><font face="verdana" size="2"><a name="t6"></a></font></p>     <p align="center"><font face="verdana" size="2"><img src="/img/revistas/atm/v23n4/a2t6.jpg"></font></p>     <p align="justify"><font face="verdana" size="2">An important portion of NO<Sub>3</Sub><Sup>&#150;</Sup> present in PM<Sub>10</Sub> can reasonably be attributed to NH<Sub>4</Sub>NO<Sub>3</Sub> presence. The main mechanism of secondary production of SO<Sub>4</Sub><Sup>2&#150;</Sup> and NO<Sub>3</Sub><Sup>&#150;</Sup>  includes ammonium according to the following reactions (Seinfeld, 1998):</font></p>     ]]></body>
<body><![CDATA[<p align="center"><font face="verdana" size="2"><img src="/img/revistas/atm/v23n4/a2s2.jpg"></font></p>     <p align="center"><font face="verdana" size="2"><img src="/img/revistas/atm/v23n4/a2s4.jpg"></font></p>     <p align="justify"><font face="verdana" size="2">
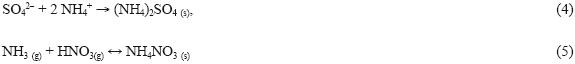
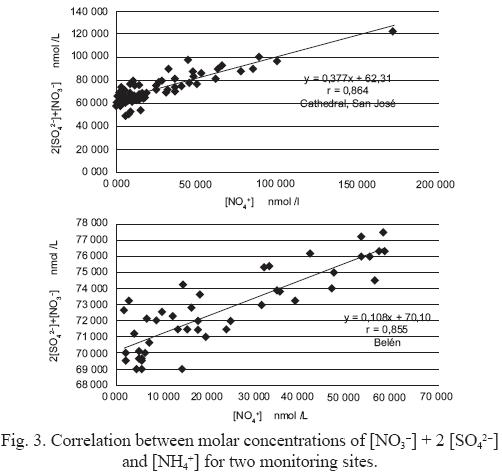
Equations (2) to 5 indicate that each mole of SO<Sub>4</Sub><Sup>2&#150;</Sup> can remove 2 moles of gaseous phase ammonia and, if there is an excess, it can react with HNO<Sub>3(g)</Sub> to produce NH<Sub>4</Sub>NO<Sub>3</Sub>. Molar concentrations of 2 &#91;SO<Sub>4</Sub><Sup>2&#150;</Sup>&#93; + &#91;NO<Sub>3</Sub><Sup>&#150;</Sup>&#93; obtained for the five monitoring sites, are strongly correlated with molar concentrations of &#91;NH<Sub>4</Sub><Sup>+</Sup>&#93;, supporting the hypothesis that NH<Sub>4</Sub>NO<Sub>3</Sub> and (NH<Sub>4</Sub>)<Sub>2</Sub>SO<Sub>4</Sub> are the prevalent chemical forms of sulfate and nitrate in PM<Sub>10</Sub> particles (<a href="#f3">Fig. 3</a>).</font></p>     <p align="center"><font face="verdana" size="2"><a name="f3"></a></font></p>     <p align="center"><font face="verdana" size="2"><img src="/img/revistas/atm/v23n4/a2f3.jpg"></font></p>     <p align="justify"><font face="verdana" size="2">Using this same concept, Chu (2004) defined the index of availability of ammonium (J), as the relations between molar concentration of ammonia, present in PM<Sub>10</Sub> and the concentration required for neutralize the concentration of sulfate and nitrate present in the sample according to the following equation:</font></p>     <p align="center"><font face="verdana" size="2"><img src="/img/revistas/atm/v23n4/a2s6.jpg"></font></p>     <p align="justify"><font face="verdana" size="2">If J &gt; 100%, the atmosphere is rich in ammonia. In <a href="#f3">Figure 3</a>, the slopes of the linear regression curves are &lt;1 for all the sampling sites, indicating that the average values of J are &gt;100%. Because of this, it can be concluded that sampling environments are rich in ammonia.</font></p>     <p align="justify"><font face="verdana" size="2"><I>3.3 Fraction of ionic compounds in PM</I><Sub><I>10</I></Sub><I> due to the contribution of marine aerosol</I></font></p>     <p align="justify"><font face="verdana" size="2">The pattern of prevailing winds in the large Metropolitan Area of Costa Rica supports the transport of air masses from the ocean to the central plateau&#894; during the dry season, appears the persistent trade winds (NE), with high speeds of 30 kmh<Sup>&#150;1</Sup> between January, February and March. In the rainy season, the trade winds lessen the intensity in the morning, at approximately 10:00 a.m., bringing the breeze of the Pacific, heading West, Southwest, it enters to this area and forms a "front breeze", encouraging the formation of cumulus&#150;kind clouds of vertical development enough to cause rains and thunderstorms. Because of this, it is important to assess the contribution of marine aerosol in composition of PM<Sub>10</Sub> particles. To estimate this contribution, it is necessary to calculate the fraction of the various inorganic components influenced by marine aerosol. Ions like SO<Sub>4</Sub><Sup>2&#150;</Sup>, K<Sup>+</Sup>, Mg<Sup>2+ </Sup>and Ca<Sup>2+ </Sup>have both marine and continental sources. Based on mass relation of these ions with respect to Na<Sup>+</Sup>, the component due to marine aerosol can be calculated using the following equation (Duce <I>et al.</I>, 1983):</font></p>     ]]></body>
<body><![CDATA[<p align="center"><font face="verdana" size="2"><img src="/img/revistas/atm/v23n4/a2s7.jpg"></font></p>     <p align="justify"><font face="verdana" size="2">Where:</font></p>     <p align="justify"><font face="verdana" size="2">&#91;X / Na&#93;<Sub>am</Sub><B><I>= </I></B>the mass relation of X ion with respect to Na<Sup>+</Sup> in seawater</font></p>     <p align="justify"><font face="verdana" size="2">Mx = ion X concentration in PM<Sub>10</Sub></font></p>     <p align="justify"><font face="verdana" size="2">M<Sub>Na</Sub>= Na<Sup>+</Sup> concentration in PM<Sub>10</Sub></font></p>     <p align="justify"><font face="verdana" size="2">Mass relation of ions SO<Sub>4</Sub><Sup>2+</Sup>, K<Sup>+</Sup>, Mg<Sup>2+</Sup> and Ca<Sup>2+</Sup> with respect to Na<Sup>+</Sup> in seawater is 0.25, 0.037, 0.038 and 0.12, respectively (Berg, 1978). The difference between the ion concentration present in particles and component due to marine contribution corresponds to the fraction originated by different sources to the marine aerosol &#91;X&#93;<Sub>nam</Sub>. <a href="/img/revistas/atm/v23n4/a2f4.jpg" target="_blank">Figure 4</a> shows the distribution for each sampling site, and the fraction due to marine aerosol as the assigned to other sources. Examining the case of SO<Sub>4</Sub><Sup>&#150;2</Sup>, it appears that approximately 87% of mass concentration of this ion has a different origin to marine aerosols. In the case of K<Sup>+</Sup> and Ca<Sup>2+</Sup>, this fraction represents at least 95 % of the different sampling sites. On the continent, fraction SO<Sub>4</Sub><Sup>2&#150;</Sup> that do not come from marine aerosol is a tracer of anthropogenic activities and burning of fossil fuels, K<Sub>nam</Sub> mostly originates by burning biomass whereas Ca<Sub>nam</Sub> has a predominantly crustal origin.</font></p>     <p align="justify"><font face="verdana" size="2"><I>3.4 Spatial variation of aerosol acidity</I></font></p>     <p align="justify"><font face="verdana" size="2">
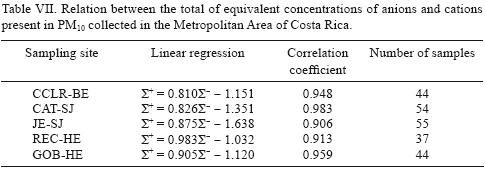
The relation between the total of the equivalent concentration (&mu;eqm<Sup>&#150;3</Sup>) of cations divided by the corresponding amount of anions in PM<Sub>10</Sub> can be used to estimate the acidity of aerosols. The characteristics of the linear regression of the total of anions and cations, for the five monitoring sites, are shown in <a href="#t7">Table VII</a>.</font></p>     <p align="center"><font face="verdana" size="2"><a name="t7"></a></font></p>     <p align="center"><font face="verdana" size="2"><img src="/img/revistas/atm/v23n4/a2t7.jpg"></font></p>     ]]></body>
<body><![CDATA[<p align="justify"><font face="verdana" size="2">As indicated in the slope of the linear regression curve, the acidity of the particles is lower in sites located in Heredia city, while the higher level is presented in the industrial area of Bel&eacute;n. This result may be due to the fact that contribution of marine aerosol and crustal component of particles is greater for REC&#150;HE in Heredia.</font></p>     <p align="justify"><font face="verdana" size="2"><I>3.5 Enrichment factors</I></font></p>     <p align="justify"><font face="verdana" size="2">Elementary relation in particles samples can provide important information to understand its possible origin. In this way, enrichment factors of the elements present in aerosols, with respect to the concentration in the crustal material, are frequently calculated in order to identify possible sources and the contribution of anthropogenic emissions to metal levels PM<Sub>10</Sub> (Zoller <I>et al.</I>, 1974; Duce <I>et al.</I>, 1975). If the value of the enrichment factor is close to the unity, the item has a predominantly crustal origin. However, due to differences between the crustal composition in different regions around the globe, values of enrichment factor between 1 and 10, are considered to be of natural origin. Elements such as Al, Si, Ti, Fe are commonly used as a point of reference for the calculation of factors, because they are very abundant in crustal material and are not significantly affected by pollution. In this study, to estimate those factors Fe was used as the reference, and the upper continental crustal concentration was taken from Taylor and McLennan (1985).</font></p>     <p align="justify"><font face="verdana" size="2">The enrichment factor of an E element in a sample of aerosol, is defined as:</font></p>     <p align="center"><font face="verdana" size="2"><img src="/img/revistas/atm/v23n4/a2s8.jpg"></font></p>     <p align="justify"><font face="verdana" size="2">where <I>R</I> is the reference element.</font></p>     <p align="justify"><font face="verdana" size="2">The values of enrichment factors calculated from data of metals concentration of metals present in the particles collected in the Metropolitan Area of Costa Rica, are shown in <a href="#t8">Table VIII</a>. They have the following sequence: Pb&gt; Cu&gt; V&gt; Mn&gt; Ni&gt; Fe&gt; Al&gt; Cr for the two sites in San Jose city, while for the remaining sites Cu has the higher enrichment factor followed by Pb.</font></p>     <p align="center"><font face="verdana" size="2"><a name="t8"></a></font></p>     <p align="center"><font face="verdana" size="2"><img src="/img/revistas/atm/v23n4/a2t8.jpg"></font></p>     <p align="justify"><font face="verdana" size="2">Pb and Cu represent <I>EF</I> values in the range of 10&#150;1000, indicating that concentration of these elements in particles is enriched by sources that are not of crustal origin such as combustion of fossil hydrocarbons, vehicular traffic, emissions of metalworking industries (electrical cable, piping and cabinet industries, for example). Smaller values were obtained for EF V, Mn and Ni showing that its main source is crustal with a very low, almost zero, input from anthropogenic sources.</font></p>     ]]></body>
<body><![CDATA[<p align="justify"><font face="verdana" size="2"><I>3.6 Statistical analysis</I></font></p>     <p align="justify"><font face="verdana" size="2">Spearman correlation matrix was created for each of the five sampling sites of PM<Sub>10 </Sub>(<a href="/img/revistas/atm/v23n4/a2t9.jpg" target="_blank">Table IX</a>) for data on concentrations of inorganic ions and metals present in PM<Sub>10</Sub>. The following patterns can be shown:</font></p>     <p align="justify"><font face="verdana" size="2">&#150;Sampling sites located in areas of high vehicular flow (REC&#150;HE and CAT&#150;SJ) have a well&#150;defined pattern of correlation between PM<Sub>10</Sub>, SO<Sub>4</Sub><Sup>2&#150;</Sup>, NO<Sub>3</Sub><Sup>&#150;</Sup> and NH<Sub>4</Sub><Sup>+</Sup>, which can be associated with emissions, mainly from mobile sources, indicating that these species could have a common anthropogenic origin.</font></p>     <p align="justify"><font face="verdana" size="2">&#150;For the site CCLR&#150;BE, significant correlations are obtained between species such as metal Cr&#150;Al, Pb&#150;Mn, Ni&#150;V and Pb&#150;Cu showing the influence of both emissions from stationary sources (metalworking industry, combustion processes, etc.) and vehicle exhaust.</font></p>     <p align="justify"><font face="verdana" size="2">&#150;The CCLR&#150;BE, REC&#150;HE and GOB&#150;HE sites showed one important correlation between V and SO<Sub>4</Sub><Sup>&#150;2</Sup> that indicates one possible contribution of emissions originated in industrial combustion of jet fuel. This sites have an important influence of industrial areas located near of them in comparation with San Jos&eacute; City, that is mostly a comercial zone.</font></p>     <p align="justify"><font face="verdana" size="2">&#150;It is important to emphasize that for REC&#150;HE and GOB&#150;HE, an important pattern of correlation is observed between: Na&#150;Cl, PM<Sub>10</Sub> &#150;Ca, Ca&#150;Mg and PM<Sub>10</Sub>&#150;Mg that demonstrates the importance of crustal contribution and marine aerosol contribution for particle composition on these sites.</font></p>     <p align="justify"><font face="verdana" size="2">In addition, a principal component analysis was applied to particle data, and metal ions in each of the sites. This method is used as an aid in finding and interpreting complex and casual relations between variables of the same set of data. In this study, the most important contribution of analysis of main components is the elucidation of possible sources that could explain the chemical composition of PM<Sub>10</Sub>. The results are shown in <a href="/img/revistas/atm/v23n4/a2t10.jpg" target="_blank">Table X</a>.</font></p>     <p align="justify"><font face="verdana" size="2">In the case of the sampling site CCLR&#150;BE located in the industrial area of Bel&eacute;n, four factors were found. The first factor, which explains 44.3% of the total variance, includes SO<Sub>4</Sub><Sup>2&#150;</Sup>, NH<Sub>4</Sub><Sup>+</Sup>, V, Pb, Cr, Cu, Ni, Mn and Al, which indicates the important contribution of emission sources from combustion processes of oil and metal&#150;mechanic industry located in the city. The second factor, with a 26.8%, includes the influence of vehicular traffic for having PM<Sub>10</Sub>, SO<Sub>4</Sub><Sup>&#150;2</Sup>, NO<Sub>3</Sub><Sup>&#150;</Sup>. The third factor explains the 16% and may be associated with the crustal origin, this included Mg<Sup>2+</Sup>, Fe, Al and Cr. Finally the fourth factor, with 11.5%, includes Na, K and Cl, evidencing the influence of marine aerosol in the composition of PM<Sub>10</Sub>.</font></p>     <p align="justify"><font face="verdana" size="2">For CAT&#150;SJ, four factors were found too. The first factor explains 40.8% of total variance and includes PM<Sub>10</Sub>, NO<Sub>3</Sub><Sup>&#150;</Sup>, SO<Sub>4</Sub><Sup>2&#150;</Sup>, NH<Sub>4</Sub><Sup>+</Sup>, Cu and Cr, it can suggest the contribution of mobile combustion sources in the particles chemical composition. It is important to remember that this point is located in one high traffic flow zone. Comparing with other sites, the possible contribution of mobile combustion sources in this site is higher. The second factor with 14.4%, includes Na and Cl and can suggest the marine contribution. Third and fourth factor, with 22.2 and 14.3%, respectively, show the crustal contribution to PM<Sub>10</Sub> composition and includes K, Fe, Ni and Al. Ni was present in two important minerals, (Ni, Fe)<Sub>x</Sub>S<Sub>y</Sub> and (Ni, Mg)SiO<Sub>3</Sub>&bull;nH<Sub>2</Sub>O in soils of this region. The third factor includes K and Al and this can show a possible contribution of feldespats.</font></p>     <p align="justify"><font face="verdana" size="2">The principal components analysis applied to the data generated from collected samples in the transition zones (between commercial and residential areas), likes GOB&#150;HE showed that the main factor that explains the data variance, PC1 with 30.3%, includes PM<Sub>10</Sub>, Na, K, Cl, Mg, Ca, leaving out the importance of marine aerosol in the chemical composition of the particles. In addition, a second factor was obtained, linked to emissions from vehicular traffic (SO<Sub>4</Sub><Sup>&#150;2</Sup>, NH<Sub>4</Sub><Sup>+</Sup>, NO<Sub>3</Sub><Sup>&#150;</Sup>, V, Mn), explaining 23.9% of the variance. The third factor includes Mn, Ni, Mg, Ca and K that can shown the crustal contribution, with the 20.5%. It is important indicate that the fourth factor with 21.2%, shows the contribution of antropogenic sources, for example industrial source emisions.</font></p>     ]]></body>
<body><![CDATA[<p align="justify"><font face="verdana" size="2">&nbsp;</font></p>     <p align="justify"><font face="verdana" size="2"><b>4.	Conclusions</b></font></p>     <p align="justify"><font face="verdana" size="2">It can be concluded that, although the statistical tests indicate that there is no significant difference between particle composition in the sampling sites located in Metropolitan Area of Costa Rica, the patterns of correlation and principal component analysis indicate that the sources that affect the variability of the data differ between sites. That is why, while in CAT&#150;SJ and REC&#150;HE (commercial sites with high traffic flow), there is a strong influence of anthropogenic emissions from mobile sources as evidenced by the correlations between PM<Sub>10</Sub>&#150;SO<Sub>4</Sub><Sup>2&#150;</Sup>, PM<Sub>10</Sub> &#150; NO<Sub>3</Sub><Sup>&#150;</Sup>, NO<Sub>3</Sub><Sup>&#150;</Sup> &#150; SO<Sub>4</Sub><Sup>2&#150;</Sup> and NH<Sub>4</Sub><Sup>+</Sup> &#150; SO<Sub>4</Sub><Sup>2&#150;</Sup>, in the case of CCLR&#150;BE, for being in an industrial area, there are significant correlations of V &#150; SO<Sub>4</Sub><Sup>2&#150;</Sup>, Pb &#150; SO<Sub>4</Sub><Sup>2&#150;</Sup>, Cr &#150; Al, Pb &#150; Mn, V &#150; Ni and Pb &#150; Cu. This characterizes the influence of emissions from industrial sources that use heavy fuels such as bunker and large&#150;scale metallurgical processes.</font></p>     <p align="justify"><font face="verdana" size="2">The differences between sources that affect the variability of the chemical composition of the particles determine some properties as the acidity. The particles collected in Heredia have a lower acidity; due to a greater contribution of marine aerosol, San Jos&eacute; and Bel&eacute;n have a higher degree of acidity caused in part by higher concentrations of secondary components such as NO<Sub>3</Sub><Sup>&#150;</Sup> and SO<Sub>4</Sub><Sup>2&#150;</Sup>. This suggests that potential impacts in materials, ecosystems and human health can be greater in San Jos&eacute; and Bel&eacute;n.</font></p>     <p align="justify"><font face="verdana" size="2">According to data obtained for metals concentrations in particles, only in the case of Pb and Cu enrichment factors are significant (over 10), however, it is necessary to pay attention to the fact that in the case of Bel&eacute;n, V has an important enrichment, that could be explained by the high concentration of industrial activities in the area, where heavy fuels (that contents this element) are consumed.</font></p>     <p align="justify"><font face="verdana" size="2">Due to the geomorphology of the Costa Rican territory, the influence of marine aerosol plays a key role in the chemical composition of PM<Sub>10</Sub> samples, this being responsible for 13% and 5% of magnesium and sulfate, respectively, present in PM<Sub>10</Sub>.</font></p>     <p align="justify"><font face="verdana" size="2">&nbsp;</font></p>     <p align="justify"><font face="verdana" size="2"><b>Acknowledgments</b></font></p>     <p align="justify"><font face="verdana" size="2">The authors are grateful to the OVSICORI&#150;UNA, Municipality of San Jos&eacute;, Health Ministry and Meteorological Institute of Costa Rica for the collaboration provided to conduct this study.</font></p>     <p align="justify"><font face="verdana" size="2">&nbsp;</font></p>     ]]></body>
<body><![CDATA[<p align="justify"><font face="verdana" size="2"><b>References</b></font></p>     <!-- ref --><p align="justify"><font face="verdana" size="2">Andreae M. O. and P. J. Crutzen, 1997. Atmospheric aerosols: biogeochemical sources and role in atmospheric chemistry. <I>Science</I> <B>276</B>, 1052&#150;1058.    &nbsp;&nbsp;&nbsp;&nbsp;&nbsp;&nbsp;&nbsp;&nbsp;[&#160;<a href="javascript:void(0);" onclick="javascript: window.open('/scielo.php?script=sci_nlinks&ref=1277551&pid=S0187-6236201000040000200001&lng=','','width=640,height=500,resizable=yes,scrollbars=1,menubar=yes,');">Links</a>&#160;]<!-- end-ref --></font></p>     <!-- ref --><p align="justify"><font face="verdana" size="2">Arimoto R., R. A. Duce, D. L. Savoie, J. M. Prospero, R. Talbot, J. D. Cullen, U. Tomza, N. F. Lewis and B. J. Ray, 1996. Relationships among aerosol constituents from Asia and the North Pacific during Pem&#150;West A. <I>J. Geophys. Res</I>. <B>101</B>, 2011&#150;2023.    &nbsp;&nbsp;&nbsp;&nbsp;&nbsp;&nbsp;&nbsp;&nbsp;[&#160;<a href="javascript:void(0);" onclick="javascript: window.open('/scielo.php?script=sci_nlinks&ref=1277553&pid=S0187-6236201000040000200002&lng=','','width=640,height=500,resizable=yes,scrollbars=1,menubar=yes,');">Links</a>&#160;]<!-- end-ref --></font></p>     <!-- ref --><p align="justify"><font face="verdana" size="2">Berg W. W. Jr. and J. W. Winchestor, 1978. Aerosol chemistry of marine atmosphere. In: <I>Chemical Oceanography</I> 7th ed. (J. P. Riley and R. Chester Eds.) Academic Press, London, 173&#150;231.    &nbsp;&nbsp;&nbsp;&nbsp;&nbsp;&nbsp;&nbsp;&nbsp;[&#160;<a href="javascript:void(0);" onclick="javascript: window.open('/scielo.php?script=sci_nlinks&ref=1277555&pid=S0187-6236201000040000200003&lng=','','width=640,height=500,resizable=yes,scrollbars=1,menubar=yes,');">Links</a>&#160;]<!-- end-ref --></font></p>     <!-- ref --><p align="justify"><font face="verdana" size="2">Bessagnet B., A. Hodzic, R. Vautard, M. Beekmann, S. Cheinet, C. Honore, C. Liousse and L. Rouil, 2004. Aerosol modeling with CHIMERE&#150;preliminary evaluation at the continental scale. <I>Atmos. Environ</I>. <B>38</B>, 2803&#150;2817.    &nbsp;&nbsp;&nbsp;&nbsp;&nbsp;&nbsp;&nbsp;&nbsp;[&#160;<a href="javascript:void(0);" onclick="javascript: window.open('/scielo.php?script=sci_nlinks&ref=1277557&pid=S0187-6236201000040000200004&lng=','','width=640,height=500,resizable=yes,scrollbars=1,menubar=yes,');">Links</a>&#160;]<!-- end-ref --></font></p>     <!-- ref --><p align="justify"><font face="verdana" size="2">Chan Y. C., R. W. Simpson, G. H. McTainsh, P. D. Vowles, D. D. Cohen and G. M. Bailey, 1997. Characterisation of chemical species in PM2.5 and PM10 aerosols in Brisbane, Australia. <I>Atmos. Environ</I>. <B>31</B>, 3773&#150;3785.    &nbsp;&nbsp;&nbsp;&nbsp;&nbsp;&nbsp;&nbsp;&nbsp;[&#160;<a href="javascript:void(0);" onclick="javascript: window.open('/scielo.php?script=sci_nlinks&ref=1277559&pid=S0187-6236201000040000200005&lng=','','width=640,height=500,resizable=yes,scrollbars=1,menubar=yes,');">Links</a>&#160;]<!-- end-ref --></font></p>     <!-- ref --><p align="justify"><font face="verdana" size="2">Chu S.&#150;H., 2004. PM<Sub>2.5</Sub> episodes as observed in the speciation trends network. <I>Atmos. Environ</I>. <B>38</B>, 5237&#150;5246.    &nbsp;&nbsp;&nbsp;&nbsp;&nbsp;&nbsp;&nbsp;&nbsp;[&#160;<a href="javascript:void(0);" onclick="javascript: window.open('/scielo.php?script=sci_nlinks&ref=1277561&pid=S0187-6236201000040000200006&lng=','','width=640,height=500,resizable=yes,scrollbars=1,menubar=yes,');">Links</a>&#160;]<!-- end-ref --></font></p>     <!-- ref --><p align="justify"><font face="verdana" size="2">Duce R. A., G. L. Hoffman and W. H. Zoller, 1975. Atmospheric trace metals at remote northern and southern hemisphere sites: Pollution or natural. <I>Science</I> <B>187</B>, 59&#150;61.    &nbsp;&nbsp;&nbsp;&nbsp;&nbsp;&nbsp;&nbsp;&nbsp;[&#160;<a href="javascript:void(0);" onclick="javascript: window.open('/scielo.php?script=sci_nlinks&ref=1277563&pid=S0187-6236201000040000200007&lng=','','width=640,height=500,resizable=yes,scrollbars=1,menubar=yes,');">Links</a>&#160;]<!-- end-ref --></font></p>     <!-- ref --><p align="justify"><font face="verdana" size="2">Duce R. A., R. Arimoto, B. J. Ray, C. K. Unni and P. J. Harder, 1983. Atmospheric trace elements at Enewetak Atoll 1, concentrations, sources and temporal variability. <I>J. Geophys. Res</I>. <B>88</B>, 5321&#150;5342.    &nbsp;&nbsp;&nbsp;&nbsp;&nbsp;&nbsp;&nbsp;&nbsp;[&#160;<a href="javascript:void(0);" onclick="javascript: window.open('/scielo.php?script=sci_nlinks&ref=1277565&pid=S0187-6236201000040000200008&lng=','','width=640,height=500,resizable=yes,scrollbars=1,menubar=yes,');">Links</a>&#160;]<!-- end-ref --></font></p>     <!-- ref --><p align="justify"><font face="verdana" size="2">Dusek U., G. P. Frank, L. Hildebrandt, J. Curtius, J. Schneider, S. Walter, D. Chand, F. Drewnick, S. Hings, D. Jung, S., Borrmann and M. O. Andreae, 2006. Size matters more than chemistry for cloud&#150;nucleating ability of aerosol particles. <I>Scienc</I>e <B>312</B>, 1375&#150;1378.    &nbsp;&nbsp;&nbsp;&nbsp;&nbsp;&nbsp;&nbsp;&nbsp;[&#160;<a href="javascript:void(0);" onclick="javascript: window.open('/scielo.php?script=sci_nlinks&ref=1277567&pid=S0187-6236201000040000200009&lng=','','width=640,height=500,resizable=yes,scrollbars=1,menubar=yes,');">Links</a>&#160;]<!-- end-ref --></font></p>     <!-- ref --><p align="justify"><font face="verdana" size="2">Herrera J. and S. Rodr&iacute;guez, 2007. Cuarto Informe de Calidad del Aire de la ciudad de San Jos&eacute; (2007). Informe t&eacute;cnico, Universidad Nacional, 15&#150;16.    &nbsp;&nbsp;&nbsp;&nbsp;&nbsp;&nbsp;&nbsp;&nbsp;[&#160;<a href="javascript:void(0);" onclick="javascript: window.open('/scielo.php?script=sci_nlinks&ref=1277569&pid=S0187-6236201000040000200010&lng=','','width=640,height=500,resizable=yes,scrollbars=1,menubar=yes,');">Links</a>&#160;]<!-- end-ref --></font></p>     <!-- ref --><p align="justify"><font face="verdana" size="2">INEC, 2002. Compendio de Estad&iacute;sticas del Cant&oacute;n Central de San Jos&eacute;. Informe T&eacute;cnico, Instituto Nacional de Estad&iacute;stica y Censos, 23&#150;26.    &nbsp;&nbsp;&nbsp;&nbsp;&nbsp;&nbsp;&nbsp;&nbsp;[&#160;<a href="javascript:void(0);" onclick="javascript: window.open('/scielo.php?script=sci_nlinks&ref=1277571&pid=S0187-6236201000040000200011&lng=','','width=640,height=500,resizable=yes,scrollbars=1,menubar=yes,');">Links</a>&#160;]<!-- end-ref --></font></p>     <!-- ref --><p align="justify"><font face="verdana" size="2">Meinrat O. A. and P. J. Crutzen, 1997. Atmospheric aerosols: biogeochemical sources and role in atmospheric chemistry. <I>Science</I> <B>276</B>, 1052&#150;1058.    &nbsp;&nbsp;&nbsp;&nbsp;&nbsp;&nbsp;&nbsp;&nbsp;[&#160;<a href="javascript:void(0);" onclick="javascript: window.open('/scielo.php?script=sci_nlinks&ref=1277573&pid=S0187-6236201000040000200012&lng=','','width=640,height=500,resizable=yes,scrollbars=1,menubar=yes,');">Links</a>&#160;]<!-- end-ref --></font></p>     <!-- ref --><p align="justify"><font face="verdana" size="2">Pacyna J. M., 1998. Source inventories for atmospheric trace metals. In: Atmospheric Particles (R. M. Harrison and R. E. van Grieken, Eds.). IUPAC Series on Analytical and Physical Chemistry of Environmental Systems, vol. 5. Wiley, Chichester, UK, 385&#150;423.    &nbsp;&nbsp;&nbsp;&nbsp;&nbsp;&nbsp;&nbsp;&nbsp;[&#160;<a href="javascript:void(0);" onclick="javascript: window.open('/scielo.php?script=sci_nlinks&ref=1277575&pid=S0187-6236201000040000200013&lng=','','width=640,height=500,resizable=yes,scrollbars=1,menubar=yes,');">Links</a>&#160;]<!-- end-ref --></font></p>     <!-- ref --><p align="justify"><font face="verdana" size="2">Park S. S. and Y. J. Kim, 2004. PM2.5 particles and size&#150;segregated ionic species measured during fall season in three urban sites in Korea. <I>Atmos. Environ</I>. <B>38</B>, 1459&#150;1471.    &nbsp;&nbsp;&nbsp;&nbsp;&nbsp;&nbsp;&nbsp;&nbsp;[&#160;<a href="javascript:void(0);" onclick="javascript: window.open('/scielo.php?script=sci_nlinks&ref=1277577&pid=S0187-6236201000040000200014&lng=','','width=640,height=500,resizable=yes,scrollbars=1,menubar=yes,');">Links</a>&#160;]<!-- end-ref --></font></p>     <!-- ref --><p align="justify"><font face="verdana" size="2">Qian Y., C. B. Fu and S. Y. Wang, 1999. Mineral dust and climate change. <I>Advance in Earth Science</I> <B>14</B>, 391&#150;394 (in Chinese with English abstract).    &nbsp;&nbsp;&nbsp;&nbsp;&nbsp;&nbsp;&nbsp;&nbsp;[&#160;<a href="javascript:void(0);" onclick="javascript: window.open('/scielo.php?script=sci_nlinks&ref=1277579&pid=S0187-6236201000040000200015&lng=','','width=640,height=500,resizable=yes,scrollbars=1,menubar=yes,');">Links</a>&#160;]<!-- end-ref --></font></p>     <!-- ref --><p align="justify"><font face="verdana" size="2">Seinfeld J. H. and S. N. Pandis, 1998. <I>Atmospheric chemistry and physics from air pollution to climate change</I>. Wiley, New York. 1345 pp.    &nbsp;&nbsp;&nbsp;&nbsp;&nbsp;&nbsp;&nbsp;&nbsp;[&#160;<a href="javascript:void(0);" onclick="javascript: window.open('/scielo.php?script=sci_nlinks&ref=1277581&pid=S0187-6236201000040000200016&lng=','','width=640,height=500,resizable=yes,scrollbars=1,menubar=yes,');">Links</a>&#160;]<!-- end-ref --></font></p>     <!-- ref --><p align="justify"><font face="verdana" size="2">Simpson D., H. Fagerli, J. E. Johnson, S. Tsyro, P. Wind and J.&#150;P. Tuovinen, 2003. Transboundary acidification, eutrophication and ground level ozone in Europe&#150;Part I. Unified EMEP Model description. EMEP Status Report 1/2003. Meteorological Synthesizing Centre&#150;West, Oslo. 325 pp.    &nbsp;&nbsp;&nbsp;&nbsp;&nbsp;&nbsp;&nbsp;&nbsp;[&#160;<a href="javascript:void(0);" onclick="javascript: window.open('/scielo.php?script=sci_nlinks&ref=1277583&pid=S0187-6236201000040000200017&lng=','','width=640,height=500,resizable=yes,scrollbars=1,menubar=yes,');">Links</a>&#160;]<!-- end-ref --></font></p>     <!-- ref --><p align="justify"><font face="verdana" size="2">Su W. Y. and C. H. Chen, 1997. The effects of aerosol optical absorption characteristics on lower atmospheric heating rates. <I>Plateau Meteorol</I>. <B>16</B>, 353&#150;358.    &nbsp;&nbsp;&nbsp;&nbsp;&nbsp;&nbsp;&nbsp;&nbsp;[&#160;<a href="javascript:void(0);" onclick="javascript: window.open('/scielo.php?script=sci_nlinks&ref=1277585&pid=S0187-6236201000040000200018&lng=','','width=640,height=500,resizable=yes,scrollbars=1,menubar=yes,');">Links</a>&#160;]<!-- end-ref --></font></p>     <!-- ref --><p align="justify"><font face="verdana" size="2">Taylor S. R. and S. M. McLennan, 1985. <I>The continental crust: Its composition and evolution</I>. Blackwell, Oxford, UK. 317 pp.    &nbsp;&nbsp;&nbsp;&nbsp;&nbsp;&nbsp;&nbsp;&nbsp;[&#160;<a href="javascript:void(0);" onclick="javascript: window.open('/scielo.php?script=sci_nlinks&ref=1277587&pid=S0187-6236201000040000200019&lng=','','width=640,height=500,resizable=yes,scrollbars=1,menubar=yes,');">Links</a>&#160;]<!-- end-ref --></font></p>     <!-- ref --><p align="justify"><font face="verdana" size="2">USEPA, 1997. Technology Transfer Network OAR Policy and GuidanceWebsite. United States Environmental Protection Agency. <a href="http://www.epa.gov/ttn/oarpg/naaqsfin/pmhealth.html" target="_blank">http://www.epa.gov/ttn/oarpg/naaqsfin/pmhealth.html</a>. (September, 23, 2009).    &nbsp;&nbsp;&nbsp;&nbsp;&nbsp;&nbsp;&nbsp;&nbsp;[&#160;<a href="javascript:void(0);" onclick="javascript: window.open('/scielo.php?script=sci_nlinks&ref=1277589&pid=S0187-6236201000040000200020&lng=','','width=640,height=500,resizable=yes,scrollbars=1,menubar=yes,');">Links</a>&#160;]<!-- end-ref --></font></p>     <!-- ref --><p align="justify"><font face="verdana" size="2">Xiao H. and C. Liu, 2004. Chemical characteristics of water soluble components in TSP over Guiyang, SW China, 2003. <I>Atmos. Environ</I>. <B>38</B>, 6297&#150;6306.    &nbsp;&nbsp;&nbsp;&nbsp;&nbsp;&nbsp;&nbsp;&nbsp;[&#160;<a href="javascript:void(0);" onclick="javascript: window.open('/scielo.php?script=sci_nlinks&ref=1277591&pid=S0187-6236201000040000200021&lng=','','width=640,height=500,resizable=yes,scrollbars=1,menubar=yes,');">Links</a>&#160;]<!-- end-ref --></font></p>     <!-- ref --><p align="justify"><font face="verdana" size="2">Yao X., C. K. Chan, M. Fang, S. Cadle, T. Chan, P. Mulawa, K. He and B. Ye, 2002. The water&#150;soluble ionic composition of PM2.5 in Shanghai and Beijing, China. <I>Atmos. Environ</I>. <B>36</B>, 4223&#150;4234.    &nbsp;&nbsp;&nbsp;&nbsp;&nbsp;&nbsp;&nbsp;&nbsp;[&#160;<a href="javascript:void(0);" onclick="javascript: window.open('/scielo.php?script=sci_nlinks&ref=1277593&pid=S0187-6236201000040000200022&lng=','','width=640,height=500,resizable=yes,scrollbars=1,menubar=yes,');">Links</a>&#160;]<!-- end-ref --></font></p>     <!-- ref --><p align="justify"><font face="verdana" size="2">Zoller W. H., R. A. Gordon and R.A. Duce, 1974. Atmospheric concentrations and sources of trace metals at the South Pole. <I>Science</I> <B>183</B>, 198&#150;200.    &nbsp;&nbsp;&nbsp;&nbsp;&nbsp;&nbsp;&nbsp;&nbsp;[&#160;<a href="javascript:void(0);" onclick="javascript: window.open('/scielo.php?script=sci_nlinks&ref=1277595&pid=S0187-6236201000040000200023&lng=','','width=640,height=500,resizable=yes,scrollbars=1,menubar=yes,');">Links</a>&#160;]<!-- end-ref --></font></p>      ]]></body><back>
<ref-list>
<ref id="B1">
<nlm-citation citation-type="journal">
<person-group person-group-type="author">
<name>
<surname><![CDATA[Andreae]]></surname>
<given-names><![CDATA[M. O]]></given-names>
</name>
<name>
<surname><![CDATA[Crutzen]]></surname>
<given-names><![CDATA[P. J]]></given-names>
</name>
</person-group>
<article-title xml:lang="en"><![CDATA[Atmospheric aerosols: biogeochemical sources and role in atmospheric chemistry]]></article-title>
<source><![CDATA[Science]]></source>
<year>1997</year>
<volume>276</volume>
<page-range>1052-1058</page-range></nlm-citation>
</ref>
<ref id="B2">
<nlm-citation citation-type="journal">
<person-group person-group-type="author">
<name>
<surname><![CDATA[Arimoto]]></surname>
<given-names><![CDATA[R]]></given-names>
</name>
<name>
<surname><![CDATA[Duce]]></surname>
<given-names><![CDATA[R. A]]></given-names>
</name>
<name>
<surname><![CDATA[Savoie]]></surname>
<given-names><![CDATA[D. L]]></given-names>
</name>
<name>
<surname><![CDATA[Prospero]]></surname>
<given-names><![CDATA[J. M]]></given-names>
</name>
<name>
<surname><![CDATA[Talbot]]></surname>
<given-names><![CDATA[R]]></given-names>
</name>
<name>
<surname><![CDATA[Cullen]]></surname>
<given-names><![CDATA[J. D]]></given-names>
</name>
<name>
<surname><![CDATA[Tomza]]></surname>
<given-names><![CDATA[U]]></given-names>
</name>
<name>
<surname><![CDATA[Lewis]]></surname>
<given-names><![CDATA[N. F]]></given-names>
</name>
<name>
<surname><![CDATA[Ray]]></surname>
<given-names><![CDATA[B. J]]></given-names>
</name>
</person-group>
<article-title xml:lang="en"><![CDATA[Relationships among aerosol constituents from Asia and the North Pacific during Pem-West A]]></article-title>
<source><![CDATA[J. Geophys. Res]]></source>
<year>1996</year>
<volume>101</volume>
<page-range>2011-2023</page-range></nlm-citation>
</ref>
<ref id="B3">
<nlm-citation citation-type="book">
<person-group person-group-type="author">
<name>
<surname><![CDATA[Berg]]></surname>
<given-names><![CDATA[W. W]]></given-names>
</name>
<name>
<surname><![CDATA[Winchestor]]></surname>
<given-names><![CDATA[J. W]]></given-names>
</name>
</person-group>
<article-title xml:lang="en"><![CDATA[Aerosol chemistry of marine atmosphere]]></article-title>
<person-group person-group-type="editor">
<name>
<surname><![CDATA[Riley]]></surname>
<given-names><![CDATA[J. P]]></given-names>
</name>
<name>
<surname><![CDATA[Chester]]></surname>
<given-names><![CDATA[R]]></given-names>
</name>
</person-group>
<source><![CDATA[Chemical Oceanography]]></source>
<year>1978</year>
<edition>7th</edition>
<page-range>173-231</page-range><publisher-loc><![CDATA[London ]]></publisher-loc>
<publisher-name><![CDATA[Academic Press]]></publisher-name>
</nlm-citation>
</ref>
<ref id="B4">
<nlm-citation citation-type="journal">
<person-group person-group-type="author">
<name>
<surname><![CDATA[Bessagnet]]></surname>
<given-names><![CDATA[B]]></given-names>
</name>
<name>
<surname><![CDATA[Hodzic]]></surname>
<given-names><![CDATA[A]]></given-names>
</name>
<name>
<surname><![CDATA[Vautard]]></surname>
<given-names><![CDATA[R]]></given-names>
</name>
<name>
<surname><![CDATA[Beekmann]]></surname>
<given-names><![CDATA[M]]></given-names>
</name>
<name>
<surname><![CDATA[Cheinet]]></surname>
<given-names><![CDATA[S]]></given-names>
</name>
<name>
<surname><![CDATA[Honore]]></surname>
<given-names><![CDATA[C]]></given-names>
</name>
<name>
<surname><![CDATA[Liousse]]></surname>
<given-names><![CDATA[C]]></given-names>
</name>
<name>
<surname><![CDATA[Rouil]]></surname>
<given-names><![CDATA[L]]></given-names>
</name>
</person-group>
<article-title xml:lang="en"><![CDATA[Aerosol modeling with CHIMERE-preliminary evaluation at the continental scale]]></article-title>
<source><![CDATA[Atmos. Environ]]></source>
<year>2004</year>
<volume>38</volume>
<page-range>2803-2817</page-range></nlm-citation>
</ref>
<ref id="B5">
<nlm-citation citation-type="journal">
<person-group person-group-type="author">
<name>
<surname><![CDATA[Chan]]></surname>
<given-names><![CDATA[Y. C]]></given-names>
</name>
<name>
<surname><![CDATA[Simpson]]></surname>
<given-names><![CDATA[R. W]]></given-names>
</name>
<name>
<surname><![CDATA[McTainsh]]></surname>
<given-names><![CDATA[G. H]]></given-names>
</name>
<name>
<surname><![CDATA[Vowles]]></surname>
<given-names><![CDATA[P. D]]></given-names>
</name>
<name>
<surname><![CDATA[Cohen]]></surname>
<given-names><![CDATA[D. D]]></given-names>
</name>
<name>
<surname><![CDATA[Bailey]]></surname>
<given-names><![CDATA[G. M]]></given-names>
</name>
</person-group>
<article-title xml:lang="en"><![CDATA[Characterisation of chemical species in PM2.5 and PM10 aerosols in Brisbane, Australia]]></article-title>
<source><![CDATA[Atmos. Environ]]></source>
<year>1997</year>
<volume>31</volume>
<page-range>3773-3785</page-range></nlm-citation>
</ref>
<ref id="B6">
<nlm-citation citation-type="journal">
<person-group person-group-type="author">
<name>
<surname><![CDATA[Chu]]></surname>
<given-names><![CDATA[S.-H]]></given-names>
</name>
</person-group>
<article-title xml:lang="en"><![CDATA[PM2.5 episodes as observed in the speciation trends network]]></article-title>
<source><![CDATA[Atmos. Environ]]></source>
<year>2004</year>
<volume>38</volume>
<page-range>5237-5246</page-range></nlm-citation>
</ref>
<ref id="B7">
<nlm-citation citation-type="journal">
<person-group person-group-type="author">
<name>
<surname><![CDATA[Duce]]></surname>
<given-names><![CDATA[R. A]]></given-names>
</name>
<name>
<surname><![CDATA[Hoffman]]></surname>
<given-names><![CDATA[G. L]]></given-names>
</name>
<name>
<surname><![CDATA[Zoller]]></surname>
<given-names><![CDATA[W. H]]></given-names>
</name>
</person-group>
<article-title xml:lang="en"><![CDATA[Atmospheric trace metals at remote northern and southern hemisphere sites: Pollution or natural]]></article-title>
<source><![CDATA[Science]]></source>
<year>1975</year>
<volume>187</volume>
<page-range>59-61</page-range></nlm-citation>
</ref>
<ref id="B8">
<nlm-citation citation-type="journal">
<person-group person-group-type="author">
<name>
<surname><![CDATA[Duce]]></surname>
<given-names><![CDATA[R. A]]></given-names>
</name>
<name>
<surname><![CDATA[Arimoto]]></surname>
<given-names><![CDATA[R]]></given-names>
</name>
<name>
<surname><![CDATA[Ray]]></surname>
<given-names><![CDATA[B. J]]></given-names>
</name>
<name>
<surname><![CDATA[Unni]]></surname>
<given-names><![CDATA[C. K]]></given-names>
</name>
<name>
<surname><![CDATA[Harder]]></surname>
<given-names><![CDATA[P. J]]></given-names>
</name>
</person-group>
<article-title xml:lang="en"><![CDATA[Atmospheric trace elements at Enewetak Atoll 1, concentrations, sources and temporal variability]]></article-title>
<source><![CDATA[J. Geophys. Res]]></source>
<year>1983</year>
<volume>88</volume>
<page-range>5321-5342</page-range></nlm-citation>
</ref>
<ref id="B9">
<nlm-citation citation-type="journal">
<person-group person-group-type="author">
<name>
<surname><![CDATA[Dusek]]></surname>
<given-names><![CDATA[U]]></given-names>
</name>
<name>
<surname><![CDATA[Frank]]></surname>
<given-names><![CDATA[G. P]]></given-names>
</name>
<name>
<surname><![CDATA[Hildebrandt]]></surname>
<given-names><![CDATA[L]]></given-names>
</name>
<name>
<surname><![CDATA[Curtius]]></surname>
<given-names><![CDATA[J]]></given-names>
</name>
<name>
<surname><![CDATA[Schneider]]></surname>
<given-names><![CDATA[J]]></given-names>
</name>
<name>
<surname><![CDATA[Walter]]></surname>
<given-names><![CDATA[S]]></given-names>
</name>
<name>
<surname><![CDATA[Chand]]></surname>
<given-names><![CDATA[D]]></given-names>
</name>
<name>
<surname><![CDATA[Drewnick]]></surname>
<given-names><![CDATA[F]]></given-names>
</name>
<name>
<surname><![CDATA[Hings]]></surname>
<given-names><![CDATA[S]]></given-names>
</name>
<name>
<surname><![CDATA[Jung]]></surname>
<given-names><![CDATA[D]]></given-names>
</name>
<name>
<surname><![CDATA[Borrmann]]></surname>
<given-names><![CDATA[S]]></given-names>
</name>
<name>
<surname><![CDATA[Andreae]]></surname>
<given-names><![CDATA[M. O]]></given-names>
</name>
</person-group>
<article-title xml:lang="en"><![CDATA[Size matters more than chemistry for cloud-nucleating ability of aerosol particles]]></article-title>
<source><![CDATA[Science]]></source>
<year>2006</year>
<volume>312</volume>
<page-range>1375-1378</page-range></nlm-citation>
</ref>
<ref id="B10">
<nlm-citation citation-type="book">
<person-group person-group-type="author">
<name>
<surname><![CDATA[Herrera]]></surname>
<given-names><![CDATA[J]]></given-names>
</name>
<name>
<surname><![CDATA[Rodríguez]]></surname>
<given-names><![CDATA[S]]></given-names>
</name>
</person-group>
<source><![CDATA[Cuarto Informe de Calidad del Aire de la ciudad de San José (2007)]]></source>
<year>2007</year>
<page-range>15-16</page-range><publisher-name><![CDATA[Universidad Nacional]]></publisher-name>
</nlm-citation>
</ref>
<ref id="B11">
<nlm-citation citation-type="book">
<collab>INEC</collab>
<source><![CDATA[Compendio de Estadísticas del Cantón Central de San José]]></source>
<year>2002</year>
<page-range>23-26</page-range><publisher-name><![CDATA[Instituto Nacional de Estadística y Censos]]></publisher-name>
</nlm-citation>
</ref>
<ref id="B12">
<nlm-citation citation-type="journal">
<person-group person-group-type="author">
<name>
<surname><![CDATA[Meinrat]]></surname>
<given-names><![CDATA[O. A]]></given-names>
</name>
<name>
<surname><![CDATA[Crutzen]]></surname>
<given-names><![CDATA[P. J]]></given-names>
</name>
</person-group>
<article-title xml:lang="en"><![CDATA[Atmospheric aerosols: biogeochemical sources and role in atmospheric chemistry]]></article-title>
<source><![CDATA[Science]]></source>
<year>1997</year>
<volume>276</volume>
<page-range>1052-1058</page-range></nlm-citation>
</ref>
<ref id="B13">
<nlm-citation citation-type="book">
<person-group person-group-type="author">
<name>
<surname><![CDATA[Pacyna]]></surname>
<given-names><![CDATA[J. M]]></given-names>
</name>
</person-group>
<article-title xml:lang="en"><![CDATA[Source inventories for atmospheric trace metals]]></article-title>
<person-group person-group-type="editor">
<name>
<surname><![CDATA[Harrison]]></surname>
<given-names><![CDATA[R. M]]></given-names>
</name>
<name>
<surname><![CDATA[van Grieken]]></surname>
<given-names><![CDATA[R. E]]></given-names>
</name>
</person-group>
<source><![CDATA[Atmospheric Particles]]></source>
<year>1998</year>
<volume>5</volume>
<page-range>385-423</page-range><publisher-loc><![CDATA[Chichester ]]></publisher-loc>
<publisher-name><![CDATA[Wiley]]></publisher-name>
</nlm-citation>
</ref>
<ref id="B14">
<nlm-citation citation-type="journal">
<person-group person-group-type="author">
<name>
<surname><![CDATA[Park]]></surname>
<given-names><![CDATA[S. S]]></given-names>
</name>
<name>
<surname><![CDATA[Kim]]></surname>
<given-names><![CDATA[Y. J]]></given-names>
</name>
</person-group>
<article-title xml:lang="en"><![CDATA[PM2.5 particles and size-segregated ionic species measured during fall season in three urban sites in Korea]]></article-title>
<source><![CDATA[Atmos. Environ]]></source>
<year>2004</year>
<volume>38</volume>
<page-range>1459-1471</page-range></nlm-citation>
</ref>
<ref id="B15">
<nlm-citation citation-type="journal">
<person-group person-group-type="author">
<name>
<surname><![CDATA[Qian]]></surname>
<given-names><![CDATA[Y]]></given-names>
</name>
<name>
<surname><![CDATA[Fu]]></surname>
<given-names><![CDATA[C. B]]></given-names>
</name>
<name>
<surname><![CDATA[Wang]]></surname>
<given-names><![CDATA[S. Y]]></given-names>
</name>
</person-group>
<article-title xml:lang="en"><![CDATA[Mineral dust and climate change]]></article-title>
<source><![CDATA[Advance in Earth Science]]></source>
<year>1999</year>
<volume>14</volume>
<page-range>391-394</page-range></nlm-citation>
</ref>
<ref id="B16">
<nlm-citation citation-type="book">
<person-group person-group-type="author">
<name>
<surname><![CDATA[Seinfeld]]></surname>
<given-names><![CDATA[J. H]]></given-names>
</name>
<name>
<surname><![CDATA[Pandis]]></surname>
<given-names><![CDATA[S. N]]></given-names>
</name>
</person-group>
<source><![CDATA[Atmospheric chemistry and physics from air pollution to climate change]]></source>
<year>1998</year>
<page-range>1345</page-range><publisher-loc><![CDATA[New York ]]></publisher-loc>
<publisher-name><![CDATA[Wiley]]></publisher-name>
</nlm-citation>
</ref>
<ref id="B17">
<nlm-citation citation-type="book">
<person-group person-group-type="author">
<name>
<surname><![CDATA[Simpson]]></surname>
<given-names><![CDATA[D]]></given-names>
</name>
<name>
<surname><![CDATA[Fagerli]]></surname>
<given-names><![CDATA[H]]></given-names>
</name>
<name>
<surname><![CDATA[Johnson]]></surname>
<given-names><![CDATA[J. E]]></given-names>
</name>
<name>
<surname><![CDATA[Tsyro]]></surname>
<given-names><![CDATA[S]]></given-names>
</name>
<name>
<surname><![CDATA[Wind]]></surname>
<given-names><![CDATA[P]]></given-names>
</name>
<name>
<surname><![CDATA[Tuovinen]]></surname>
<given-names><![CDATA[J.-P]]></given-names>
</name>
</person-group>
<source><![CDATA[Transboundary acidification, eutrophication and ground level ozone in Europe-Part I: Unified EMEP Model description]]></source>
<year>2003</year>
<page-range>325</page-range><publisher-loc><![CDATA[Oslo ]]></publisher-loc>
<publisher-name><![CDATA[Synthesizing Centre-West]]></publisher-name>
</nlm-citation>
</ref>
<ref id="B18">
<nlm-citation citation-type="journal">
<person-group person-group-type="author">
<name>
<surname><![CDATA[Su]]></surname>
<given-names><![CDATA[W. Y]]></given-names>
</name>
<name>
<surname><![CDATA[Chen]]></surname>
<given-names><![CDATA[C. H]]></given-names>
</name>
</person-group>
<article-title xml:lang="en"><![CDATA[The effects of aerosol optical absorption characteristics on lower atmospheric heating rates]]></article-title>
<source><![CDATA[Plateau Meteorol]]></source>
<year>1997</year>
<volume>16</volume>
<page-range>353-358</page-range></nlm-citation>
</ref>
<ref id="B19">
<nlm-citation citation-type="book">
<person-group person-group-type="author">
<name>
<surname><![CDATA[Taylor]]></surname>
<given-names><![CDATA[S. R]]></given-names>
</name>
<name>
<surname><![CDATA[McLennan]]></surname>
<given-names><![CDATA[S. M]]></given-names>
</name>
</person-group>
<source><![CDATA[The continental crust: Its composition and evolution]]></source>
<year>1985</year>
<page-range>317</page-range><publisher-loc><![CDATA[Oxford ]]></publisher-loc>
<publisher-name><![CDATA[Blackwell]]></publisher-name>
</nlm-citation>
</ref>
<ref id="B20">
<nlm-citation citation-type="book">
<collab>USEPA</collab>
<source><![CDATA[Technology Transfer Network OAR Policy and GuidanceWebsite]]></source>
<year>1997</year>
<publisher-name><![CDATA[United States Environmental Protection Agency]]></publisher-name>
</nlm-citation>
</ref>
<ref id="B21">
<nlm-citation citation-type="journal">
<person-group person-group-type="author">
<name>
<surname><![CDATA[Xiao]]></surname>
<given-names><![CDATA[H]]></given-names>
</name>
<name>
<surname><![CDATA[Liu]]></surname>
<given-names><![CDATA[C]]></given-names>
</name>
</person-group>
<article-title xml:lang="en"><![CDATA[Chemical characteristics of water soluble components in TSP over Guiyang, SW China, 2003]]></article-title>
<source><![CDATA[Atmos. Environ]]></source>
<year>2004</year>
<volume>38</volume>
<page-range>6297-6306</page-range></nlm-citation>
</ref>
<ref id="B22">
<nlm-citation citation-type="journal">
<person-group person-group-type="author">
<name>
<surname><![CDATA[Yao]]></surname>
<given-names><![CDATA[X]]></given-names>
</name>
<name>
<surname><![CDATA[Chan]]></surname>
<given-names><![CDATA[C. K]]></given-names>
</name>
<name>
<surname><![CDATA[Fang]]></surname>
<given-names><![CDATA[M]]></given-names>
</name>
<name>
<surname><![CDATA[Cadle]]></surname>
<given-names><![CDATA[S]]></given-names>
</name>
<name>
<surname><![CDATA[Chan]]></surname>
<given-names><![CDATA[T]]></given-names>
</name>
<name>
<surname><![CDATA[Mulawa]]></surname>
<given-names><![CDATA[P]]></given-names>
</name>
<name>
<surname><![CDATA[He]]></surname>
<given-names><![CDATA[K]]></given-names>
</name>
<name>
<surname><![CDATA[Ye]]></surname>
<given-names><![CDATA[B]]></given-names>
</name>
</person-group>
<article-title xml:lang="en"><![CDATA[The water-soluble ionic composition of PM2.5 in Shanghai and Beijing, China]]></article-title>
<source><![CDATA[Atmos. Environ]]></source>
<year>2002</year>
<volume>36</volume>
<page-range>4223-4234</page-range></nlm-citation>
</ref>
<ref id="B23">
<nlm-citation citation-type="journal">
<person-group person-group-type="author">
<name>
<surname><![CDATA[Zoller]]></surname>
<given-names><![CDATA[W. H]]></given-names>
</name>
<name>
<surname><![CDATA[Gordon]]></surname>
<given-names><![CDATA[R. A]]></given-names>
</name>
<name>
<surname><![CDATA[Duce]]></surname>
<given-names><![CDATA[R.A]]></given-names>
</name>
</person-group>
<article-title xml:lang="en"><![CDATA[Atmospheric concentrations and sources of trace metals at the South Pole]]></article-title>
<source><![CDATA[Science]]></source>
<year>1974</year>
<volume>183</volume>
<page-range>198-200</page-range></nlm-citation>
</ref>
</ref-list>
</back>
</article>
