
G. S. MEENA and D. B. JADHAV
Indian Institute of Tropical Meteorology, Pashan, Pune–411008, India
Corresponding author: G. S. Meena; e–mail: gsm@tropmet.res.in
Received March 21, 2006; accepted January 24, 2007
RESUMEN
El estudio de la variación diurna y estacional de los gases traza atmosféricos es esencial para entender nuestra atmósfera. Para esto, en el período 2000–2003 se realizaron observaciones diarias de luz zenital dispersa utilizando un espectrómetro UV–visible. Para observar las variaciones diurnas de NO2, O3, H2O y O4, se obtuvieron las densidades de columna inclinada (SCD) desde las mañanas (ángulo zenital solar (SZA) = 90º) hasta las tardes (SZA = 90º). Para el estudio de las variaciones estacionales de NO2 y O3, se obtuvieron las densidades de columna vertical (VCD) durante el período mencionado. Para los datos de VCD de NO2 y O3, se encontró una correlación positiva de r = 0.72 para las mañanas y de r = 0.79 para las tardes. Se compararon las observaciones de satélite con las espectroscópicas y se observó una buena correlación. Los valores más altos de VCD para NO2 y O3 aparecen en los meses de verano (mayo y junio) y los más bajos en los meses de invierno (diciembre y enero). Las VCD vespertinas del NO2 son más altas que las matutinas. Para la ciudad de Puna (18º32' N, 73º51' E) se encontró un cambio estacional interesante: las tasas vespertina/matutina (PM/AM) de NO2 y de las temperaturas máximas/mínimas son mayores en los meses de invierno que en los de verano para todo el período de estudio. En los meses de invierno la tasa PM/AM del NO2 llega hasta 3.8 y la menor para los meses de verano es de 1.25. Durante el día, el N2O5 puede fotolizarse para regenerar NO2, lo que se refleja en las tardes. En el invierno las noches son más largas, por lo que durante ellas la conversión de NO2 en N2O5 es mayor y los valores de NO2 son menores en las mañanas, lo que produce una tasa PM/AM elevada. La tasa PM/AM del O3 es ligeramente más elevada en los meses de invierno que en los de verano.
]]>ABSTRACT
Study of diurnal and seasonal variation of atmospheric trace gases is essential to understand our atmosphere. For this, daily zenith–sky scattered light observations have been made by UV–visible spectrometer during the period 2000–2003. Slant column densities (SCD) from morning (solar zenith angle SZA = 90º) to evening (SZA = 90º) were retrieved to see the diurnal variation of NO2, O3, H2O and O4. For the study of seasonal behavior of NO2 and O3, vertical column densities (VCD) were retrieved during the above period. For the whole period, NO2 and O3 VCD are found in a positive correlation of r = 0.72 for the morning data and r = 0.79 for the evening data. Satellites borne observations are compared with the spectroscopic observations, which are found in good correlation. It is seen that highest NO2 and O3 VCD are found in summer months (May and June) and lowest in winter months (December and January). Evening NO2 VCD are found higher compared to morning. There is found an interesting seasonal change that at Pune (18º32' N, 73º51' E), the evening–to–morning (PM/AM) ratios of NO2 as well as temperature maximum/minimum ratios are higher in winter months and lower in summer months during the above period. In winter months NO2 PM/AM ratio goes up to 3.8 and in summer months lowest ratio is 1.25. During the day, N2O5 can be photolyzed to regenerate NO2, which reflects in the evening hours. In the winter, nights are longest; therefore, during night NO2 to N2O5 conversion is more, hence in the morning NO2 value will be less that leads to high PM/AM ratio. O3 PM/AM ratio is slightly higher in winter months compared to summer months.
Keywords: Ozone, nitrogen dioxide, vertical column density, solar zenith angle, diurnal and seasonal variation.
1. Introduction
Tropospheric NO2 plays a key role in both stratospheric and tropospheric chemistry. In the troposphere the photolysis of NO2 results in the formation of O3 (Bradshaw et al., 2000). NO2 can react with O3 to form the nitrate radical (NO3), which is a strong oxidant and plays an important role in NOx polluted areas at night (Wayne, 1991).
Ozone is one of the most extensively measured trace gases in the atmosphere. Column amounts of O3 vary with season and altitude. WMO (1990a) has reported that the highest ozone abundances are found at high latitudes in winter and early spring, while the lowest values are located in the tropics. Most ozone is produced at low latitudes, where the solar irradiance is highest. Large day–to–day variations were found to be more at higher latitudes. Latitudinal and seasonal distributions of NO2 have been conducted by Kreher et al. (1995) and by Senne et al. (1996). Daily/seasonal variations in vertical column densities (VCD) of NO2 and O3 have been studied using spectroscopic observations (Syed et al., 1981; McKenzie and Johnston, 1982; Bhonde et al., 1992; Solomon et al., 1992; Kondo et al., 1994; Gil et al., 1996; Nichol et al., 1996; Koike et al., 1999; Jadhav et al., 1999; Meena et al., 2004).
Water vapour in the lower stratosphere is a very effective greenhouse gas. The atmospheric water vapour content responds to changes in temperature, microphysical processes and the atmospheric circulation. Water vapour concentration varies substantially in both the vertical and horizontal (Jayaraman and Subbaraya, 1988). Clouds are intimately connected to the water vapour pattern, as clouds occur in connection with high relative humidity, and cloud processes in turn affect the moisture distribution. In the atmospheric physics, O4 is also an absorber of solar radiation (e.g., Pfeilstickeret al., 1997; Solomon et al., 1998) and toll to infer atmospheric photon path lengths, and cloud heights (e.g., Erle et al., 1995). Pfeilsticker et al. (1997) have reported that O4 band does not saturate for cloudy skies. Therefore, O4 can be considered to identify the clouds, which affect the measurements.
In this paper, for the study of diurnal variation differential slant column densities (SCD) of NO2, O3, H2O and O4 are presented for few days from morning to evening. For the study of diurnal and seasonal variation of NO2 and O3, UV–visible spectrometer is operated during the period 2000–2003. Study of diurnal and seasonal variations of NO2 and O3 have been made and daily morning/evening variations in NO2 and O3 are discussed. The evening to morning (PM/AM) ratios of NO2 and O3 are discussed with maximum/minimum temperature ratios during this period. Spectroscopic observations are compared with satellite borne Nimbus–7 Total Ozone Mapping Spectrometer (TOMS) observations.
]]>2. Methodology
Zenith scattered light spectra recorded with the spectrometer are analyzed using differential optical absorption spectroscopy (DOAS) technique (Noxon, 1975; Solomon et al., 1987; Pommereau and Goutail, 1988; Bhonde et al., 1992; Platt, 1994; Londhe et al., 1999; Jadhav, 2002; Meena et al., 2003; Bhosale et al., 2004) to determine vertical column amounts of atmospheric trace gases such as O3 and NO2. The DOAS analysis algorithm uses the log ratio of a twilight spectrum to midday one, i.e. in determination of the slant column amount; Lambert–Beer's law is used. In the log ratio spectrum of wavelength range 462–498 nm; NO2, O3, H2O and O4 have their absorption signatures. SCD of these gases are derived simultaneously by matrix inversion method. To retrieve vertical column density (VCD), it is necessary to divide the SCD by a factor. For large solar zenith angle (SZA) sunlight passes nearly tangentially through the atmosphere before being scattered down to ground and the absorption path enhances by a factor called air mass factor (AMF).
AMF for different SZA are calculated using single scattering radiative transfer (RT) model (Solomon et al., 1987; Meena et al., 2003). In order to retrieve VCD, there are two approaches. The first approach is to retrieve ozone vertical columns that plots the observed differential slant column densities (SCDdiff) against the corresponding AMF (called a Langley plot). Then the slope of the line is equal to the VCD, as shown in equation (1). The Y–intercept should be equal to the negative of the column density of an absorber in the reference spectrum (RCD):
Equation (1) can be rearranged to solve for VCD at particular SZA, θ:

In equation (1) and (2), AMF(θ) is the air mass factor at SZA θ.
The second approach is based on the assumption that the vertical column in the background measurement is the same as in the actual measurement, and the differences in vertical columns are only due to changes in light path. With this assumption, equation (1) can be written as:
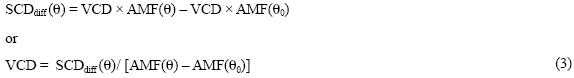
appropriate for NO2 because NO2 concentrations change during twilight. Thus for NO2, equation (3) can be applied at 90º SZA.
3. Observations
Zenith–sky spectra (462–498 nm) are recorded daily by UV–visible spectrometer. Full day observations, from morning (SZA = 90º) to evening (SZA = 90º) on 18, 19, 21, 22 and 23 October, 2000, have been carried out to see the diurnal variation of trace gases such as NO2, O3, H2O and 04. Daily morning/evening observations have been made to see the seasonal variations of NO2 and O3 at Pune (18°32' N, 73°51' E) during the period 2000–2003. To retrieve the RCD, plots of SCDdiff against a set of the corresponding AMF (Langley plot) are needed. Hence, the set of AMF (SZA) for respective SZA is acquired by RT model. For the sake of comparison, data of O3 VCD from Dobson instrument of Pune station are collected from the web site http://www.msc–smc.ec.gc.ca/woudc/index_e.html of World Ozone Data Centre (WODC), and TOMS data for the same station are collected from http://jwocky.gsfc.nasa.gov/eptoms/ep.html. Daily maximum/ minimum temperature is collected from Indian Daily Weather Report (IDWR) reported by Indian Meteorological Department to understand the variation in NO2 PM/AM ratio.
4. Results and discussion
4.1 Diurnal variation
As an example, full day observations on 18, 19, 21, 22 and 23 October 2000 have been made for the study of diurnal variations of NO2, O3, H2O and O4. Figures 1a and b shows the SCDdiff of NO2 and O3, respectively, with SZA for the above mentioned days. Similarly, H2O and O4 SCDdiff are shown in Figure 1c and d. Here, SCDdiff is the difference of the SCD in observed spectrum of particular SZA and reference spectrum of 30° SZA. Therefore, SCDdiff at 30º SZA will be zero for all the gases. In both the figures, SCDdiff of above gases are smoothly increasing with increasing SZA due to increasing atmospheric light paths approaching higher SZA.
]]>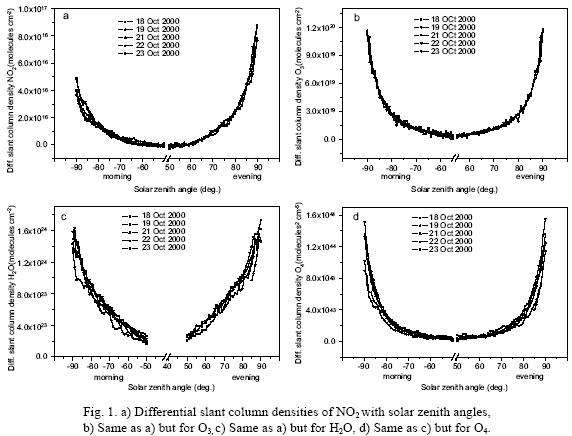
From Figure 1a, it is seen that evening NO2 SCDdiff are higher than morning SCDdiff at same SZA. At 70º SZA, percentage difference between evening and morning NO2 SCDdiffvaries from 50 to 57%; similarly, at 80º SZA percentage difference varies from 59 to 66% between evening and morning NO2 SCDdiff. From Figure 1b, it is seen that O3 SCDdiff at morning and evening hours are almost similar. O3 SCDdiff are increasing with SZA due to increasing absorption path at higher SZA. From Figure 1c and d, it has been seen that H2O and O4 SCDdiff variations are more between the selected days compared to NO2 and O3. Water vapour has large variability in the troposphere and stratosphere. The major absorption is in the lower layer of the atmosphere. Hence, the zenith dependence of wather vapour variability is different compared to other three gases. The atmospheric content of this compound responds to changes in temperature, microphysical processes and the atmospheric circulation. Water vapour concentration varies substantially in both the vertical and horizontal. Clouds are intimately connected to its pattern, as clouds occur in connection with high relative humidity, and cloud processes in turn affect the moisture distribution. Table I shows SCDdiff of NO2, O3, H2O and O4 at morning (AM) and evening (PM) 90º SZA for selected days. From Table I, it is seen that the evening NO2 values are almost double of morning NO2 values at 90º SZA. The percentage difference between evening and morning NO2 SCDdiff values varies from 78 to 107% at 90º SZA during those days. These higher values of NO2 in the evening particularly at SZA greater than 85º compared to morning NO2 may have occurred due to increased rate of NO–NO2 conversion and decreases in the rate of photolysis of NO2 during evening twilight period. From Table I, it has been seen that evening densities of O3 are 1 –5 % higher than morning densities at 90º SZA during those days. H2O SCDdiff at evening 90º SZA are found to be 2–11% higher than morning SCDdiff of same SZA. Similarly, O4 SCDdiff are 0–26% higher than morning SCDdiff at evening 90º SZA. On October 19, O4 SCDdiff at evening is 26% higher than morning. It is also seen that on this day H2O SCDdiff at evening 90º SZA is 11% higher than morning compared to other days. These higher values of O4 and H2O on October 19, at evening 90º SZA may be due to cloud layer occurred at evening hours. Meena et al. (2004) have been noticed that more effects of clouds are seen in increased absorption of tropospheric species like H2O and O4, which are good indicative of the increased absorption path lengths due to multiple Mie–scattering inside clouds.

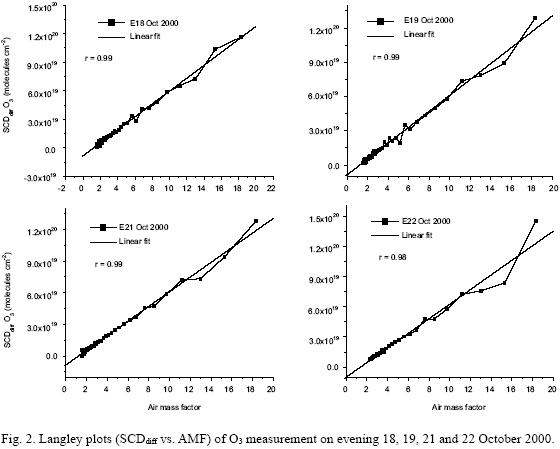
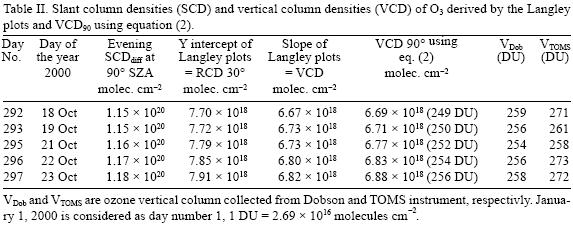
Figure 2 shows the plots of SCDdiff vs AMF (Langley plot) of O3 at evening on October 18, 19, 21 and 22. The correlation coefficients (r) between SCDdiff and AMF are 0.99 for 18, 19 and 21 October and 0.98 for 22 October. The correlation coefficients are significant at 1% level. In Figure 2, straight lines are showing the linear fit to the data. From the Langley plots, it is seen that data follow the straight line. According to equation (1), Y intercept gives the slant column amount in reference spectrum and slope of Langley plots gives the VCD, which are listed in Table II. This table, it is seen that the VCD derived by the slope of Langley plots and VCD90 using equation (2) have not much difference. They appear to be in good agreement. VCD derived from our spectrometer at evening 90° SZA are observed to be less by 2 to 10 DU compared to Dobson instrument values (VDob) and 6 to 22 DU less from TOMS observed values. The percentage difference in VCD derived by Dobson and our spectrometer varies from 0.8 to 4%. Similarly, the percentage difference between VCD obtained from our spectrometer and TOMS varies from 1 to 8% on these days. There are a number of factors contributing to the total error in the VCD. The basic uncertainty of O3 and NO2 is given by the random error from the fit. The random error is 1% for O3 and 2% for NO2. Uncertainty in cross sections is 1.2% for O3 and 2.3% for NO2. Pseudo–random error causing structure in the "filling–in" of absorption features by Raman scattered light is 1% for O3 and 5% for NO2. Another factor is that associated with the calculated AMF due to approximations in the RT model, which is 2.7% for O3 and 5% for NO2. The root–sum–square error calculated from these various error sources is approximately 3% for O3 and 8% for NO2.
]]> 4.2 Seasonal variation
Figures 3a and b show the daily VCD of NO2 and O3, respectively, obtained in the morning and evening hours during the period May 4, 2000 to May 24, 2003. VCD were derived from SCD at 90° SZA using the AMF of 18.5 for NO2 and 18.3 for O3, which were calculated by RT model for 90° SZA. Also, daily ozone values obtained by Dobson spectrophotometer are plotted in Figure 3b for the above period. From Figure 3a, it is seen that maximum NO2 VCD are found in summer months (May and June) and minimum in winter months (December and January) for all the years.

Maximum NO2 VCD (average of May and June) and minimum NO2 VCD (average of December and January) of morning and evening hours are listed in Table IIIa. From this table, it is seen that at morning and evening hours, maxima of NO2 of VCD have an increasing trend during the period 2000–2003. The maximum NO2 VCD in the morning hours are increasing per year in the order of 0.4 x 10¹⁵ – 0.5 x 10¹⁵ molecules cm–2 (i.e., 7–8%) and in evening hours it is increasing 5–6% per year. The percentage difference between maximum NO2 VCD at morning and evening hours varies from 29 to 42%; similarly, percentage difference between minimum NO2 VCD at morning and evening hours varies from 150 to 172% during the period 2000–2003. Regarding the NO2 concentration, it was observed at Pune that two wheelers contribute 74 and cars 20% to the total pollution. The air quality of Pune's surroundings is deteriorating rapidly. Every day hundreds of tons of polluted air are released. Vehicular contribution of Pune's air pollution is approximately 40%. The average air pollution levels in the city are given as: PM10 83 ppm, NO2 62 ppm and SO2 37 ppm. The observation station is in upwind and hence the effect of Pune pollution depends upon wind direction. However, the tropospheric contribution will only affect the observations and stratospheric contributions are representative of large circulation patterns.
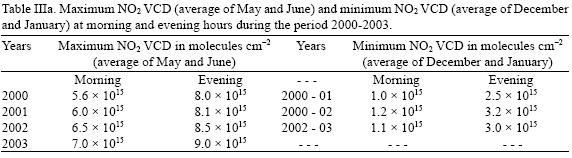
From Figure 3b, it is seen that maximum O3 VCD are observed in summer months (May and June) and minimum in winter months (December and January). From the figure it is also seen that morning and evening VCD are in good agreement with Dobson spectrophotometer values throughout the observational period. Maximum O3 VCD (average of May and June) and minimum O3 VCD (average of December and January) at morning and evening hours are listed in Table IIIb. From table, it is seen that evening O3 VCD are higher than morning O3 VCD. The percentage difference between maximum O3 VCD at morning and evening hours varies from 3 to 10% and the percentage difference between minimum O3 VCD at morning and evening hours varies from 2 to 18% during the period 2000–2003. Figure 3c shows correlation between NO2 and O3 for morning (AM) and evening (PM) data. For the whole period, a positive correlation of r = 0.72 in the morning data and r = 0.79 in the evening have been found between NO2 and O3 total column amounts.

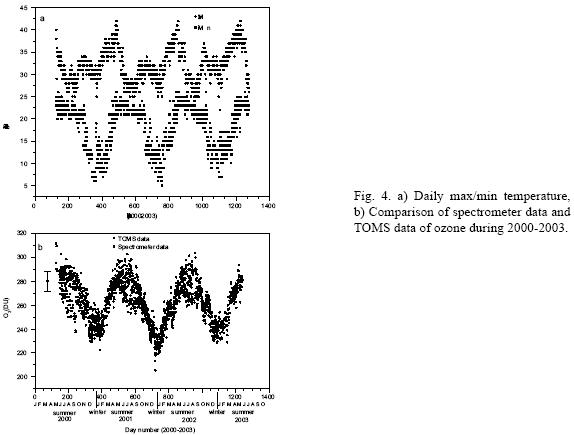
It has been discussed above that maximum NO2 and O3 VCD are observed in May and June during all the years, therefore it can be say that NO2 and O3 peaks are one month ahead from maximum temperature peaks. A good agreement is seen between O3 and minimum temperature variations. It is found from Figure 4b that TOMS values are higher than spectrometer values. The TOMS instrument measures UV radiances backscattered by the underlying atmosphere and earth's surface or clouds. The measured radiances are a function of total column ozone, the vertical distribution of that column, solar zenith angle, satellite zenith angle (azimuthal angle and scan angle), and the pressure level and reflectivity of the lower boundary. In clear sky conditions the contribution of backscattered radiation from the atmosphere dominates over the reflected radiation from earth's surface, the effective scattering surface for the backscattered UV radiation to the TOMS instrument is at the middle to upper troposphere (Hudson et al., 1995; Klenk et al., 1982).
For ozone above the middle to upper troposphere, the TOMS algorithm can retrieve the actual amount of ozone above the effective scattering surface with little error. However, if the assumed ozone profile below the effective scattering surface is different from the actual ozone profile, the retrieval will sense less than the actual deviation because some of the backscattered radiation will not have passed through the middle and lower troposphere. Then, the retrieved total ozone is either overestimated or underestimated depending on whether the assumed ozone amount below the effective scattering surface is less than or greater than the actual ozone amount. In the cloudy sky, incorrect cloud height lead to three errors like errors in the added ozone below clouds and errors in the retrieved ozone above clouds.
The knowledge of ozone and temperature profiles is critical for the calculation of ozone values at higher solar zenith angles. The effect of different profiles on the accuracy of ozone retrievals is an important part. Therefore, the reason of the observed discrepancies may be in the TOMS algorithm, which uses climatological profiles rather than the actual profile at the time of the measurement. High summer ozone concentrations are confined to increased duration of UV–radiation during summer months. Ozone produced in the tropical region gets transported to higher latitudes by the stratospheric mean diabatic circulation. Ozone rich–air during winter moves poleward and downward, which explains the seasonal variations in ozone. Also, day–to–day variability in total ozone is assumed to be caused by changing weather patterns in the troposphere and its effects may extent to the lower stratospheric levels. Ozone has a strong seasonal variation but weak diurnal variation at twilight, with maxima in the summer and minima in the winter. However, the abundance of lower stratospheric ozone is strongly dependent on transport, so that interannual variations in dynamic behavior can also be a source of ozone variability (Hood et al., 1997).
Figures 5a and b show the NO2 and O3 evening–to–morning (PM/AM) ratio, respectively, during 2000–2003. Also, Figure 5a shows temperature maximum/minimum (max/min) ratio. Figure 5c shows the correlation between NO2 PM/AM ratio and temperature max/min ratio during 2000–2003. From Figure 5a, it is found that at Pune the PM/AM ratio of NO2 density varies from 1.25 to 3.8 during the above period. There is an interesting seasonal change in the PM/AM ratio. NO2 PM/AM ratios are higher in winter months and lower in summer months for all the years. In winter months NO2 PM/AM ratio goes up to 3.8 and in summer months lowest ratio is 1.25. From Figure 5a, it is seen that max/min temperature ratios are higher in winter months and lower in summer months during 2000–2003. Decreasing trend is observed in the maxima of both NO2 PM/AM ratio and temperature max/min ratio in winter seasons during the above period. When the max/min temperature differences are more, NO2 PM/AM differences are also observed more. The NO2 PM/AM ratio has been plotted against the temperature max/min ratio with a correlation coefficient of 0.55, which is shown in Figure 5c. Deviation from linearity indicates other processes than pure photochemical and homogeneous chemistry. The NO2 concentration and its PM/AM ratio is considered to change with the atmospheric temperature in a day/night period.
Temperature of the atmosphere controls the rate of thermal decomposition of N2O5 concentrations. N2O5 forms during the dark hours and is destroyed by photolysis and thermal decomposition. N2O5 concentration is a function of temperature and wavelength. In the winter nights N2O5 forms more due to more dark hours and in day time it is photolyzed to produce NO2, which is reflecting in the evening (PM) hours. Hence, in winter PM/AM ratios are higher than in summer.
Koike et al. (1999) have analyzed the series of PM/AM ratio values of the VCD of NO2 and found a maximum ratio of 2.32 in winter and a minimum of 1.25 in summer. They obtained residual series of ratio values after eliminating seasonal trends and by considering PM value of the day and AM value of the next day for the two stations: Moshiri (44.4° N, 142.3° E) and Rikubetsu (43.5° N, 143.8° E). A positive correlation between these two stations before and after eliminating seasonal trend is suggestive of day–to–day variation of PM/AM ratios in the VCD of NO2 in association with the real change in the atmosphere. Otten et al. (1998) observed a PM/AM ratio of the VCD of NO2 of highest value 4.0 during the mid–winter of 1994/1995 at Kiruna (67.9° N, 21.1° E). The analysis at Pune also shows large day–to–day variability in the VCD of NO2 with maximum PM/AM ratio of about 3.8 in winter compared to small day–to–day variations in spring and summer with PM/AM ratio of about 1.25. However, tropospheric NO2 pollution probably by local traffic during the day could also enhance the PM/AM ratio in total atmospheric NO2, in particular during winter when the stratospheric NO2 is low, and the near surface inversion prevents an efficient dispersion of polluted air (Fiedler et al., 1993). During the night NO2 can be oxidized by O3 to form NO3, a strong atmospheric oxidant and a precursor to the formation of N2O5. During the day N2O5 can be photolyzed to regenerate NO2 (Nichol et al., 1996). In contrast, N2O5 can have morning concentrations in the lower stratosphere comparable to NOx, even though its production requires the formation of NO3.
NO2 + O3  NO3 + O2
NO + O2 NO2 + O
NO3 + NO2 + M  N2 O5 + M
In the winter, nights are longest; therefore, during night NO2 to N2O5 conversion is more and hence in the morning NO2 value will be less, what leads to high PM/AM ratio. During daytime, photochemical reactions take place in the presence of sunlight and N2O5 that, formed due to oxidation of NO2 during night, gets photolyzed to reproduce NO2 (Kostadinov et al., 1999). The formation of NO2 during the day leads to an increase in the VCD of NO2:
N2O5 + hv NO3 + NO2
The increase in NO2 VCD is also possible due to increased pollution during day, which reflects in the evening hours as it is seen from figures. At twilight, NO2 density depends on NO and controlled by the following reactions:
NO + O3 NO2 + O2
NO2 + hv NO + O
NO2 + O NO + O2
During evening twilight hours, the rapid decreases in the rate of photolysis of NO2 and the abundances of atomic oxygen lead to conversion of NO into NO2. Thus, the total number of NO2 molecules can increase substantially at evening hours and hence the AM/PM differences (Solomon et al., 1987; Kerr et al., 1977; Boughner et al., 1980). These AM/PM differences in VCD of NO2 can also be seen in Figure 3a. The VCD data at Pune show strong seasonal and diurnal variations of NO2, with maxima in summer at sunset and minima in winter at sunrise. This agrees with the results of earlier authors (Noxon et al., 1979; Syed et al., 1981; Johnston et al., 1989; Solomon et al., 1992; Bhonde et al., 1992; Lal et al., 1993; Kondo et al., 1994). From Figure 5b, O3 PM/AM ratio is slightly higher in winter months compared to summer months. The average PM/AM ratio of about 1.03 is observed. Various nitrogen oxides like NO, NO2 and NO3 are involved in reactions, which affect O3 abundance, N2O5 acts as a temporary reservoir for these nitrogen oxides species. Therefore, the concentration of N2O5 in the atmosphere contributes to the AM/PM O3 abundance. However, there is not much difference seen in O3 values. Hence, no much variation is seen in PM/AM ratio.
]]>5. Conclusions
• Full day observations have been made from morning (SZA 90°) to evening (SZA 90°) to see the diurnal variations of trace gases such as O3, NO2, H2O and O4. SCDdiff of above gases increase smoothly as the AMF increases with SZA. It is seen that evening NO2 SCDdiff are higher compared to morning SCDdiff. It is also noticed that evening NO2 values are almost double of morning NO2 values in the month of October 2000. These high values of NO2 in the evening appear to be related to NO–NO2 conversion that occurs in twilight period. In O3, H2O and O4, no much differences are observed in morning and evening SCDdiff.
• A time series of daily VCD of NO2 and O3 at sunrise and sunset has been obtained during the period from May 2000 to May 2003. There have been found a good correlation between NO2 and O3 VCD during the period. The VCD data at Pune show strong seasonal and diurnal variations of NO2 with maxima in summer at sunset and minima in winter at sunrise. Ozone has strong seasonal variations but weak diurnal variations at sunrise and sunset hours with maxima in summer and minima in winter. A good agreement is found between O3 VCD and minimum temperature variations during the above period. High summer ozone values are confined to increased duration of UV–radiation during summer months.
• The percentage difference between VCD obtained from Dobson and our spectrometer varies from 0.8 to 4%. Similarly, in VCD obtained from our spectrometer and TOMS, the percentage difference varies from 1 to 8% during the above period.
• The NO2 PM/AM ratios are found to be higher in winter months and lower in summer months. It has also been found that temperature max/min ratios are higher in winter and lower in summer months during 2000–2003. When the max/min temperature differences are more, NO2 PM/AM differences are also observed more. In winter months NO2 PM/AM ratio goes up to 3.8 and in summer months lowest ratio is 1.25. A positive correlation is found between NO2 PM/AM ratio and temperature max/min ratio during the period 2000–2003.
• Temperature of the atmosphere controls the rate of the thermal decomposition of N2O5 concentrations. N2O5 forms during dark hours. In the winter, nights are longest; therefore, during night NO2 to N2O5 conversion is more and hence in the morning NO2 value will be less that leads to high PM/AM ratio. Further, during evening twilight hours, the rapid decreases in the rate of photolysis of NO2 and the abundances of atomic oxygen lead to conversion of NO into NO2. Thus, the total number of NO2 molecules can increase substantially at evening hours, and hence the AM/PM differences. O3 PM/AM ratio is found slightly higher in winter months compared to summer months.
Acknowledgements
The authors are thankful to Prof. B. N. Goswami Director IITM and Dr. P. C. S. Devara Head PM & A Division for his encouragement. The authors are thankful to the Department of Science and Technology (DST), New Delhi, Govt. of India for the financial support during the tenure of this work.
]]>References
Bhonde S. D., P. Mehra, S. Bose, A. L. Londhe and D. B. Jadhav, 1992. Simultaneous measurement of low latitude NO2 and O3 from zenith sky observations in visible region. Indian J. Radio Space Phys. 21, 18–25. [ Links ]
Bhosale C. S., G. S. Meena, A. L. Londhe, D. B. Jadhav, O. Puentedara and M. Gil, 2004. Variations of O3, NO2 and O4 densities in association with NAO indices during winter/spring of 1993/94 and 1994/95 at sub–Arctic station. Indian J. Radio Space Phys. 33, 104–114. [ Links ]
Boughner R., J. C. Larsen and M. Natarajan, 1980. The influence of NO and ClO variations at twilight on the interpretation of solar occultation measurements. Geophys. Res. Lett. 7, 231–234. [ Links ]
Bradshaw J., D. Davis, G. Grodzinsky, S. Smyth, R. Newell, S. Sandholm and S. Liu, 2000. Observed distributions of nitrogen oxides in the remote free troposphere from the NASA global tropospheric experiment programs. Rev. Geophys. 38, 61–116. [ Links ]
Erle F., K. Pfeilsticker and U. Platt, 1995. On the influence of tropospheric clouds on zenith–scattered–light measurements of stratospheric species. Geophys. Res. Lett. 22, 2725–2728. [ Links ]
Fiedler M., H. Frank, T. Gomer, M. Hausmann, K. Pfeilsticker and U. Platt, 1993. The 'minihole' event on 6 Feb. 1990: Influence of Mie–scattering on the evaluation of spectroscopic measurements. Geophys. Res. Lett. 20, 959–962. [ Links ]
Gil M., O. Puentedara, M. Yela, C. Parrondo and D. B. Jadhav, 1996. OClO, NO2 and O3 total column observations over Iceland during the winter 1993/94. Geophys. Res. Lett. 23, 3337–3340. [ Links ]
Hood L. L., J. P. McCormack and K. Labitzke, 1997. An investigation of dynamical contributions to midlatitude ozone trends in winter. J. Geophys. Res. 102, 13079–13093. [ Links ]
Hudson R. D., J.–H. Kim and A. M. Thompson, 1995. On the derivation of tropospheric column from radiances measured by the total ozone mapping spectrometer. J. Geophys. Res. 100, 11137–11145. [ Links ]
Jadhav D. B., A. L. Londhe, G. S. Meena, D. Jhurry and J. M. Rossett, 1999. Installation of an automatic spectrometer at Mauritius and preliminary result of NO2 over Mauritius. Curr. Sci. 76, 998–1000. [ Links ]
Jadhav D. B., 2002. Monitoring of atmospheric constituents using UV–visible spectroscopy, Proceedings of National Workshop on Atmospheric Chemistry (NWAC–99), (Devara, P.C.S. and Raj, P.E. Eds.), Indian Institute of Tropical Meteorology, Pune, 145–149 pp. [ Links ]
Jayaraman A. and B. H. Subbaraya, 1988. Vertical distribution of water vapour over Hydarabad. Indian J. Radio Space Phys. 17, 63–68. [ Links ]
Johnston P. V. and R. L. McKenzie, 1989. NO2 observations at 45° S during the decreasing phase of solar cycle 21, from 1980 to 1987. J. Geophys. Res. 94, 3473–3486. [ Links ]
Kerr J. B., W. F. J. Evans and J. C. McConnell, 1977. The effect of NO2 changes at twilight on tangent ray NO2 measurements. Geophys. Res. Lett. 4, 577–579. [ Links ]
Klenk K. F., P. K. Bhartia, A. J. Fleig, V. G. Kaveeshwar, R. D. McPeters and P. M. Smith, 1982. Total ozone determination from the backscattered ultraviolet (BUV) experiment. J. Appl. Meteor. 21, 1672–1684. [ Links ]
Koike M., Y. Kondo, W.A. Matthews, P. V. Johnston, H. Nakajima, A. Kawaguchi, H. Nakane, I. Murata, A. Budiyono, M. Kanada and N. Toriyama, 1999. Assessment of the uncertainties in the NO2 and O3 measurements by visible spectrometers. J. Atmos. Chem. 32, 121–145. [ Links ]
Kondo Y., W. A. Matthews, S. Solomon, M. Koike, M. Hayashi, K. Yamazaki, H. Nakajima and K. Tsukuui, 1994. Ground based measurements of column amounts of NO2 over Syowa Station, Antarctica. J. Geophys. Res. 99, 14535–14548. [ Links ]
Kostadinov I., G. Giovanelli, F. Ravegnani, D. Bortoli and A. Petritili, 1999. Depolarization ratio of the zenith scattered radiation and measured NO2 slant columns. Proc. Society of Photo–Optical Instrumentation Engineers (SPIE), 3754, 402–410. [ Links ]
Kreher K., M. Fiedler, T. Gomer, J. Stutz and U. Platt, 1995. The latitudinal distribution (50° N – 50° S) of NO2 and O3 in October/November 1990. Geophys. Res. Lett. 22, 1217–1220. [ Links ]
Lal M., D. K. Chakrabarty, J. S. Sidhu, S. R. Das and S. D. Verma, 1993. Some results of ground–based measurements of atmospheric NO2 at Ahmedabad by visible absorption spectroscopy. Indian J. Radio Space Phys. 22, 108–113. [ Links ]
Londhe A. L., C. S. Bhosale, G. S. Meena, D. B. Jadhav, M. Gil, O. Puentedara and M. Yela 1999. Vertical profile variations of NO2 and O3 using slant column density observations during twilight period. Indian J. Radio & Space Phys. 28, 291–301. [ Links ]
McKenzie R. L. and P. V. Johnston, 1982. Seasonal variations in stratospheric NO2 of 45° SW. Geophys. Res. Lett. 9, 1255–1258. [ Links ]
Meena G. S., D. B. Jadhav and C. S. Bhosale, 2003. Total column density variations of NO2 and O3 by automatic visible spectrometry over Pune, India. Curr. Sci. 85, 171–179. [ Links ]
Meena G. S., C. S. Bhosale and D. B. Jadhav, 2004. Influence of tropospheric clouds on ground–based measurements of stratospheric trace gases at tropical station, Pune. Atmos. Environ. 38, 3459–3468. [ Links ]
Nichol S. E., J. G. Keys, S. W. Wood, P. V. Johnston and G. E. Bodeker, 1996. Intercomparison of total ozone data from a Dobson spectrophotometer, TOMS, visible wavelength spectrometer, and ozonesondes. Geophys. Rev. Lett. 23, 1087–1090. [ Links ]
Noxon J. F., 1975. Nitrogen dioxide in the stratosphere and troposphere measured by ground–based absorption spectroscopy. Science 189, 547–549. [ Links ]
Noxon J. F., E. C. Whipple and R. S. Hyde, 1979. Stratospheric NO2. 1. Observational method and behavior at midlatitudes. J. Geophys. Res. 84, 5047–5065. [ Links ]
Otten C., F. Ferlemann, U. Platt, T. Wagner and K. Pfeilsticker, 1998. Groundbased DOAS UV/ visible measurements at Kiruna (Sweden) during SESAME winters 1993/94 and 1994/95. J. Atmos. Chem. 30, 141–162. [ Links ]
Pfeilsticker K., F. Erle and U. Platt, 1997. Absorption of solar radiation by atmospheric O4. J. Atm. Sci. 54, 933–939. [ Links ]
Platt U., 1994. Differential optical absorption spectroscopy (DOAS). In: Air monitoring by spectroscopic techniques (M. W. Sigrist, Ed.), John Wiley, New York, Chem. Anal. Ser., 27–84. [ Links ]
Pommereau J. P. and F. Goutail, 1988. O3 and NO2 ground–based measurements by visible spectrometry during arctic winter and spring 1988. Geophys. Res. Lett. 15, 891–894. [ Links ]
Senne T., J. Stutz and U. Platt, 1996. Measurements of the latitudinal distribution of NO2 column density and layer height in Oct./Nov. 1993. Geophys. Res. Lett. 23, 805–808. [ Links ]
Solomon S., A. L. Shmeltekopf and R. W. Sanders, 1987. On the interpretation of zenith sky absorption measurement. J. Geophys. Res. 92, 8311–8319. [ Links ]
Solomon S. and J. G. Keys, 1992. Seasonal variation in Antarctic NOx chemistry. J. Geophys. Res. 97, 7971–7978. [ Links ]
Solomon S., R. W. Portmann, R. W. Sanders and J. S. Daniel, 1998. Absorption of solar radiation by water vapor, oxygen and related collision pairs in the Earth's atmosphere. J. Geophys. Res. 103, 3847–3858. [ Links ]
Syed M. Q. and A. W. Harrison, 1981. Seasonal trend of stratospheric NO2 over Calgary, Can. J. Phys. 59, 1278–1279. [ Links ]
Wayne R. P., (Ed), 1991. The nitrate radical: physics, chemistry, and the atmosphere, Atmos. Environ. 25, 1–203. [ Links ]
WMO 1990a. Report of the International Ozone Trends Panel: 1988, Report No. 18, two volumes, WMO, Geneva. [ Links ] ]]>