<?xml version="1.0" encoding="ISO-8859-1"?><article xmlns:mml="http://www.w3.org/1998/Math/MathML" xmlns:xlink="http://www.w3.org/1999/xlink" xmlns:xsi="http://www.w3.org/2001/XMLSchema-instance">
<front>
<journal-meta>
<journal-id>0036-3634</journal-id>
<journal-title><![CDATA[Salud Pública de México]]></journal-title>
<abbrev-journal-title><![CDATA[Salud pública Méx]]></abbrev-journal-title>
<issn>0036-3634</issn>
<publisher>
<publisher-name><![CDATA[Instituto Nacional de Salud Pública]]></publisher-name>
</publisher>
</journal-meta>
<article-meta>
<article-id>S0036-36342012000200012</article-id>
<title-group>
<article-title xml:lang="en"><![CDATA[Use and understanding of the nutrition information panel of pre-packaged foods in a sample of Mexican consumers]]></article-title>
<article-title xml:lang="es"><![CDATA[Uso y comprensión del etiquetado nutrimental posterior de los alimentos pre-empaquetados en una muestra de consumidores mexicanos]]></article-title>
</title-group>
<contrib-group>
<contrib contrib-type="author">
<name>
<surname><![CDATA[De la Cruz-Góngora]]></surname>
<given-names><![CDATA[Vanessa]]></given-names>
</name>
<xref ref-type="aff" rid="A01"/>
</contrib>
<contrib contrib-type="author">
<name>
<surname><![CDATA[Villalpando]]></surname>
<given-names><![CDATA[Salvador]]></given-names>
</name>
<xref ref-type="aff" rid="A01"/>
</contrib>
<contrib contrib-type="author">
<name>
<surname><![CDATA[Rodríguez-Oliveros]]></surname>
<given-names><![CDATA[Guadalupe]]></given-names>
</name>
<xref ref-type="aff" rid="A01"/>
</contrib>
<contrib contrib-type="author">
<name>
<surname><![CDATA[Castillo-García]]></surname>
<given-names><![CDATA[Marcia]]></given-names>
</name>
<xref ref-type="aff" rid="A01"/>
</contrib>
<contrib contrib-type="author">
<name>
<surname><![CDATA[Mundo-Rosas]]></surname>
<given-names><![CDATA[Verónica]]></given-names>
</name>
<xref ref-type="aff" rid="A01"/>
</contrib>
<contrib contrib-type="author">
<name>
<surname><![CDATA[Meneses-Navarro]]></surname>
<given-names><![CDATA[Sergio]]></given-names>
</name>
<xref ref-type="aff" rid="A01"/>
</contrib>
</contrib-group>
<aff id="A01">
<institution><![CDATA[,Instituto Nacional de Salud Pública  ]]></institution>
<addr-line><![CDATA[Cuernavaca Morelos]]></addr-line>
<country>México</country>
</aff>
<pub-date pub-type="pub">
<day>00</day>
<month>04</month>
<year>2012</year>
</pub-date>
<pub-date pub-type="epub">
<day>00</day>
<month>04</month>
<year>2012</year>
</pub-date>
<volume>54</volume>
<numero>2</numero>
<fpage>158</fpage>
<lpage>166</lpage>
<copyright-statement/>
<copyright-year/>
<self-uri xlink:href="http://www.scielo.org.mx/scielo.php?script=sci_arttext&amp;pid=S0036-36342012000200012&amp;lng=en&amp;nrm=iso"></self-uri><self-uri xlink:href="http://www.scielo.org.mx/scielo.php?script=sci_abstract&amp;pid=S0036-36342012000200012&amp;lng=en&amp;nrm=iso"></self-uri><self-uri xlink:href="http://www.scielo.org.mx/scielo.php?script=sci_pdf&amp;pid=S0036-36342012000200012&amp;lng=en&amp;nrm=iso"></self-uri><abstract abstract-type="short" xml:lang="en"><p><![CDATA[OBJECTIVE: To assess the use and understanding of the Nutritional information Panel (NIP) of pre-packaged foods by Mexican consumers. MATERIALS AND METHODS: A questionnaire and an understanding test for NIP were applied to adult consumers in supermarkets of six cities in the Northern, Central, and Southern regions of Mexico. Data were analyzed by frequencies and Poisson regression models. RESULTS: Interviewed 731 consumers; 71.5% were women, mean age 33 ± 9.7 (range: 18-60), 70% completed high-school or a higher degree. In total, 17% of consumers use the NIP for making purchase decisions; 49% did not understand the NIP. Only 1.2% of consumers answered correctly the five questions of the NIP understanding test. CONCLUSIONS: The use and understanding of the NIP are low despite a high proportion self-reported reading and understanding. The lack of previous knowledge of the technical language prevents use and interpretation of NIP nutritional information for purchasing decisions.]]></p></abstract>
<abstract abstract-type="short" xml:lang="es"><p><![CDATA[OBJETIVO: Evaluar el uso y comprensión del etiquetado nutricional posterior (NIP, por sus siglas en inglés) de alimentos preempacados por consumidores mexicanos. MATERIAL Y MÉTODOS: Se aplicaron un cuestionario y una prueba de comprensión del NIP a consumidores adultos en supermercados de seis ciudades de las regiones Norte, Centro y Sur de México. RESULTADOS: Se entrevistaron 731 consumidores; 71.5% eran mujeres, la media de edad 33 ± 9.7 años (intervalo 18-60); 70% terminaron preparatoria o un nivel más alto. El 17% usa la etiqueta nutrimental para elegir sus alimentos; 49% no comprendía la NIP. Sólo 1.2% de los consumidores respondió correctamente las cinco preguntas de la prueba de comprensión del NIP. CONCLUSIONES: El uso y comprensión del NIP fue bajo, a pesar de la gran proporción que autorreportó leerlo y comprenderlo. La falta de conocimiento previo del lenguaje técnico dificulta el uso e interpretación de la información nutricional de NIP para las decisiones de compras de alimentos.]]></p></abstract>
<kwd-group>
<kwd lng="en"><![CDATA[consumers]]></kwd>
<kwd lng="en"><![CDATA[food labeling]]></kwd>
<kwd lng="en"><![CDATA[Mexico]]></kwd>
<kwd lng="es"><![CDATA[consumidores]]></kwd>
<kwd lng="es"><![CDATA[etiquetado de alimentos]]></kwd>
<kwd lng="es"><![CDATA[México]]></kwd>
</kwd-group>
</article-meta>
</front><body><![CDATA[ <p align="right"><font size="2"><b><font face="Verdana, Arial, Helvetica, sans-serif">ORIGINAL ARTICLES</font></b></font></p>     <p>&nbsp;</p>     <p><font size="4" face="Verdana, Arial, Helvetica, sans-serif"><b><a name="top" id="top"></a>Use and understanding of the nutrition information panel of pre-packaged foods in a sample of Mexican consumers</b></font></p>     <p>&nbsp;</p>     <p><b><font size="3" face="Verdana, Arial, Helvetica, sans-serif">Uso y comprensi&oacute;n del etiquetado nutrimental posterior    de los alimentos pre-empaquetados en una muestra    de consumidores mexicanos</font></b></p>     <p>&nbsp;</p>     <p>&nbsp;</p>     <p><b><font size="2" face="Verdana, Arial, Helvetica, sans-serif">Vanessa De la Cruz-G&oacute;ngora, MSc; Salvador Villalpando, MD, PhD; Guadalupe Rodr&iacute;guez-Oliveros, MBA, PhD; Marcia Castillo-Garc&iacute;a, MPH; Ver&oacute;nica Mundo-Rosas, MSc; Sergio Meneses-Navarro, MD, MA.</font></b><font size="2" face="Verdana, Arial, Helvetica, sans-serif"></font></p>     <p><font size="2" face="Verdana, Arial, Helvetica, sans-serif">Instituto Nacional de Salud P&uacute;blica. Cuernavaca, Morelos M&eacute;xico</font></p>     <p><font size="2" face="Verdana, Arial, Helvetica, sans-serif"><a href="#end">Corresponding author</a></font></p>     ]]></body>
<body><![CDATA[<p>&nbsp;</p>     <p>&nbsp;</p> <hr size="1" noshade="noshade" />     <p><font size="2" face="Verdana, Arial, Helvetica, sans-serif"><b>ABSTRACT</b></font></p>     <p><font size="2" face="Verdana, Arial, Helvetica, sans-serif"><b>OBJECTIVE: </b> To assess the use and understanding of the Nutritional information Panel (NIP) of pre-packaged foods by Mexican consumers. <br />       <b>MATERIALS AND METHODS: </b>A questionnaire and an understanding test for NIP were applied to adult consumers in supermarkets of six cities in the Northern, Central, and Southern regions of Mexico. Data were analyzed by frequencies and Poisson regression models. <b><br />         RESULTS: </b> Interviewed 731 consumers; 71.5% were women, mean age 33 &plusmn; 9.7 (range: 18-60), 70% completed high-school or a higher degree. In total, 17% of consumers use the NIP for making purchase decisions; 49% did not understand the NIP. Only 1.2% of consumers answered correctly the five questions of the NIP understanding test. <br />   <b>CONCLUSIONS: </b> The use and understanding of the NIP are low despite a high proportion self-reported reading and understanding. The lack of previous knowledge of the technical language prevents use and interpretation of NIP nutritional information for purchasing decisions.</font></p>     <p><font size="2" face="Verdana, Arial, Helvetica, sans-serif"><b>Key words: </b>consumers; food labeling; Mexico</font></p> <hr size="1" noshade="noshade" />     <p><font size="2" face="Verdana, Arial, Helvetica, sans-serif"><b>RESUMEN</b></font></p>     <p><font size="2" face="Verdana, Arial, Helvetica, sans-serif"><b>OBJETIVO: </b> Evaluar el uso y comprensi&oacute;n del etiquetado nutricional posterior (NIP, por sus siglas en ingl&eacute;s) de alimentos preempacados por consumidores mexicanos.<br />       <b>MATERIAL Y M&Eacute;TODOS: </b> Se aplicaron un cuestionario y una prueba de comprensi&oacute;n del NIP a consumidores adultos en supermercados de seis ciudades de las regiones Norte, Centro y Sur de M&eacute;xico. <b><br />         RESULTADOS: </b>Se entrevistaron 731 consumidores; 71.5% eran mujeres, la media de edad 33 &plusmn; 9.7 a&ntilde;os (intervalo 18-60); 70% terminaron preparatoria o un nivel m&aacute;s alto. El 17% usa la etiqueta nutrimental para elegir sus alimentos; 49% no comprend&iacute;a la NIP. S&oacute;lo 1.2% de los consumidores respondi&oacute; correctamente las cinco preguntas de la prueba de comprensi&oacute;n del NIP.<br />   <b>CONCLUSIONES: </b> El uso y comprensi&oacute;n del NIP fue bajo, a pesar de la gran proporci&oacute;n que autorreport&oacute; leerlo y comprenderlo. La falta de conocimiento previo del lenguaje t&eacute;cnico dificulta el uso e interpretaci&oacute;n de la informaci&oacute;n nutricional de NIP para las decisiones de compras de alimentos. </font></p>     <p><font size="2" face="Verdana, Arial, Helvetica, sans-serif"><b>Palabras clave:</b> consumidores; etiquetado de alimentos; M&eacute;xico</font></p> <hr size="1" noshade="noshade" />     <p>&nbsp;</p>     <p>&nbsp;</p>     ]]></body>
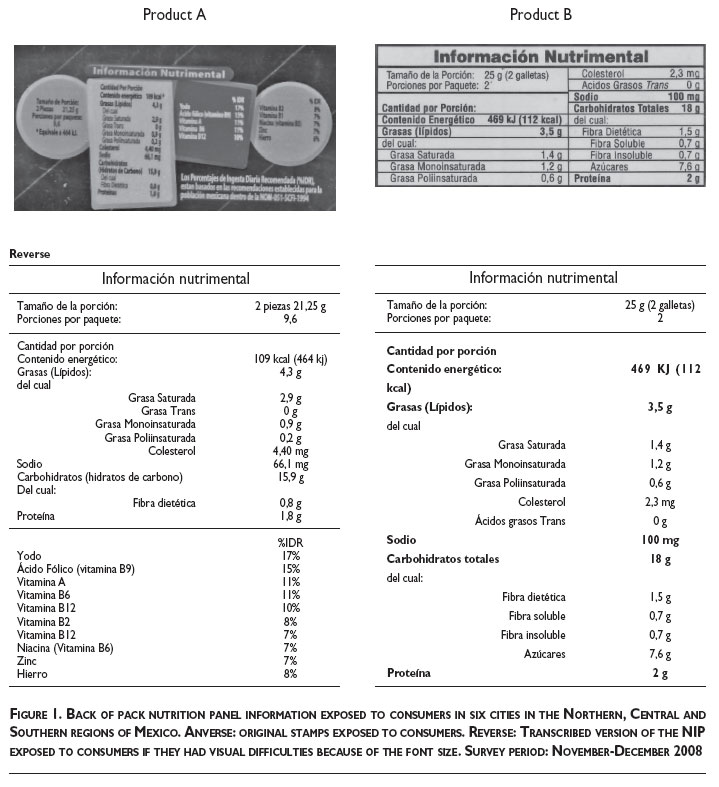
<body><![CDATA[<p><font size="2" face="Verdana, Arial, Helvetica, sans-serif">The nutritional information panel (NIP) on the back of pre-packaged foods is an instrument to inform consumers about their nutritional content and values.<sup>1</sup> In some countries, the NIP has been used as an effective tool to inform and educate consumers about food advantages and health related risks, with the purpose of promoting healthy food choices,<sup>1,2</sup> and modifying dietary habits.<sup>3,4</sup> Several studies have documented that the NIP use by adult consumers reduces the dietary intake of total fat and cholesterol,<sup>5</sup> and increases the intake of fiber, iron, protein,<sup>6</sup> vitamin C,<sup>7</sup> fruit and vegetables.<sup>8</sup> Such dietary changes have been attributed mainly to changes in the purchasing behavior associated to the consumer perceptions about the correct use of the NIP.<sup>9 </sup></font></p>     <p><font size="2" face="Verdana, Arial, Helvetica, sans-serif"> Sociodemographic characteristics associated with the use of the NIP are gender<sup>10</sup> (women more prone to use the NIP),<sup>5</sup> age,<sup>3</sup> higher education level, socioeconomic status (SES),<sup>11 </sup>previously diagnosed chronic health conditions,<sup>12,13</sup> and personal concerns about nutrition and health.<sup>14</sup> However, a relevant proportion of consumers faces difficulties in understanding such information.<sup>10,15,16</sup> Reading the NIP does not imply understanding its content and consequently making an informed purchase decision. Consumers that read the NIP generally focus on specific information based on their personal needs and interests.<sup>10,14,17</sup> Studies in USA, New Zealand, and France<sup>16,18,19</sup> have found that the self-reported use of NIP for purchasing decisions is moderate to high.<sup>20</sup> In Mexico, there is no documented evidence on the use and understanding of the NIP by consumers and about the factors associated with the use and understanding of the NIP. </font></p>     <p><font size="2" face="Verdana, Arial, Helvetica, sans-serif"> This study aims to describe the use and understanding of the NIP in a sample of Mexican consumers with high SES and educational level and to identify the factors associated with its use and understanding. The design to explore such an association, was based on the theoretical framework (TF) proposed by Grunert <i>et al</i>.<sup>15</sup> Such TF implies that "only labels to which consumers are exposed can be expected to have any effects". For this to happen, consumers go through an internal information processing which comprises search, exposure, perception, liking and "understanding" of the label information (LI). LI may alter the overall pattern of food purchases; so the expected effect in this context, is the use of LI in making food purchasing decisions.<sup>15</sup></font></p>     <p><font size="2" face="Verdana, Arial, Helvetica, sans-serif"> The evidence generated by this study represents the optimal understanding capacity for the information provided in the NIP, assuming that population with lower educational experience will have a similar or lower understanding capacity. This objective information will help decision makers and academics to design public strategies to promote the use of NIP as an instrument for consumers to make informed food choices. </font></p>     <p>&nbsp;</p>     <p><font size="3" face="Verdana, Arial, Helvetica, sans-serif"><b>Materials and methods</b></font></p>     <p><font size="2" face="Verdana, Arial, Helvetica, sans-serif"><b>Survey design </b></font></p>     <p><font size="2" face="Verdana, Arial, Helvetica, sans-serif">We selected six stores from the total list of one chain of supermarkets, using stratified convenience sampling to represent three regions of Mexico. The selected cities were Monterrey, Nuevo Le&oacute;n and Cd. Obreg&oacute;n, Sonora (Northern region), Mexico City and San Luis Potos&iacute;, SLP (Central region), and M&eacute;rida, Yucat&aacute;n and Tuxtla Guti&eacute;rrez, Chiapas (Southern region) from November-December 2008. This particular chain of stores was selected because it offered the opportunity to recruit a sample with better socioeconomic and educational status. Every 13<sup>th</sup> consumer entering the supermarket was invited to participate in the study. Selection criteria included to be male or female, 18-55 y old, living in the city for at least two years, and giving their consent to participate. Individual surveys were applied during two 7 h-shifts (morning and afternoon) for six consecutive days in each store. The total duration of the interview was 15 minutes.</font></p>     <p><font size="2" face="Verdana, Arial, Helvetica, sans-serif"><b>Sample size</b></font></p>     <p><font size="2" face="Verdana, Arial, Helvetica, sans-serif">We had a sample of 731 consumers, distributed in six cities, calculated with a confidence of 95% and &#946;=0.8, considering an estimated design effect of 1.5, to estimate proportions with a maximum variance (<i>p</i>=0.5) of consumers that report to use the NIP and estimated error maximum of 9%. </font></p>     ]]></body>
<body><![CDATA[<p><font size="2" face="Verdana, Arial, Helvetica, sans-serif"><b>Definition of variables</b></font></p>     <p><font size="2" face="Verdana, Arial, Helvetica, sans-serif">For the purpose of this study, "NIP" refers to the nutrition information panel on the back of the pack. "Any nutritional information" refers to nutritional claims, nutritional labeling or any nutritional information referring to the content of calories, fat, carbohydrates, minerals, or vitamins in the food packaging. "Subjective understanding" refers to self-reported understanding of NIP. "Objective understanding" refers to results of the minipractical test of NIP understanding (described below).</font></p>     <p><font size="2" face="Verdana, Arial, Helvetica, sans-serif"><b>Questionnaire to evaluate the use and understanding of NIP</b></font></p>     <p><font size="2" face="Verdana, Arial, Helvetica, sans-serif">A 50 items questionnaire including two sections was designed: Section 1) Sociodemographic characteristics, health and nutrition interests, habitual routine when reading the NIP, and self-reported abilities to use and understand the NIP (closed questions); reasons for not understanding or using the NIP (open questions); and 2) A practical test for NIP understanding (closed questions), registering the answering time. </font></p>     <p><font size="2" face="Verdana, Arial, Helvetica, sans-serif"> A pilot test was carried out with consumers from supermarkets not included in this sample, in order to verify consumers' understanding of the items in the above mentioned questionnaire. </font></p>     <p><font size="2" face="Verdana, Arial, Helvetica, sans-serif"> For the practical test of NIP understanding, the NIP of two products of different brands (Product A and B) were reproduced, separated from the original packages to avoid the influence of the type of food or commercial brand (<a href="/img/revistas/spm/v54n2/a09fig01.jpg">figure 1</a>). Both products differed in weight content, number of portions, and appearance. Product B had a lower content of saturated fat, cholesterol, and total fat, slightly more calories, sodium and fiber than Product A. If participants had visual difficulties because of the font size, they were presented with a transcribed version of the NIPs in Arial 12 pt. font. </font></p>     <p><font size="2" face="Verdana, Arial, Helvetica, sans-serif"> After examining and reading the NIPs, participants were asked to answer the following questions: 1) total amount of carbohydrates contained in the product A, 2) Amount of saturated fat in one portion of product A, 3) total amount of calories in the product B, 4) How many portions are in product B, and 5) If you eat the whole content of product B, how many cookies will you be eating? Some of the questions required reading carefully the NIP and others performing simple arithmetic calculations.</font></p>     <p><font size="2" face="Verdana, Arial, Helvetica, sans-serif"><b>Ethical aspects</b></font></p>     <p><font size="2" face="Verdana, Arial, Helvetica, sans-serif">The research protocol was reviewed and approved by the Ethics, Biosecurity and Research Committees of the National Institute of Public Health, Cuernavaca, Mexico. Verbal consent was obtained after explaining the nature and objectives of the study to participants. </font></p>     <p><font size="2" face="Verdana, Arial, Helvetica, sans-serif"><b>Statistical analysis</b></font></p>     ]]></body>
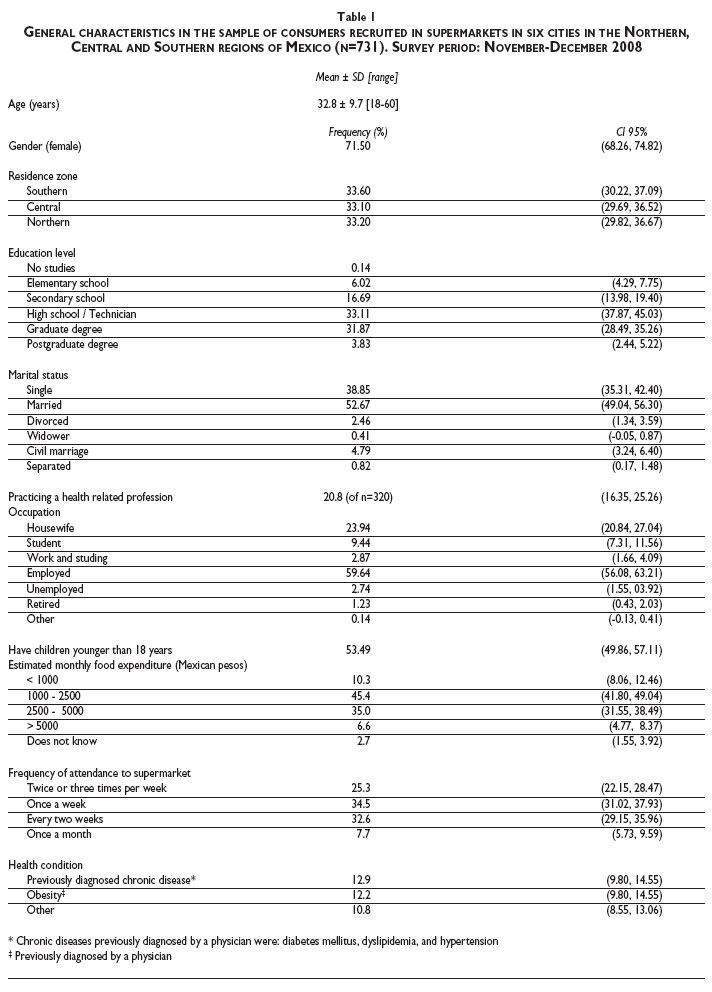
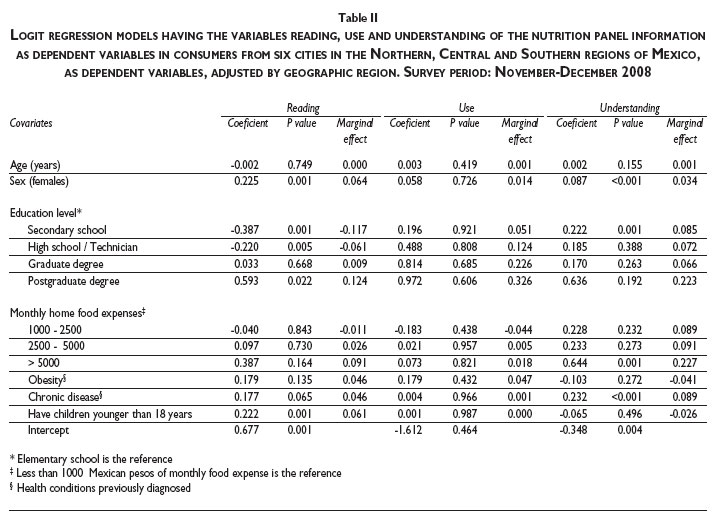
<body><![CDATA[<p><font size="2" face="Verdana, Arial, Helvetica, sans-serif">Separate logit regression models were used to test the association between self-reported NIP reading, use, or understanding alternately, and sex, education, age, food expenditure, obesity, chronic diseases, and having children under 18 y of age. Obesity and chronic diseases were self-reported if the subject had a previously diagnosed by a physician. Marginal effects for each of the associations were estimated. A marginal effect is considered as the change in the probability resulting from a unit change of an independent variable.<sup>21,22</sup></font></p>     <p><font size="2" face="Verdana, Arial, Helvetica, sans-serif"> All analysis were adjusted for the grouping variable (geographic region) and performing bootstrap estimations based on empirical distribution. A code matrix was used to analyze open questions. The number of correct answers attained in the NIP practical test for NIP understanding and the time invested to response was modeled using a Poisson regression model adjusted by sex, education, age, food expenditure, obesity, chronic diseases, and having children under 18 y of age; model assumptions were verified. Data are shown as proportions, geometric means and 95% confidence intervals. Differences were considered significant if <i>p</i>&lt;0.05. Data were analyzed using STATA software, version 11.0 (Stata Corp, USA).</font></p>     <p>&nbsp;</p>     <p><font size="3" face="Verdana, Arial, Helvetica, sans-serif"><b>Results</b></font></p>     <p><font size="2" face="Verdana, Arial, Helvetica, sans-serif">A total of 731 adult consumers, distributed proportionally into the three geographic regions, were surveyed. Most of the consumers were women (70%); 20% of the employed population (n=320) had a health related profession; 70% of the sample had completed high-school education or a higher level (<a href="/img/revistas/spm/v54n2/a09tab01.jpg">table I</a>). Approximately 30% of invited consumers rejected participation; no information on these consumers was collected. This rejection rate is frequent in surveys carried-out in public places.</font></p>     <p><font size="2" face="Verdana, Arial, Helvetica, sans-serif"><b>Factors associated with purchasing decisions</b></font></p>     <p><font size="2" face="Verdana, Arial, Helvetica, sans-serif">The consumers declared taking their purchasing decisions mainly considering the product expiration date (57%), the trade mark (27%), and the price (23%). A 17% of consumers reported consulting the NIP and 16% basing their food choices on perceived product healthiness. Frequencies are not mutually exclusive (<a href="/img/revistas/spm/v54n2/a09fig02.jpg">figure 2</a>).</font></p>     <p><font size="2" face="Verdana, Arial, Helvetica, sans-serif"><b>NIP reading</b></font></p>     <p><font size="2" face="Verdana, Arial, Helvetica, sans-serif">About 79% of consumers reported reading the NIP; 50% of consumers out of those who declared to read NIP, did it rarely, 39% sometimes or frequently, 11% only the first time buying the product.</font></p>     <p><font size="2" face="Verdana, Arial, Helvetica, sans-serif"> After adjusting for confounding variables, women were 6% more likely to read the NIP than men (p&lt;0.001). Consumers with a higher level of education (12.4%, <i>p</i>=0.022) and those having children under 18 y old (6.4%, <i>p</i>=0.001) were also more likely to report reading the NIP than their respective counterparts. The association between consumers previously diagnosed with chronic diseases and NIP reading was marginally significant (<i>p</i>=0.06) (<a href="/img/revistas/spm/v54n2/a09tab02.jpg">table II</a>).</font></p>     ]]></body>
<body><![CDATA[<p><font size="2" face="Verdana, Arial, Helvetica, sans-serif"><b>Use of NIP and "Any Nutritional Information"</b></font></p>     <p><font size="2" face="Verdana, Arial, Helvetica, sans-serif">A total of 17% of consumers reported using the NIP as the main information at least for one food purchasing event. A total of 59% mentioned to use "any other nutritional information" to make food purchase decisions, in addition to other purchasing criteria. In both cases, 40% reported using this information rarely, 22.2% and 29.6% reported using it sometimes or very frequently, respectively and 8.1% reported using it the first time they bought a new product. </font></p>     <p><font size="2" face="Verdana, Arial, Helvetica, sans-serif"> The main barriers for consumers not using the NIP or any other nutritional information were: lack of interest, time constraints, and null understanding of nutritional information. No statistical associations were found between the use of NIP or any other nutritional information (data not shown) and sex, education level, SES, obesity or previously diagnosed chronic disease (<a href="/img/revistas/spm/v54n2/a09tab02.jpg">table II</a>).</font></p>     <p><font size="2" face="Verdana, Arial, Helvetica, sans-serif"><b>Subjective understanding of NIP</b></font></p>     <p><font size="2" face="Verdana, Arial, Helvetica, sans-serif">Fifty seven percent of consumers reported to understand the NIP. The reasons for not understanding the NIP (43%) were: not knowing the technical terms, confusion when interpreting the information and lack of trust on the truthfulness of the information.</font></p>     <p><font size="2" face="Verdana, Arial, Helvetica, sans-serif"> Women were 3.5% more likely to report understanding NIP than men (<i>p</i>&lt;0.001). Consumers graduated from high-school (<i>p</i>=0.001), spending more than $5000 pesos/month in food (<i>p</i>=0.001), or previously diagnosed with chronic diseases (<i>p</i>&lt;0.001) were more likely to report understanding NIP that their counterparts (<a href="/img/revistas/spm/v54n2/a09tab02.jpg">table II</a>).</font></p>     <p><font size="2" face="Verdana, Arial, Helvetica, sans-serif"><b>Objective understanding of NIP</b></font></p>     <p><font size="2" face="Verdana, Arial, Helvetica, sans-serif">The font size of the NIP was too small to be read by 33.7% of consumers, thus, they were provided with a larger font size version. For this section 1.24, 4.5, 9.7, 42.3, 30.8 and 11.7% of consumers answered correctly 5, 4, 3, 2, 1 and 0 questions, respectively; no differences by sex were found. The median of time employed to answer this section was three minutes (range: 0.66, 14). In a Poisson regression model, the time spent was positively associated with answering correctly: for each additional minute, consumers had 6% more probabilities for a better score (<i>p</i>&lt;0.001); similarly, higher SES and education level had higher probabilities for a better score. Older consumers and consumers having children under18 y old, had a lower probability for a better score (<i>p</i>&lt;0.001). No differences by sex or health status were found (<a href="/img/revistas/spm/v54n2/a09tab03.jpg">table III</a>).</font></p>     <p><font size="2" face="Verdana, Arial, Helvetica, sans-serif"><b>Choosing the "healthiest" product</b></font></p>     <p><font size="2" face="Verdana, Arial, Helvetica, sans-serif">A total of 44.9% consumers chose product A based on vitamin content (44.5%), colorful label format (15.9%), calories (11.6%), or fat content (9.2%). The consumers choosing product B (49.5%) because of its lower fat content (36.6%), higher fiber content (19%), and the label format (13.1%). A total of 1.8% of consumers mentioned that both products were healthy, while 2.5% indicated that none of them was healthy.</font></p>     ]]></body>
<body><![CDATA[<p>&nbsp;</p>     <p><font size="3" face="Verdana, Arial, Helvetica, sans-serif"><b>Discussion</b></font></p>     <p><font size="2" face="Verdana, Arial, Helvetica, sans-serif"><b>The use of NIP</b></font></p>     <p><font size="2" face="Verdana, Arial, Helvetica, sans-serif">Only a small proportion of the sample reported to use the NIP for purchasing decisions, contrasting with a high proportion of consumers using the NIP in New Zealand (66-87%)<sup>16</sup> and USA (80%).<sup>5</sup> A recent survey in USA, showed that 68% of Americans use the NIP, however taste was the main influence on purchasing decisions (86%), followed by price, healthfulness (58%), and convenience (56 %).<sup>18</sup> The difference of our results with those reports may be explained by differences in culture and a higher level of consumers awareness in those countries. </font></p>     <p><font size="2" face="Verdana, Arial, Helvetica, sans-serif"> On the contrary, two thirds of Mexican consumers mentioned to use "any nutritional information" as a secondary food purchasing criterion. This difference might be due to the influence of nutritional and health claims, included in the food package, known to influence purchasing decisions.<sup>23</sup> The reasons expressed by our consumers for not using the NIP were lack of time and/or interest and poor understanding of the nutritional information, also identified by others.<sup>15</sup> Purchasing decisions were led by brand name, freshness, and price in our sample. </font></p>     <p><font size="2" face="Verdana, Arial, Helvetica, sans-serif"> We did not find differences by sex, age, education level, SES or health status in the use of the NIP found in previous reports from industrialized countries.<sup>7,9,10,15</sup> In an American study, obese consumers looked-out more frequently for information on calories and fat in the NIP than non-obese consumers. In our study, search for the NIP by consumers with a previously diagnosed with chronic diseases, which included obesity was marginally significant. This association might be underestimated since we did not include an objective measure of obesity. In general, this lack of association might be due to the homogeneity of our sample, characterized by a higher level of education and SES, compared with the Mexican population at large and their limited use of the NIP.</font></p>     <p><font size="2" face="Verdana, Arial, Helvetica, sans-serif"><b>Understanding of NIP</b></font></p>     <p><font size="2" face="Verdana, Arial, Helvetica, sans-serif">A large proportion of consumers declared to understand the NIP (subjective understanding), however only a very low proportion of consumers answered correctly the practical test exploring the objective understanding of NIP. Such a difference may be due to the consumers believe that they are able to interpret the NIP, based on their basic understanding of a few nutritional terms,<sup>15</sup> since most of them had a high level of education (&gt;12 completed school years). Studies in developed countries found that consumers are able to retrieve simple information and perform simple calculations and comparisons between products using numerical information, but their ability to interpret the nutrition label accurately reduces as the complexity of the task increases.<sup>10</sup></font></p>     <p><font size="2" face="Verdana, Arial, Helvetica, sans-serif"> The present sample had 4 years of education experience (12.5 y) more than the mean Mexican adults (8.7 completed years) in 2008.<sup>24</sup> In spite of this fact, only 1% of consumers were able extract and process numerical information to answer correctly the items in the NIP understanding practical test. The high proportion of incorrect answers might be due to unfamiliarity with the label format, or to a low exposure to the NIP. Other reasons might relate to nervousness generated by the test, time pressure; the mean time invested to solve the test (3 min) might not be enough for interpreting the NIP. </font></p>     <p><font size="2" face="Verdana, Arial, Helvetica, sans-serif"> Our results contrast with those from New Zealand, where two thirds of consumers estimated correctly the amount of total fat per 100 g or sugar per serving.16 Based on our results, probably less than 1% of Mexican consumers would be able to perform those calculations correctly. Perhaps, people with a lower level of education than our sample or with special dietary needs (e.g., pregnancy, breast feeding, and chronic diseases) would be more likely to have difficulties in understanding the NIP and use it correctly, as occurs in other countries.<sup>9</sup></font></p>     ]]></body>
<body><![CDATA[<p><font size="2" face="Verdana, Arial, Helvetica, sans-serif"> Consumers chose product B as healthier because its lower fat and higher fiber content. The majority of consumers chose product A as healthier because of its vitamin and mineral content and the label appearance, without considering the content of nutrients that might represent a risk for health. </font></p>     <p><font size="2" face="Verdana, Arial, Helvetica, sans-serif"> Our results showed that the NIP appearance (colored format), the number of nutrients declared and the letter size used can confuse consumers when reviewing and comparing labels. Therefore, format improvements in the current nutrition labeling may help consumers to improve their understanding of the NIP.<sup>2</sup> A proportion of respondents able to understand the nutritional concepts in NIP may improve their abilities to extract information with a larger font size.</font></p>     <p><font size="2" face="Verdana, Arial, Helvetica, sans-serif"> This is important considering that the food labeling Mexican regulation (NOM-051-2010) allows food industry to decide on the number of nutrients to declare and there in no specification for letter size or colors used. </font></p>     <p><font size="2" face="Verdana, Arial, Helvetica, sans-serif"> The reasons found in this study for not using the NIP, i.e. not knowing the meaning of the technical terms, lack of confidence in the truthfulness of the information are similar to those found in studies from other countries.<sup>9,15,19 </sup></font></p>     <p><font size="2" face="Verdana, Arial, Helvetica, sans-serif"> We were not able to collect information of consumers who rejected to participate in the study and to assess whether our sample was biased. For the purpose of this study we selected a skewed sample of persons with higher SES and higher school experience. Based on the hypothesis that this sample will have the optimal capacity to interpret numerical data and, thus, to better process the information in the NIP. In consequence, the inferences from our result are applicable to such a layer of the population and are not representative the Mexican population at large. It can be assumed that population with lower educational experience will have a similar or lower understanding capacity.</font></p>     <p><font size="2" face="Verdana, Arial, Helvetica, sans-serif"> One of the strengths of this study is providing some insights regarding the factors associated to reading, using and understanding the NIP in a sample of Mexican consumers. </font></p>     <p><font size="2" face="Verdana, Arial, Helvetica, sans-serif"> In conclusion, the use and understanding of the NIP is low despite the high proportion of self-reported reading and understanding. The NIP does not seem to be an effective tool to communicate the nutritional information to consumers because requires previous understanding of the NIP technical terms, numerical abilities to interpret its information, and time to read it carefully during a purchasing event. In addition there is a lack of trust by the consumers in the truthfulness of the information. This results may help decision makers and academics to design public strategies to improve characteristics of the NIP as an instrument for consumers to make informed food choices. </font></p>     <p>&nbsp;</p>     <p><font size="3" face="Verdana, Arial, Helvetica, sans-serif"><b>Acknowledgments</b></font></p>     <p><font size="2" face="Verdana, Arial, Helvetica, sans-serif">We thank the support provided by the Wal-Mart Foundation during the survey; the field personnel: Elena Carrillo-Cruz, Socorro Jaimes-Ter&aacute;n, Miguel Gaytan-Colin, Er&eacute;ndira Mar&iacute;n-Mendoza, and Fabiola P&eacute;rez for their invaluable work. </font></p>     ]]></body>
<body><![CDATA[<p>&nbsp;</p>     <p><font size="3" face="Verdana, Arial, Helvetica, sans-serif"><b>References</b></font></p>     <!-- ref --><p><font size="2" face="Verdana, Arial, Helvetica, sans-serif">1. Van den Wijngaart AW. Nutrition labelling: purpose, scientific issues and challenges. Asia Pac J Clin Nutr 2002; 11(2): S68-S71.    &nbsp;&nbsp;&nbsp;&nbsp;&nbsp;&nbsp;&nbsp;&nbsp;[&#160;<a href="javascript:void(0);" onclick="javascript: window.open('/scielo.php?script=sci_nlinks&ref=9390720&pid=S0036-3634201200020001200001&lng=','','width=640,height=500,resizable=yes,scrollbars=1,menubar=yes,');">Links</a>&#160;]<!-- end-ref --></font></p>     <!-- ref --><p><font size="2" face="Verdana, Arial, Helvetica, sans-serif">2. Cowburn G, Stockley L. A systematic review of the research on consumer understanding of nutrition labelling. Brussels: European Heart Network, 2003.    &nbsp;&nbsp;&nbsp;&nbsp;&nbsp;&nbsp;&nbsp;&nbsp;[&#160;<a href="javascript:void(0);" onclick="javascript: window.open('/scielo.php?script=sci_nlinks&ref=9390722&pid=S0036-3634201200020001200002&lng=','','width=640,height=500,resizable=yes,scrollbars=1,menubar=yes,');">Links</a>&#160;]<!-- end-ref --></font></p>     <!-- ref --><p><font size="2" face="Verdana, Arial, Helvetica, sans-serif">3. Satia JA, Galanko JA, Neuhouser ML. Food nutrition label use is associated with demographic, behavioral, and psychosocial factors and dietary intake among African Americans in North Carolina. J Am Diet Assoc 2005; 105(3): 392-402.    &nbsp;&nbsp;&nbsp;&nbsp;&nbsp;&nbsp;&nbsp;&nbsp;[&#160;<a href="javascript:void(0);" onclick="javascript: window.open('/scielo.php?script=sci_nlinks&ref=9390724&pid=S0036-3634201200020001200003&lng=','','width=640,height=500,resizable=yes,scrollbars=1,menubar=yes,');">Links</a>&#160;]<!-- end-ref --></font></p>     <!-- ref --><p><font size="2" face="Verdana, Arial, Helvetica, sans-serif">4. Lin CT, Lee JY, Yen ST. Do dietary intakes affect search for nutrient information on food labels? Soc Sci Med 2004; 59(9): 1955-1967.    &nbsp;&nbsp;&nbsp;&nbsp;&nbsp;&nbsp;&nbsp;&nbsp;[&#160;<a href="javascript:void(0);" onclick="javascript: window.open('/scielo.php?script=sci_nlinks&ref=9390726&pid=S0036-3634201200020001200004&lng=','','width=640,height=500,resizable=yes,scrollbars=1,menubar=yes,');">Links</a>&#160;]<!-- end-ref --></font></p>     ]]></body>
<body><![CDATA[<!-- ref --><p><font size="2" face="Verdana, Arial, Helvetica, sans-serif">5. Neuhouser ML, Kristal AR, Patterson RE. Use of food nutrition labels is associated with lower fat intake. J Am Diet Assoc 1999; 99(1): 45-53.    &nbsp;&nbsp;&nbsp;&nbsp;&nbsp;&nbsp;&nbsp;&nbsp;[&#160;<a href="javascript:void(0);" onclick="javascript: window.open('/scielo.php?script=sci_nlinks&ref=9390728&pid=S0036-3634201200020001200005&lng=','','width=640,height=500,resizable=yes,scrollbars=1,menubar=yes,');">Links</a>&#160;]<!-- end-ref --></font></p>     <!-- ref --><p><font size="2" face="Verdana, Arial, Helvetica, sans-serif">6. Variyam JN. Do nutrition labels improve dietary outcomes? Health Econ 2008; 17(6): 695-708.    &nbsp;&nbsp;&nbsp;&nbsp;&nbsp;&nbsp;&nbsp;&nbsp;[&#160;<a href="javascript:void(0);" onclick="javascript: window.open('/scielo.php?script=sci_nlinks&ref=9390730&pid=S0036-3634201200020001200006&lng=','','width=640,height=500,resizable=yes,scrollbars=1,menubar=yes,');">Links</a>&#160;]<!-- end-ref --></font></p>     <!-- ref --><p><font size="2" face="Verdana, Arial, Helvetica, sans-serif">7. Guthrie J, Fox J, Cleveland L, Welsh S. Who uses nutrition labeling, and what effects does label use have on diet quality? J Nutr Educ 1995; 27 (4): 163-172.    &nbsp;&nbsp;&nbsp;&nbsp;&nbsp;&nbsp;&nbsp;&nbsp;[&#160;<a href="javascript:void(0);" onclick="javascript: window.open('/scielo.php?script=sci_nlinks&ref=9390732&pid=S0036-3634201200020001200007&lng=','','width=640,height=500,resizable=yes,scrollbars=1,menubar=yes,');">Links</a>&#160;]<!-- end-ref --></font></p>     <!-- ref --><p><font size="2" face="Verdana, Arial, Helvetica, sans-serif">8. Kreuter MW, Brennan LK, Scharff DP, Lukwago SN. Do nutrition label readers eat healthier diets? Behavioral correlates of adults' use of food labels. Am J Prev Med 1997; 13(4): 277-283.    &nbsp;&nbsp;&nbsp;&nbsp;&nbsp;&nbsp;&nbsp;&nbsp;[&#160;<a href="javascript:void(0);" onclick="javascript: window.open('/scielo.php?script=sci_nlinks&ref=9390734&pid=S0036-3634201200020001200008&lng=','','width=640,height=500,resizable=yes,scrollbars=1,menubar=yes,');">Links</a>&#160;]<!-- end-ref --></font></p>     <!-- ref --><p><font size="2" face="Verdana, Arial, Helvetica, sans-serif">9. Drichoutis AC, Panagiotis L, Rodolfo M. Nayga J. Consumers' Use of Nutritional Labels: A Review of Research Studies and Issues. Academy of Marketing Science Review, 2006. 9: p. &#91;Accessed 2009 August&#93; Available at: <a href="http://www.amsreview.org/articles/drichoutis09-2006.pdf" target="_blank">http://www.amsreview.org/articles/drichoutis09-2006.pdf</a> </font>&nbsp;&nbsp;&nbsp;&nbsp;&nbsp;&nbsp;&nbsp;&nbsp;[&#160;<a href="javascript:void(0);" onclick="javascript: window.open('/scielo.php?script=sci_nlinks&ref=9390736&pid=S0036-3634201200020001200009&lng=','','width=640,height=500,resizable=yes,scrollbars=1,menubar=yes,');">Links</a>&#160;]<!-- end-ref --><!-- ref --><p><font size="2" face="Verdana, Arial, Helvetica, sans-serif">10. Cowburn G, Stockley L. Consumer understanding and use of nutrition labelling: a systematic review. Public Health Nutr 2005; 8(1): 21-28.    &nbsp;&nbsp;&nbsp;&nbsp;&nbsp;&nbsp;&nbsp;&nbsp;[&#160;<a href="javascript:void(0);" onclick="javascript: window.open('/scielo.php?script=sci_nlinks&ref=9390737&pid=S0036-3634201200020001200010&lng=','','width=640,height=500,resizable=yes,scrollbars=1,menubar=yes,');">Links</a>&#160;]<!-- end-ref --></font></p>     <!-- ref --><p><font size="2" face="Verdana, Arial, Helvetica, sans-serif">11. Drichoutis AC, Lazaridis P, Nayga RM, Jr. An assessment of product class involvement in food purchasing behaviour. Eur J Mark 2007; 41:7/8: 888-914 </font>&nbsp;&nbsp;&nbsp;&nbsp;&nbsp;&nbsp;&nbsp;&nbsp;[&#160;<a href="javascript:void(0);" onclick="javascript: window.open('/scielo.php?script=sci_nlinks&ref=9390739&pid=S0036-3634201200020001200011&lng=','','width=640,height=500,resizable=yes,scrollbars=1,menubar=yes,');">Links</a>&#160;]<!-- end-ref --><!-- ref --><p><font size="2" face="Verdana, Arial, Helvetica, sans-serif">12. Fitzgerald N, Damio G, Segura-Perez S, Perez-Escamilla R. Nutrition knowledge, food label use, and food intake patterns among Latinas with and without type 2 diabetes. J Am Diet Assoc 2008; 108(6): 960-967.    &nbsp;&nbsp;&nbsp;&nbsp;&nbsp;&nbsp;&nbsp;&nbsp;[&#160;<a href="javascript:void(0);" onclick="javascript: window.open('/scielo.php?script=sci_nlinks&ref=9390740&pid=S0036-3634201200020001200012&lng=','','width=640,height=500,resizable=yes,scrollbars=1,menubar=yes,');">Links</a>&#160;]<!-- end-ref --></font></p>     <!-- ref --><p><font size="2" face="Verdana, Arial, Helvetica, sans-serif">13. Boden M, Dadswell R, Hattersley S. Review of statutory and voluntary labelling of food allergens. Proc Nutr Soc 2005; 64(4): 475-480.    &nbsp;&nbsp;&nbsp;&nbsp;&nbsp;&nbsp;&nbsp;&nbsp;[&#160;<a href="javascript:void(0);" onclick="javascript: window.open('/scielo.php?script=sci_nlinks&ref=9390742&pid=S0036-3634201200020001200013&lng=','','width=640,height=500,resizable=yes,scrollbars=1,menubar=yes,');">Links</a>&#160;]<!-- end-ref --></font></p>     <!-- ref --><p><font size="2" face="Verdana, Arial, Helvetica, sans-serif">14. Hearty AP, McCarthy SN, Kearney JM, Gibney MJ. Relationship between attitudes towards healthy eating and dietary behaviour, lifestyle and demographic factors in a representative sample of Irish adults. Appetite 2007; 48(1): 1-11.    &nbsp;&nbsp;&nbsp;&nbsp;&nbsp;&nbsp;&nbsp;&nbsp;[&#160;<a href="javascript:void(0);" onclick="javascript: window.open('/scielo.php?script=sci_nlinks&ref=9390744&pid=S0036-3634201200020001200014&lng=','','width=640,height=500,resizable=yes,scrollbars=1,menubar=yes,');">Links</a>&#160;]<!-- end-ref --></font></p>     <!-- ref --><p><font size="2" face="Verdana, Arial, Helvetica, sans-serif">15. Grunert K, Wills J. A review of European research on consumer response to nutrition information on food labels. J Public Health 2007; 15(5): 385-399.    &nbsp;&nbsp;&nbsp;&nbsp;&nbsp;&nbsp;&nbsp;&nbsp;[&#160;<a href="javascript:void(0);" onclick="javascript: window.open('/scielo.php?script=sci_nlinks&ref=9390746&pid=S0036-3634201200020001200015&lng=','','width=640,height=500,resizable=yes,scrollbars=1,menubar=yes,');">Links</a>&#160;]<!-- end-ref --></font></p>     ]]></body>
<body><![CDATA[<!-- ref --><p><font size="2" face="Verdana, Arial, Helvetica, sans-serif">16. Gorton D, Ni Mhurchu C, Chen MH, Dixon R. Nutrition labels: a survey of use, understanding and preferences among ethnically diverse shoppers in New Zealand. Public Health Nutr 2009; 12(9): 1359-1365.    &nbsp;&nbsp;&nbsp;&nbsp;&nbsp;&nbsp;&nbsp;&nbsp;[&#160;<a href="javascript:void(0);" onclick="javascript: window.open('/scielo.php?script=sci_nlinks&ref=9390748&pid=S0036-3634201200020001200016&lng=','','width=640,height=500,resizable=yes,scrollbars=1,menubar=yes,');">Links</a>&#160;]<!-- end-ref --></font></p>     <!-- ref --><p><font size="2" face="Verdana, Arial, Helvetica, sans-serif">17. Krukowski RA, Harvey-Berino J, Kolodinsky J, Narsana RT, Desisto TP. Consumers may not use or understand calorie labeling in restaurants. J Am Diet Assoc 2006; 106(6): 917-920.    &nbsp;&nbsp;&nbsp;&nbsp;&nbsp;&nbsp;&nbsp;&nbsp;[&#160;<a href="javascript:void(0);" onclick="javascript: window.open('/scielo.php?script=sci_nlinks&ref=9390750&pid=S0036-3634201200020001200017&lng=','','width=640,height=500,resizable=yes,scrollbars=1,menubar=yes,');">Links</a>&#160;]<!-- end-ref --></font></p>     <!-- ref --><p><font size="2" face="Verdana, Arial, Helvetica, sans-serif">18. International Food Information Council Foundation 2010 Food &amp; Health Survey. Consumer Attitudes Toward Food Safety, Nutrition, &amp; Health2010. &#91;Accessed March 3 2011&#93;. Available at: <a href="http://www.foodinsight.org/Content/3651/2010FinalFullReport.pdf" target="_blank">http://www.foodinsight.org/Content/3651/2010FinalFullReport.pdf</a>.    &nbsp;&nbsp;&nbsp;&nbsp;&nbsp;&nbsp;&nbsp;&nbsp;[&#160;<a href="javascript:void(0);" onclick="javascript: window.open('/scielo.php?script=sci_nlinks&ref=9390752&pid=S0036-3634201200020001200018&lng=','','width=640,height=500,resizable=yes,scrollbars=1,menubar=yes,');">Links</a>&#160;]<!-- end-ref --></font></p>     <!-- ref --><p><font size="2" face="Verdana, Arial, Helvetica, sans-serif">19. Mannell A, Brevard P, Nayga P, Combris P, Lee R, Gloeckner J. French consumers' use of nutrition labels. Nutrition &amp; Food Science 2006; 36: 159-168.    &nbsp;&nbsp;&nbsp;&nbsp;&nbsp;&nbsp;&nbsp;&nbsp;[&#160;<a href="javascript:void(0);" onclick="javascript: window.open('/scielo.php?script=sci_nlinks&ref=9390754&pid=S0036-3634201200020001200019&lng=','','width=640,height=500,resizable=yes,scrollbars=1,menubar=yes,');">Links</a>&#160;]<!-- end-ref --></font></p>     <!-- ref --><p><font size="2" face="Verdana, Arial, Helvetica, sans-serif">20. Byrd-Bredbenner C, Alfieri L, Kiefer L. The nutrition label knowledge and usage behaviours of women in the US. Nutr Bull 2000; 25: 315-322.    &nbsp;&nbsp;&nbsp;&nbsp;&nbsp;&nbsp;&nbsp;&nbsp;[&#160;<a href="javascript:void(0);" onclick="javascript: window.open('/scielo.php?script=sci_nlinks&ref=9390756&pid=S0036-3634201200020001200020&lng=','','width=640,height=500,resizable=yes,scrollbars=1,menubar=yes,');">Links</a>&#160;]<!-- end-ref --></font></p>     ]]></body>
<body><![CDATA[<!-- ref --><p><font size="2" face="Verdana, Arial, Helvetica, sans-serif">21. Petersen T. A Comment on Presenting Results from Logit and Probit Models. American Sociological Review 1985(1): 130-131.    &nbsp;&nbsp;&nbsp;&nbsp;&nbsp;&nbsp;&nbsp;&nbsp;[&#160;<a href="javascript:void(0);" onclick="javascript: window.open('/scielo.php?script=sci_nlinks&ref=9390758&pid=S0036-3634201200020001200021&lng=','','width=640,height=500,resizable=yes,scrollbars=1,menubar=yes,');">Links</a>&#160;]<!-- end-ref --></font></p>     <!-- ref --><p><font size="2" face="Verdana, Arial, Helvetica, sans-serif">22. Zelner BA. Using simulation to interpret results from logit, probit, and other nonlinear models. Strategic Management Journal 2009; 30: 1335-1348.    &nbsp;&nbsp;&nbsp;&nbsp;&nbsp;&nbsp;&nbsp;&nbsp;[&#160;<a href="javascript:void(0);" onclick="javascript: window.open('/scielo.php?script=sci_nlinks&ref=9390760&pid=S0036-3634201200020001200022&lng=','','width=640,height=500,resizable=yes,scrollbars=1,menubar=yes,');">Links</a>&#160;]<!-- end-ref --></font></p>     <!-- ref --><p><font size="2" face="Verdana, Arial, Helvetica, sans-serif">23. Williams P. Consumer understanding and use of health claims for foods. Nutr Rev 2005; 63(7): 256-264.    &nbsp;&nbsp;&nbsp;&nbsp;&nbsp;&nbsp;&nbsp;&nbsp;[&#160;<a href="javascript:void(0);" onclick="javascript: window.open('/scielo.php?script=sci_nlinks&ref=9390762&pid=S0036-3634201200020001200023&lng=','','width=640,height=500,resizable=yes,scrollbars=1,menubar=yes,');">Links</a>&#160;]<!-- end-ref --></font></p>     <!-- ref --><p><font size="2" face="Verdana, Arial, Helvetica, sans-serif">24. Instituto Nacional de Estad&iacute;stica y Geograf&iacute;a (M&eacute;xico). M&eacute;xico de un vistazo 2009/Instituto Nacional de Estad&iacute;stica y Geograf&iacute;a.-M&eacute;xico: INEGI 2009. &#91;Accessed January 20 2010&#93;. Available at: &lt;<a href="http://www.inegi.gob.mx/prod_serv/contenidos/espanol/bvinegi/productos/integracion/pais/mexvista/2009/mexvis2009.pdf" target="_blank">http://www.inegi.gob.mx/prod_serv/contenidos/espanol/bvinegi/productos/integracion/pais/mexvista/2009/mexvis2009.pdf</a>&gt;    &nbsp;&nbsp;&nbsp;&nbsp;&nbsp;&nbsp;&nbsp;&nbsp;[&#160;<a href="javascript:void(0);" onclick="javascript: window.open('/scielo.php?script=sci_nlinks&ref=9390764&pid=S0036-3634201200020001200024&lng=','','width=640,height=500,resizable=yes,scrollbars=1,menubar=yes,');">Links</a>&#160;]<!-- end-ref -->. </font></p>     <p>&nbsp;</p>     <p>&nbsp;</p>     ]]></body>
<body><![CDATA[<p><font size="2" face="Verdana, Arial, Helvetica, sans-serif"><b><a name="end" id="end"></a><a href="#top"><img src="/img/revistas/spm/v54n2/seta.jpg" alt="" border="0" /></a> Corresponding author: </b><br />   Dr. Salvador Villalpando. <br />   Instituto Nacional de Salud P&uacute;blica. <br />   Av. Universidad 655, col. Santa Mar&iacute;a Ahuacatitl&aacute;n.<br />   62100 Cuernavaca, Morelos, M&eacute;xico.<br />   E-mail: <a href="mailto:svillalp@insp.mx">svillalp@insp.mx</a></font></p>     <p><font size="2" face="Verdana, Arial, Helvetica, sans-serif">Received on: May 2, 2011 <br />   Accepted on: November 22, 2011</font></p>     <p>&nbsp;</p>     <p>&nbsp;</p>     <p><font size="2" face="Verdana, Arial, Helvetica, sans-serif">Declaration of conflict of interests: The authors declare that they have no conflict of interests.</font></p>      ]]></body><back>
<ref-list>
<ref id="B1">
<label>1</label><nlm-citation citation-type="journal">
<person-group person-group-type="author">
<name>
<surname><![CDATA[Van den Wijngaart]]></surname>
<given-names><![CDATA[AW]]></given-names>
</name>
</person-group>
<article-title xml:lang="en"><![CDATA[Nutrition labelling: purpose, scientific issues and challenges]]></article-title>
<source><![CDATA[Asia Pac J Clin Nutr]]></source>
<year>2002</year>
<volume>11</volume>
<numero>2</numero>
<issue>2</issue>
<page-range>S68-S71</page-range></nlm-citation>
</ref>
<ref id="B2">
<label>2</label><nlm-citation citation-type="book">
<person-group person-group-type="author">
<name>
<surname><![CDATA[Cowburn]]></surname>
<given-names><![CDATA[G]]></given-names>
</name>
<name>
<surname><![CDATA[Stockley]]></surname>
<given-names><![CDATA[L]]></given-names>
</name>
</person-group>
<source><![CDATA[A systematic review of the research on consumer understanding of nutrition labelling]]></source>
<year>2003</year>
<publisher-loc><![CDATA[Brussels ]]></publisher-loc>
<publisher-name><![CDATA[European Heart Network]]></publisher-name>
</nlm-citation>
</ref>
<ref id="B3">
<label>3</label><nlm-citation citation-type="journal">
<person-group person-group-type="author">
<name>
<surname><![CDATA[Satia]]></surname>
<given-names><![CDATA[JA]]></given-names>
</name>
<name>
<surname><![CDATA[Galanko]]></surname>
<given-names><![CDATA[JA]]></given-names>
</name>
<name>
<surname><![CDATA[Neuhouser]]></surname>
<given-names><![CDATA[ML]]></given-names>
</name>
</person-group>
<article-title xml:lang="en"><![CDATA[Food nutrition label use is associated with demographic, behavioral, and psychosocial factors and dietary intake among African Americans in North Carolina]]></article-title>
<source><![CDATA[J Am Diet Assoc]]></source>
<year>2005</year>
<volume>105</volume>
<numero>3</numero>
<issue>3</issue>
<page-range>392-402</page-range></nlm-citation>
</ref>
<ref id="B4">
<label>4</label><nlm-citation citation-type="journal">
<person-group person-group-type="author">
<name>
<surname><![CDATA[Lin]]></surname>
<given-names><![CDATA[CT]]></given-names>
</name>
<name>
<surname><![CDATA[Lee]]></surname>
<given-names><![CDATA[JY]]></given-names>
</name>
<name>
<surname><![CDATA[Yen]]></surname>
<given-names><![CDATA[ST]]></given-names>
</name>
</person-group>
<article-title xml:lang="en"><![CDATA[Do dietary intakes affect search for nutrient information on food labels]]></article-title>
<source><![CDATA[Soc Sci Med]]></source>
<year>2004</year>
<volume>59</volume>
<numero>9</numero>
<issue>9</issue>
<page-range>1955-1967</page-range></nlm-citation>
</ref>
<ref id="B5">
<label>5</label><nlm-citation citation-type="journal">
<person-group person-group-type="author">
<name>
<surname><![CDATA[Neuhouser]]></surname>
<given-names><![CDATA[ML]]></given-names>
</name>
<name>
<surname><![CDATA[Kristal]]></surname>
<given-names><![CDATA[AR]]></given-names>
</name>
<name>
<surname><![CDATA[Patterson]]></surname>
<given-names><![CDATA[RE]]></given-names>
</name>
</person-group>
<article-title xml:lang="en"><![CDATA[Use of food nutrition labels is associated with lower fat intake]]></article-title>
<source><![CDATA[J Am Diet Assoc]]></source>
<year>1999</year>
<volume>99</volume>
<numero>1</numero>
<issue>1</issue>
<page-range>45-53</page-range></nlm-citation>
</ref>
<ref id="B6">
<label>6</label><nlm-citation citation-type="journal">
<person-group person-group-type="author">
<name>
<surname><![CDATA[Variyam]]></surname>
<given-names><![CDATA[JN]]></given-names>
</name>
</person-group>
<article-title xml:lang="en"><![CDATA[Do nutrition labels improve dietary outcomes]]></article-title>
<source><![CDATA[Health Econ]]></source>
<year>2008</year>
<volume>17</volume>
<numero>6</numero>
<issue>6</issue>
<page-range>695-708</page-range></nlm-citation>
</ref>
<ref id="B7">
<label>7</label><nlm-citation citation-type="journal">
<person-group person-group-type="author">
<name>
<surname><![CDATA[Guthrie]]></surname>
<given-names><![CDATA[J]]></given-names>
</name>
<name>
<surname><![CDATA[Fox]]></surname>
<given-names><![CDATA[J]]></given-names>
</name>
<name>
<surname><![CDATA[Cleveland]]></surname>
<given-names><![CDATA[L]]></given-names>
</name>
<name>
<surname><![CDATA[Welsh]]></surname>
<given-names><![CDATA[S]]></given-names>
</name>
</person-group>
<article-title xml:lang="en"><![CDATA[Who uses nutrition labeling, and what effects does label use have on diet quality]]></article-title>
<source><![CDATA[J Nutr Educ]]></source>
<year>1995</year>
<volume>27</volume>
<numero>4</numero>
<issue>4</issue>
<page-range>163-172</page-range></nlm-citation>
</ref>
<ref id="B8">
<label>8</label><nlm-citation citation-type="journal">
<person-group person-group-type="author">
<name>
<surname><![CDATA[Kreuter]]></surname>
<given-names><![CDATA[MW]]></given-names>
</name>
<name>
<surname><![CDATA[Brennan]]></surname>
<given-names><![CDATA[LK]]></given-names>
</name>
<name>
<surname><![CDATA[Scharff]]></surname>
<given-names><![CDATA[DP]]></given-names>
</name>
<name>
<surname><![CDATA[Lukwago]]></surname>
<given-names><![CDATA[SN]]></given-names>
</name>
</person-group>
<article-title xml:lang="en"><![CDATA[Do nutrition label readers eat healthier diets: Behavioral correlates of adults' use of food labels]]></article-title>
<source><![CDATA[Am J Prev Med]]></source>
<year>1997</year>
<volume>13</volume>
<numero>4</numero>
<issue>4</issue>
<page-range>277-283</page-range></nlm-citation>
</ref>
<ref id="B9">
<label>9</label><nlm-citation citation-type="book">
<person-group person-group-type="author">
<name>
<surname><![CDATA[Drichoutis]]></surname>
<given-names><![CDATA[AC]]></given-names>
</name>
<name>
<surname><![CDATA[Panagiotis]]></surname>
<given-names><![CDATA[L]]></given-names>
</name>
<name>
<surname><![CDATA[Rodolfo]]></surname>
<given-names><![CDATA[M]]></given-names>
</name>
<name>
<surname><![CDATA[Nayga]]></surname>
<given-names><![CDATA[J]]></given-names>
</name>
</person-group>
<source><![CDATA[Consumers' Use of Nutritional Labels: A Review of Research Studies and Issues]]></source>
<year>2006</year>
<publisher-name><![CDATA[Academy of Marketing Science Review]]></publisher-name>
</nlm-citation>
</ref>
<ref id="B10">
<label>10</label><nlm-citation citation-type="journal">
<person-group person-group-type="author">
<name>
<surname><![CDATA[Cowburn]]></surname>
<given-names><![CDATA[G]]></given-names>
</name>
<name>
<surname><![CDATA[Stockley]]></surname>
<given-names><![CDATA[L]]></given-names>
</name>
</person-group>
<article-title xml:lang="en"><![CDATA[Consumer understanding and use of nutrition labelling: a systematic review]]></article-title>
<source><![CDATA[Public Health Nutr]]></source>
<year>2005</year>
<volume>8</volume>
<numero>1</numero>
<issue>1</issue>
<page-range>21-28</page-range></nlm-citation>
</ref>
<ref id="B11">
<label>11</label><nlm-citation citation-type="journal">
<person-group person-group-type="author">
<name>
<surname><![CDATA[Drichoutis]]></surname>
<given-names><![CDATA[AC]]></given-names>
</name>
<name>
<surname><![CDATA[Lazaridis]]></surname>
<given-names><![CDATA[P]]></given-names>
</name>
<name>
<surname><![CDATA[Nayga]]></surname>
<given-names><![CDATA[RM, Jr]]></given-names>
</name>
</person-group>
<article-title xml:lang="en"><![CDATA[An assessment of product class involvement in food purchasing behaviour]]></article-title>
<source><![CDATA[Eur J Mark]]></source>
<year>2007</year>
<volume>41</volume>
<numero>7/8</numero>
<issue>7/8</issue>
<page-range>888-914</page-range></nlm-citation>
</ref>
<ref id="B12">
<label>12</label><nlm-citation citation-type="journal">
<person-group person-group-type="author">
<name>
<surname><![CDATA[Fitzgerald]]></surname>
<given-names><![CDATA[N]]></given-names>
</name>
<name>
<surname><![CDATA[Damio]]></surname>
<given-names><![CDATA[G]]></given-names>
</name>
<name>
<surname><![CDATA[Segura-Perez]]></surname>
<given-names><![CDATA[S]]></given-names>
</name>
<name>
<surname><![CDATA[Perez-Escamilla]]></surname>
<given-names><![CDATA[R]]></given-names>
</name>
</person-group>
<article-title xml:lang="en"><![CDATA[Nutrition knowledge, food label use, and food intake patterns among Latinas with and without type 2 diabetes]]></article-title>
<source><![CDATA[J Am Diet Assoc]]></source>
<year>2008</year>
<volume>108</volume>
<numero>6</numero>
<issue>6</issue>
<page-range>960-967</page-range></nlm-citation>
</ref>
<ref id="B13">
<label>13</label><nlm-citation citation-type="journal">
<person-group person-group-type="author">
<name>
<surname><![CDATA[Boden]]></surname>
<given-names><![CDATA[M]]></given-names>
</name>
<name>
<surname><![CDATA[Dadswell]]></surname>
<given-names><![CDATA[R]]></given-names>
</name>
<name>
<surname><![CDATA[Hattersley]]></surname>
<given-names><![CDATA[S]]></given-names>
</name>
</person-group>
<article-title xml:lang="en"><![CDATA[Review of statutory and voluntary labelling of food allergens]]></article-title>
<source><![CDATA[Proc Nutr Soc]]></source>
<year>2005</year>
<volume>64</volume>
<numero>4</numero>
<issue>4</issue>
<page-range>475-480</page-range></nlm-citation>
</ref>
<ref id="B14">
<label>14</label><nlm-citation citation-type="journal">
<person-group person-group-type="author">
<name>
<surname><![CDATA[Hearty]]></surname>
<given-names><![CDATA[AP]]></given-names>
</name>
<name>
<surname><![CDATA[McCarthy]]></surname>
<given-names><![CDATA[SN]]></given-names>
</name>
<name>
<surname><![CDATA[Kearney]]></surname>
<given-names><![CDATA[JM]]></given-names>
</name>
<name>
<surname><![CDATA[Gibney]]></surname>
<given-names><![CDATA[MJ]]></given-names>
</name>
</person-group>
<article-title xml:lang="en"><![CDATA[Relationship between attitudes towards healthy eating and dietary behaviour, lifestyle and demographic factors in a representative sample of Irish adults]]></article-title>
<source><![CDATA[Appetite]]></source>
<year>2007</year>
<volume>48</volume>
<numero>1</numero>
<issue>1</issue>
<page-range>1-11</page-range></nlm-citation>
</ref>
<ref id="B15">
<label>15</label><nlm-citation citation-type="journal">
<person-group person-group-type="author">
<name>
<surname><![CDATA[Grunert]]></surname>
<given-names><![CDATA[K]]></given-names>
</name>
<name>
<surname><![CDATA[Wills]]></surname>
<given-names><![CDATA[J]]></given-names>
</name>
</person-group>
<article-title xml:lang="en"><![CDATA[A review of European research on consumer response to nutrition information on food labels]]></article-title>
<source><![CDATA[J Public Health]]></source>
<year>2007</year>
<volume>15</volume>
<numero>5</numero>
<issue>5</issue>
<page-range>385-399</page-range></nlm-citation>
</ref>
<ref id="B16">
<label>16</label><nlm-citation citation-type="journal">
<person-group person-group-type="author">
<name>
<surname><![CDATA[Gorton]]></surname>
<given-names><![CDATA[D]]></given-names>
</name>
<name>
<surname><![CDATA[Ni Mhurchu]]></surname>
<given-names><![CDATA[C]]></given-names>
</name>
<name>
<surname><![CDATA[Chen]]></surname>
<given-names><![CDATA[MH]]></given-names>
</name>
<name>
<surname><![CDATA[Dixon]]></surname>
<given-names><![CDATA[R]]></given-names>
</name>
</person-group>
<article-title xml:lang="en"><![CDATA[Nutrition labels: a survey of use, understanding and preferences among ethnically diverse shoppers in New Zealand]]></article-title>
<source><![CDATA[Public Health Nutr]]></source>
<year>2009</year>
<volume>12</volume>
<numero>9</numero>
<issue>9</issue>
<page-range>1359-1365</page-range></nlm-citation>
</ref>
<ref id="B17">
<label>17</label><nlm-citation citation-type="journal">
<person-group person-group-type="author">
<name>
<surname><![CDATA[Krukowski]]></surname>
<given-names><![CDATA[RA]]></given-names>
</name>
<name>
<surname><![CDATA[Harvey-Berino]]></surname>
<given-names><![CDATA[J]]></given-names>
</name>
<name>
<surname><![CDATA[Kolodinsky]]></surname>
<given-names><![CDATA[J]]></given-names>
</name>
<name>
<surname><![CDATA[Narsana]]></surname>
<given-names><![CDATA[RT]]></given-names>
</name>
<name>
<surname><![CDATA[Desisto]]></surname>
<given-names><![CDATA[TP]]></given-names>
</name>
</person-group>
<article-title xml:lang="en"><![CDATA[Consumers may not use or understand calorie labeling in restaurants]]></article-title>
<source><![CDATA[J Am Diet Assoc]]></source>
<year>2006</year>
<volume>106</volume>
<numero>6</numero>
<issue>6</issue>
<page-range>917-920</page-range></nlm-citation>
</ref>
<ref id="B18">
<label>18</label><nlm-citation citation-type="">
<collab>International Food Information Council Foundation</collab>
<source><![CDATA[Food & Health Survey. Consumer Attitudes Toward Food Safety, Nutrition, & Health]]></source>
<year>2010</year>
</nlm-citation>
</ref>
<ref id="B19">
<label>19</label><nlm-citation citation-type="journal">
<person-group person-group-type="author">
<name>
<surname><![CDATA[Mannell]]></surname>
<given-names><![CDATA[A]]></given-names>
</name>
<name>
<surname><![CDATA[Brevard]]></surname>
<given-names><![CDATA[P]]></given-names>
</name>
<name>
<surname><![CDATA[Nayga]]></surname>
<given-names><![CDATA[P]]></given-names>
</name>
<name>
<surname><![CDATA[Combris]]></surname>
<given-names><![CDATA[P]]></given-names>
</name>
<name>
<surname><![CDATA[Lee]]></surname>
<given-names><![CDATA[R]]></given-names>
</name>
<name>
<surname><![CDATA[Gloeckner]]></surname>
<given-names><![CDATA[J]]></given-names>
</name>
</person-group>
<article-title xml:lang="en"><![CDATA[French consumers' use of nutrition labels]]></article-title>
<source><![CDATA[Nutrition & Food Science]]></source>
<year>2006</year>
<volume>36</volume>
<page-range>159-168</page-range></nlm-citation>
</ref>
<ref id="B20">
<label>20</label><nlm-citation citation-type="journal">
<person-group person-group-type="author">
<name>
<surname><![CDATA[Byrd-Bredbenner]]></surname>
<given-names><![CDATA[C]]></given-names>
</name>
<name>
<surname><![CDATA[Alfieri]]></surname>
<given-names><![CDATA[L]]></given-names>
</name>
<name>
<surname><![CDATA[Kiefer]]></surname>
<given-names><![CDATA[L]]></given-names>
</name>
</person-group>
<article-title xml:lang="en"><![CDATA[The nutrition label knowledge and usage behaviours of women in the US]]></article-title>
<source><![CDATA[Nutr Bull]]></source>
<year>2000</year>
<volume>25</volume>
<page-range>315-322</page-range></nlm-citation>
</ref>
<ref id="B21">
<label>21</label><nlm-citation citation-type="journal">
<person-group person-group-type="author">
<name>
<surname><![CDATA[Petersen]]></surname>
<given-names><![CDATA[T]]></given-names>
</name>
</person-group>
<article-title xml:lang="en"><![CDATA[A Comment on Presenting Results from Logit and Probit Models]]></article-title>
<source><![CDATA[American Sociological Review]]></source>
<year>1985</year>
<numero>1</numero>
<issue>1</issue>
<page-range>130-131</page-range></nlm-citation>
</ref>
<ref id="B22">
<label>22</label><nlm-citation citation-type="journal">
<person-group person-group-type="author">
<name>
<surname><![CDATA[Zelner]]></surname>
<given-names><![CDATA[BA]]></given-names>
</name>
</person-group>
<article-title xml:lang="en"><![CDATA[Using simulation to interpret results from logit, probit, and other nonlinear models]]></article-title>
<source><![CDATA[Strategic Management Journal]]></source>
<year>2009</year>
<volume>30</volume>
<page-range>1335-1348</page-range></nlm-citation>
</ref>
<ref id="B23">
<label>23</label><nlm-citation citation-type="journal">
<person-group person-group-type="author">
<name>
<surname><![CDATA[Williams]]></surname>
<given-names><![CDATA[P]]></given-names>
</name>
</person-group>
<article-title xml:lang="en"><![CDATA[Consumer understanding and use of health claims for foods]]></article-title>
<source><![CDATA[Nutr Rev]]></source>
<year>2005</year>
<volume>63</volume>
<numero>7</numero>
<issue>7</issue>
<page-range>256-264</page-range></nlm-citation>
</ref>
<ref id="B24">
<label>24</label><nlm-citation citation-type="book">
<collab>Instituto Nacional de Estadística y Geografía (México)</collab>
<source><![CDATA[México de un vistazo 2009/Instituto Nacional de Estadística y Geografía.-México]]></source>
<year>2009</year>
<month>Ja</month>
<day>nu</day>
<publisher-name><![CDATA[INEGI]]></publisher-name>
</nlm-citation>
</ref>
</ref-list>
</back>
</article>
