Distribuciones mezcladas en el análisis de frecuencias de flujos mínimos
C.A. Escalante–Sandoval
División de Ingenierías Civil y Geomática. Facultad de Ingeniería, UNAM. México. E–mail: caes@servidor.unam.mx
Recibido: septiembre de 2007
Aceptado: mayo de 2008
Abstract
Low–flow characteristics are required to solve several water–engineering problems. In this paper, the Mixed Gumbel and the Two Component Extreme Value distributions are presented toward their applications in low–flow frequency analysis. A region in southern Mexico, with 39 gauging stations was selected to analyze the lowest 1 day flows. Additionally, in order to calculate the stream design flow ( 7Q10) for water quality standards down stream of the Hydroelectric project La Parota, the lowest 7 day average flows were used. Results produced by fitting the mixed distribution were compared with those obtained by the Weibull–3, Gumbel, Lognormal–3 and General Extreme Value distributions. Results suggest that mixed distributions are a suitable option to be considered when analyzing minimum flows.
Keywords: Minimum flow frequency analysis, maximum likelihood, heterogeneoussamples, waterquality.
Resumen
En muchos de los problemas de ingeniería del agua se requiere conocer las características de los flujos mínimos. En el artículo se presenta la aplicación de las distribuciones Gumbel Mixta y de Valores Extremos de Dos Componentes en el análisis de frecuencias de gastos mínimos. Una región localizada en el sureste de México, con un total de 39 estaciones de aforos, fue seleccionada para analizar los gastos mínimos anuales con duración de un día. Adicionalmente se utilizaron los gastos mínimos anuales promedio de siete días consecutivos con el fin de obtener el gasto de diseño (7Q10) para cumplir con los estándares de calidad hídrica aguas abajo del proyecto hidroeléctrico La Parota. Los eventos estimados por las distribuciones mezcladas fueron comparados con aquellos obtenidos por las distribuciones Weibull–3, Gumbel, Lognormal–3 y General de Valores Extremos. Los resultados sugieren que las distribuciones mezcladas son una opción adecuada a ser considerada en el análisis de flujos mínimos.
Desciptores: Análisis de frecuencias de flujos mínimos, máxima verosimilitud, muestras heterogéneas, calidad del agua.
Introduction
]]> Low–flow is the flow of water in a stream during prolonged dry weather. By contrast, a drought is a natural event that results from an extended period of below average precipitation. While droughts include low–flows, a continuous seasonal low–flow event is not necessarily a drought. A summary about the status of low–flow hydrology can be found in Smakhtin (2001) and Pyrce (2004).Quantiles of annual low–flow are commonly used as design flows on which to base the design of structures such as wastewater–treatment plants or for describing the capability of a stream to supply requirements for the regulation of fluvial transport, water supply, hydropower, liquid waste disposal, irrigation systems, or assessing the impact of prolonged droughts on aquatic ecosystems.
For instance, when assessing the suitable conditions for aquatic life, a hydrologically–based design flow (EPA, 2006) is computed using the single lowest flow event from each year of record and then examining these flows for a series of years. When a sufficiently long discharge record is available at a river site, low–flow statistics, such as the lowest 7 day average flow that occurs on average once every 10 years (7Q10), can be obtained through the use of probability distributions. By contrast, the biologically–based design flows (EPA, 2006) use durations and frequencies specified in water quality criteria for individual pollutants and whole effluents; they can be based on the available biological, ecological and toxicological information concerning the stresses that aquatic organisms, ecosystems, and their uses can tolerate.
This method is empirical, not statistical, because it deals with the actual flow record itself, not with a statistical distribution intended to describe the flow record. The biologically–based definition also recognizes that drought imposes severe stress on aquatic organisms, whet her pollutants a represent or not.
Low–flows typically aggravate the effects of water pollution. During a low flow event, there is less water available to dilute effluent loadings, resulting in higher in–stream concentration of pollutants. Aquatic life criteria are expressed in terms of the intensity of concentration, duration of averaging period, and average frequency of allowed excursions, which are defined as any flow lower than the design flow. Two concentrations, a continuous (CC) and a maximum (MC) are used to protect aquatic life from chronic and acute effects, respectively. From a hydrological point of view, EPA (2006) recommends the use of the 1Q10 flow as the design flow for the MC and the 7Q10 as the design flow for the CC.
Extensive literature is available on the application of probability distributions for prediction of flood frequencies, while the number of studies reported on frequency of low flow is rather limited. The modest interest in finding the most appropriate distribution of low flow is due to the relatively short return periods used in low flow design (less than 50 years).
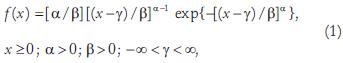
Gumbel (1958) discussed the use of the 3–parameter Weibull distribution (W3) for fitting low flows:
where α, β and γ are the shape, scale and location parameters.
The Gumbel distribution (EV1) is commonly used for low flow frequency analysis (Al–Mashidani et al., 1980):
]]>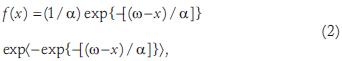
where ω and α are the location and scale parameters.
This distribution is not bounded in the lower or upper tail. The smallest values of the EV1 distribution have a high probability of negative values.
Chow (1964) provided a theoretical justification for the use of the 3–parameter Lognormal distribution (LN3) in low flow analysis:

where xo, µy and σy are the location, scale and shape parameters. This distribution is not bounded in the lower or upper tail.
Kroll and Vogel (2002) used L–moments diagrams to examine 1505 gauged river sites in the United States, and recommended the LN3 distribution for describing low streamflow statistics at no intermittent (perennial) sites.
The General Extreme Value distribution (GEV) has been widely used in flood frequency and less in low–flow frequency analysis (Raynal, 1987):
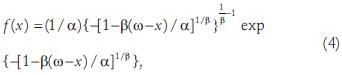
If β<0 then –∞<x <ω–α/β and if β>0 then ω–α/β<x < ∞.
]]> whereα, β and ω are the scale, shape and location parameters.Onoz and Bayazit (1999) examined the fit of various probability distributions to low flows at European rivers, and recommended the GEV distribution.
Pearson (1995) analyzed 1 day annual minimum stream flows at over 500 river sites in New Zealand, concluding that no single 2– or 3–parameter distribution provided a superior fit. Same conclusions were reported by Kroll and Vogel (2002). In order to achieve more flexibility in modeling low flows, two mixed distributions with four and five parameters are proposed in this paper.
Mixed distributions
The use of a mixture of probability distributions functions for modeling samples of data coming from two populations has been proposed long time ago (Mood et al., 1974):

where p is the proportion of x in the mixture (0 < p < 1), and F(x) is said to be a mixture of distributions.
Annual low flows are attributed to a continued de pletion of basin water storage until the minimum level of discharge is attained.
The annual low flows of some rivers are related entirely to one process leading to water depletion (e.g. evaporation). In other basins, it may becaused by one process in some years, and anot her process in others (e.g. falllow flow due to evaporative loss, combined with spring low due to continental drainage without water replenishment from rain) (Waylen and Woo, 1987).
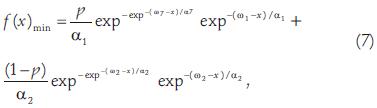
]]> The events from each process form two separate annual minimum subpopulations can be combined to follow a distribution that reflects both sub–samples.If the EV1 distribution is used in equation 5, the mixed Gumbel distribution (EV1MIX) for the minima is

where ω1, α1 and ω2, α2 are the location and scale parameters for the first and second population.
The corresponding density function is
Parameters can be computed by the maximum likelihood procedure:
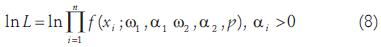
where L is called the likelihood function and ln is the natural logarithm.
Given the complexity of the resulting likelihood function and the partial de rivatives with respect to the parameters, the constrained multivariable Rosenbrock method (Kuester and Mize, 1973) was applied to obtain the estimators of the five parameters by the direct maximization of equation (8).
]]> The Two Component Extreme Value distribution for the minima (TCEVMIN) is obtained by using the version for the maxima (Rossi et al., 1984) and the symmetry principle, Gumbel (1958):
and
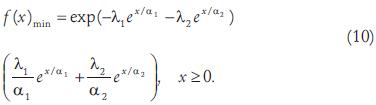
The parameters of the TCEVMIN distribution can be es ti ma ted from site–specific data set by the direct maximization of equation (11) by using the Rosenbrock method.

A region located in southern Mexico with 39 gauging stations was selected to apply the mixed distributions to lo west 1 day flows. For each station, mixed and standard distributions were fitted and the best one was chosen according to the criterion of minimum standard error of fit (SEF), as defined by Kite (1988):
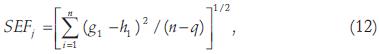
where gi; i = 1,..., n are the recorded events, hi; i = 1,..., n are the events computed from the probability distribution; q is the number of parameters for each distribution j, and n is the length of record.
]]> Table 1 shows the available lenght of record and catchments area for each station in the region. Equatios (1), (2), (3), (4), (8) and (11) were used in order to fit all samples in the region. The corresponding SEFj were computed and the best distribution was selected according to its minimum value (table 2).
In 2003, the Comisión Federal de Electricidad proposed the construction of La Parota Dam in the southern State of Guerrero, Mexico. The 180 m and 765–megawatt dam located in the Papagayo River watershed would flood close to 17,000 hectares of land. Communities around the site of the project reconcerned because of the expected changes to the river ecosystem downstream of the dam. Major losses in fisheries could occur all the way downstream of the dam until the river's delta at the Pacific Ocean.
In order to do an integral assessment of the environmental impact associated with the hydroelectric project, it is necessary to account with an estimate of the possible ecological flow of the river. According to the one of the aquatic life criteria proposed by the United States Environmental Protection Agency (EPA, 2006), the hydrologically–based design flow 7Q10 is obtained by using the lo west 7–day average flows computed through the gauged data at station La Parota (table 3). The EV1, GEV, W3, and mixed distributions were used to fit the sample. The corresponding SEFj and the design events for different return periods are shown in table 4. By considering the criterion of the minimum stan dard error of fit and from an hydrological point of view, the EV1MIX distribution was selected, and the low flow 7Q10 = 10.4 m3/s would be the minimum condition to maintain the water quality and the aquatic life downstream of the dam.
When a short record is used, there is an increased risk that the low–flow estimate will not provide adequate protection of designated uses. One way to reduce the bias or un certainty in the low–flow estimate is to use a regional data set with observations from several sites. Mixed distributions can be easily used to obtain regional at–site estimates of low–flow by using the station–year method (Cun na ne, 1988). For this purpose, there are two gauging stations ups tream of the station La Parota, called El Puente and Agua Salada, whose 7Q flows were used to obtain a regional at–site quantile of the 7Q10 flows. The best fit was achieved through the use of the EV1MIX distribution, and the low flow 7Q10 = 11.85 m3/s would be the minimum value of the discharge to maintain the conditions of water quality downstream of the dam.
Conclusions
In both applications the proposed mixed distributions behave very well. In the first case r sults shown that there exists a reduction in the standard error of fit when estimating the quantiles with mixed distributions (EV1MIX, 30% of cases and the TCEVMIN, 13%) in comparison with the GEV (49%), W3 (8%) and EV1(0%) distributions. In the se cond one, the best hydrological design event was obtained by using the EV1MIX distribution along with a regional technique (7Q10 = 11.85 m3/s). It is very important to mention that it was not the intention of this paper to propose the final ecological flow for the hydroelectric project, but only to show the hydrological application of mixed distribution in studies of water quality.
Results indicate that mixed distributions can be considered as an additional tool when performing low–flow frequency analysis.
References
]]>Al–Mashidani G., Lal B.B., Quadri I. Drought Flow Analysis of River Tigris in Baghdad. Hydrological Science Journal. 25(4):453–459. 1980. [ Links ]
Chow V. T. Handbook of Applied Hydrology. Mc. Graw–Hill. 1964. [ Links ]
Cunnane C. Methods and Merits of Regional Flood Frequency Analysis. Journal of Hydrology, 100:269–290. 1988. [ Links ]
EPA. Environmental Protection Agency. July, 2006 (on line). Available on: www.epa.gov [ Links ]
Gumbel E.J. Statistics of Extremes. Columbia University Press. New York. USA. 1958. [ Links ]
Kite G.W. Frequency and Risk Analyses in Hydrology. Water Resources Publications. USA. 1988. 257 p. [ Links ]
Kroll Ch., Vogel R. Probability Distribution of Low Stream Flow Series in the United States. Journal of Hydrologic Engineering, 7(2):137–146. 2002. [ Links ]
Kuester J.L., Mize J.H. Optimization Techniques with FORTRAN. McGraw–Hill Book Co. New York, 1973. Pp. 386–398. [ Links ]
Mood A. , Graybill F., Boes D. Introduction to the Theory of Statistics. McGraw–Hill. 1974. [ Links ]
Onoz B., Bayazit M. GEV–PWM Model for Distribution of Minimum Flows. Journal of Hydrologic Engineering, 4(3):289–292. 1999. [ Links ]
Pearson C.P. Regional Frequency Analysis of Low Flows in New Zealand Rivers. Journal of Hydrology, 30(2): 53–64. 1995. [ Links ]
Pyrce R.S. Hydrological Low Flows Indices and their Uses. WSC Report No. 04–2004. Watershed Science Centre. Peterborough. Ontario. 2004. 33 p. [ Links ]
Raynal J.A. Computation of Probability Weighted Moments Estimators for the Parameters of the General Extreme Value Distribution (Maxima and Minima). Hydrological Science and Technology, 3(1–4):47–52. 1987. [ Links ]
Rossi F., Fiorentino M., Versace P. Two Component Extreme Value Distribution for Flood Frequency Analysis. Water Resources Research, 20(7):847–856. 1984. [ Links ]
Smakhtin V. Low Flow Hydrology: a Review. Journal of Hydrology, 240(3–4):147–186. 2001. [ Links ]
Waylen P.R., Woo M. Annual Low Flows Generated by Mixed Processes. Hydrological Science Journal, 32(3):371–383. 1987. [ Links ]
About author
Carlos Agustín Escalante–Sandoval. Civil Engineer (BUAP, 1985), M in S with major in Water Resources (UNAM, 1988), Ph D with major in Hydraulics (UNAM, 1991). He was Head of Hydraulics Department up to 2007 and currently Head of Civil Engineering Graduated Department, both in the Faculty of Engineering at UNAM. He has been granted some academic and scientific prizes such as the Gabino Barreda Medal in 1991 by UNAM and the Prize for Research "Enzo Levi" in 2000 by the Mexican Association of Hydraulics. He has been member of the American Society of Civil Engineers, the American Water Resources Association, The American Geophysical Union, the New York Academy of Sciences, the Mexican Academy of Sciences, the Mexican Academy of Engineering and the National System of Researches.
]]>