nueva página del texto (beta)
 Inglés (pdf)
 Artículo en XML
 Referencias del artículo
 Enviar artículo por email
 Citado por SciELO
  Similares en
SciELO
Similares en
SciELO 
 Permalink
1. Introduction
The price of blue agave for the production of tequila in states with the Designation of Origin of Tequila (denominación de origen del tequila, DOT) in Mexico (Jalisco, Guanajuato, Michoacán, Nayarit, and Tamaulipas) has historically been subject to uncertainty for the rural producers who grow it.
Taking an approach based on academic and scientific documents and using statistical analysis, this research studies the dynamics of the agave market in DOT states in Mexico from 2000 to 2021 (two decades). It analyzes the problem as a result of the imbalance between supply (production) and demand, without losing sight of the hypothesis that the price is controlled by the leading tequila production companies (leaving aside the historical supply of agave). Special attention is paid to the evolution of production levels, tequila exports, and the record income generated by its commercialization.
Acosta Salazar et al. (2021) describes the severe problems suffered by the supply chain of the tequila production process as a result of the length of time the agave plant takes to reach maturity and be ready for use (six years). He points out that “the transition between scarcity and oversupply” has been a cyclical driver of falls or steep increases in its value. Meanwhile, Herrera Pérez et al. (2018) notes that the oligopoly of the large leading companies in the tequila sector (which produce 90% of DO tequila) intervene to determine their price (of agave) by operating with a vertical integration model that controls each of the links in its value chain. Firstly, by getting directly involved in the primary process of agave production (purchase or rental of large growing areas); secondly, by associating, or subcontracting, to rural producers; and finally, by working with small industry for the bulk production of tequila. This strategy relates to three aspects of the business:
It forms an obstacle to entry for new investors by monopolizing most of the raw material (agave) and the end consumer market for tequila.
It consolidates the effectiveness of the agave supply by anticipating periods of scarcity and excessive prices (attributed to the rural producer due to lack of planning).
It takes on a driving role in determining the price of agave (beyond supply and in balance with demand).
Victoria (n.d.), in her publication “Vertical Integration for Agribusiness”, concludes that the vertical integration of agricultural companies is a complex and costly process, restricting the successful implementation of this strategy to entities with significant financial capacity and with a prominent position in the final consumption market. However, she indicates that this strategy “reinforces” monopolistic practices due to price discrimination in each link of the value-added chain on the part of the dominant companies (“the opposite connotation, in which integration contributes to cost reduction”).
Minitab (n.d.) software is used to apply the Pearson Correlation analysis in order to identify and verify which variables determine the value of agave from an economic-commercial perspective. This study is complemented by a presentation and analysis of trends and forecasts for the next decade (2022-2031) using time series predictive methods.
This investigation concludes with the presentation of the results of the statistical, correlational, and predictive analysis of the quantitative information that describes the dynamics of the agave market over more than 20 years (2000-2021), identifying and providing a robust explanation for the causes of agave price uncertainty in DOT states in the past and forthcoming 10 years.
2. Methodology
This research is mixed sequential (qualitative and quantitative), with the results of one method being taken up to be used in the subsequent one (Creswell, 2009). According to Jiménez (1998) from the moment a problem or subject of study is identified and proposed, through to its solution or final argument, all research comprises three phases: exploratory, descriptive, and explanatory (“it being the researcher’s responsibility to identify their status and conclude the process satisfactorily for the investigation”). The information that this research analyzes and studies is provided by the SIAP (Agrifood and Fisheries Information System), CRT (Tequila Regulatory Council), INEGI (National Institute of Statistics and Geography), and others; all are official sources that provide reliable statistical information. It also makes use of academic and scientific documents that allow the context of the research to be presented.
1. Qualitative process. The approach to the research problem involves an inductive documentary process, investigating and analyzing the elements and the context of the case study, as well as its different perspectives (Creswell, 2009).
Exploratory Stage. This includes the analysis of the problem by examining academic and scientific documentation; their study gives rise to the hypothesis that underlies this research, namely, to answer the questions: Is uncertainty in the agave price the result of periods of scarcity and abundance? Or is the price of agave controlled by an oligopoly of the leading companies involved in the production and sale of tequila in Mexico?
2. Quantitative Process. This deductive process explains reality on the basis of sound theoretical frameworks, and various statistical analysis tools are applied to the numerical data to determine if the research hypothesis is verified or not (Hernández, Fernández and Baptista, 2014).
The analysis of quantitative information allows us to understand the dynamics and context of socioeconomic phenomena. In turn, processing with statistical tools identifies the different elements that are involved in the case study and presents forecasts for the medium and long term for the variables of interest to the research.
Descriptive Stage . The findings of the exploratory stage allow the presumed causal elements of the problem under study to be identified. In the descriptive stage, statistical information on the object of study and its context is analyzed “to present a clear and in-depth description of the problem” (Jiménez, 1998).
Explanatory Stage. In accordance with the sequential process of the exploratory and descriptive stages, the problem or object of study is fully identified (in response to the hypothesis and the research questions). At this stage of the investigation, the causeeffect relationship is justified and explained. Using statistical analysis tools, the dynamics of the indicators (productive and market) that intervene to determine the price of agave in DOT states are reviewed (their correlation is identified). The variables with the highest correlation are presented together with their prognosis (using predictive time series methods) to define their evolution over the next decade, and in turn, conclude by confirming or excluding the causal element(s) of the agave price problem for tequila production in Mexico.
This study uses two Minitab (n.d.) software-based statistical tools for information processing: Pearson’s Correlation Analysis and Time Series Predictive Methods.
Pearson’s Correlation analyzes the relationship between the variables that belong to the context of the agave market and that affect its price in one way or another (agave production, tequila production and export, and income from sale). “In Pearson’s correlation, the relationship coefficient can take a range of values from -1 to 1, where 0 indicates that there is no association between the variables” (Cohen, 1988). According to Pérez Porto and Gardey (2017) the correlation describes the proportionality and linear relationship between the variables and/or indicators under study, noting that “if the values of one variable change systematically with respect to the values of another, it can be said that the two variables are correlated” (that is, it measures the magnitude of changes that one variable exerts on another).
Rendón Trejo and Morales Alquitira (1993) observe that the Predictive Time Series Methods use statistical information of a variable “operating with data sets recorded in an ordered manner at fixed time intervals.” Its usefulness lies in identifying patterns that allow them to be understood, and in turn to make forecasts. Predictive time series methods are used to forecast the next 10 years of agave prices, and the market indicators with which these maintain a high level of correlation. These historical projection methods have four components: the trend, the seasonal component, the cyclical aspect, and a random element (Alonso & Ancila, 2013). This research presents the forecasts of the methods that produced the highest confidence levels: Exponential Smoothing (Simple and Double), Winters (Additive and Multiplicative Model).
Salazar López (2019a) describes the Simple Exponential Smoothing Method as “the evolution of the weighted average, which calculates the average of a self-correcting time series to adjust the forecasts by the correction affected by the smoothing coefficient.” He also describes the Double Exponential Smoothing Method (Salazar López, 2019b) as a “model of linear trends that evolve in a time series, used to generate forecasts of constant trend patterns, and which eliminates the impact of historical irregularities.” The Winters Method uses the components of level, trend, and seasonal fluctuation to make forecasts (use of quantitative information from its origin to generate forecasts); this method “uses three weights or parameters to update the components for each period. The initial values for the level and trend components are obtained from a linear regression. Initial values for the seasonal component are obtained from an indicator variable regression using detrended data” (Minitab, n.d.), applying two models: Additive and Multiplicative.
The predictive precision and selection of the model will depend on the error indicators that arise from the lowest value (statistical measures) used to estimate the performance and reliability of the MAPE model as the decisive indicator because it is expressed in terms of generic percentage (Mejía Vásquez & González Chávez, 2019).
MAPE. “The mean absolute percent error (MAPE) expresses accuracy as a percentage of the error. Because the MAPE is a percentage, it can be easier to understand than the other accuracy measurement statistics. For example, if the MAPE is 5, on average, the forecast is off by 5%. If a single model does not have the lowest values for all 3 accuracy measures, MAPE is usually the preferred measurement” (Minitab, n.d.).
The sequential process that is followed in this research using qualitative-quantitative research methods, predictive tools, and statistical analysis allowed us to verify the hypothesis that the value of agave in the DOT states (leaving aside the imbalance in the supply attributed to rural producers) is controlled by the oligopoly of leading tequila production companies in Mexico.
3. Results
3.1 Agave production in DOT states in Mexico
The five states that have the Tequila Designation of Origin (DOT) in Mexico are: Jalisco, Michoacán, Nayarit, Guanajuato, and Tamaulipas (CRT, 2022). Historically, agave production in DOT states has been concentrated in the state of Jalisco, a situation that has gradually evolved over the last 21 years (SIAP, 2022b). For this reason, in this investigation, the particular analysis of the performance of the agave market for the production of tequila is presented in parallel (in 2000, Jalisco had 98% of the total area dedicated to this crop and contributed 99% of the production; by the year 2021 Jalisco had 58% of the surface area, producing 66% of the total blue agave destined for the production of tequila) (See Table 1).
Table 1 Comparative area-agave production. Jalisco vs States with DOT (2000-2021)
| Region | Agave Surface Area Hectares (ha) | |||||
|
Jalisco 5 DOT states |
2000 | 2010 | 2011 | 2021 | Dif Ha | Change % 20 Years |
| 3,964 | 7,550 | 10,694 | 10,755 | 6,791 | 271% | |
| 4,054 | 8,919 | 12,912 | 18,492 | 14,438 | 456% | |
|
Jalisco % Share |
98% | 85% | 83% | 58% | ||
| Region | Agave Production Tons | |||||
|
Jalisco 5 DOT states |
2000 | 2010 | 2011 | 2021 | Dif Tons. | Change % 20 Years |
| 457,387 | 702,309 | 1,092,547 | 959,227 | 501,840 | 110% | |
| 462,112 | 810,084 | 1,284,899 | 1,445,991 | 983,879 | 213% | |
|
Jalisco % Share |
99% | 87% | 85% | 66% | ||
Source: Prepared by author with information from the SIAP (2022a).
In the period from 2000 to 2021, the average price per ton of agave in Jalisco and the five DOT states observed its highest starting point in 2001/2002 and its highest end point in 2020 (coincidentally at the beginning and end of the study period of this research) (see Figure 1); its evolution over the 21 years of the study has the appearance of a “valley” that may be beginning again in 2021 (analysis of the behavior of the agave price indicates: from 2002 to 2006 the greatest systematic drop in its value, from 2006 to 2013 its lowest level in two decades, and from 2013 to 2020 a constant year-on-year increase at record levels until a new drop is observed in 2021) (see Table 2).
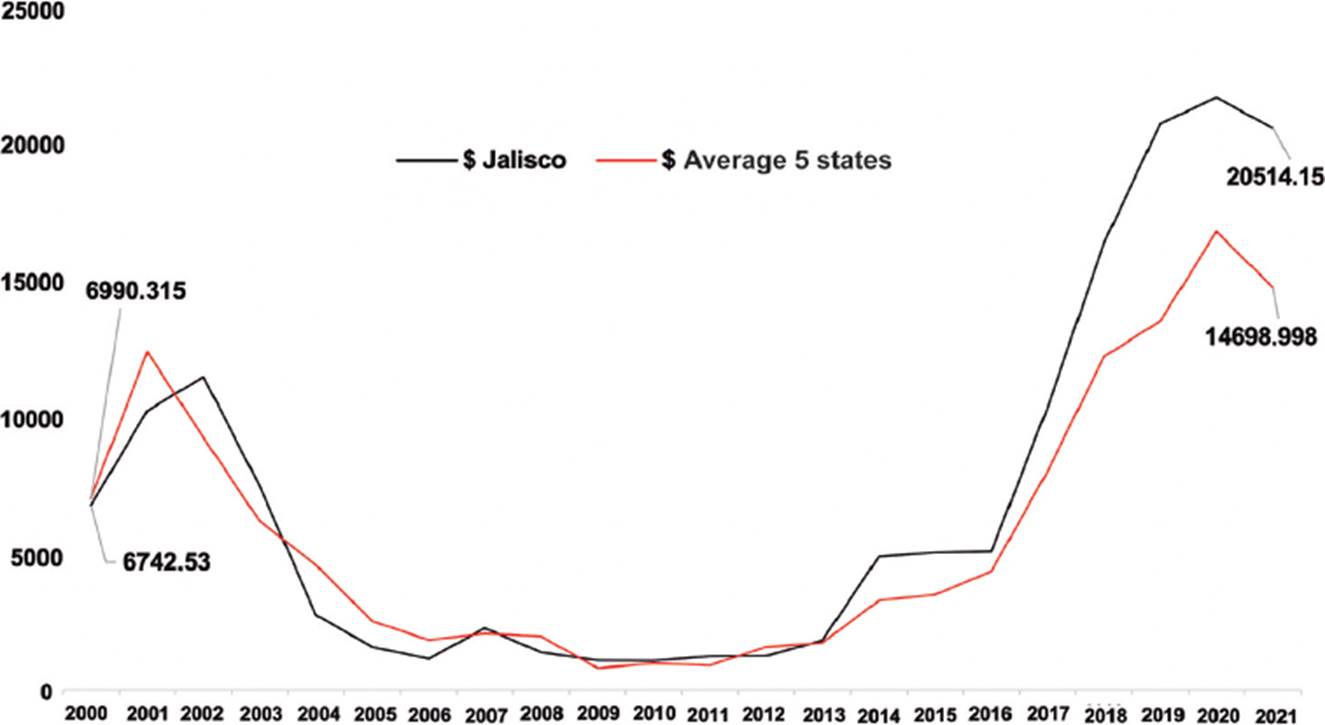
Source: Prepared by author with information from the SIAP (2022a).
Figure 1 Evolution of the price of agave Jalisco vs. States with DOT (thousands of Mexican pesos, 2000-2021)
Table 2 Historical comparison of agave price dynamics. Jalisco vs States with DOT (2000-2021)
| Agave Increase Price / vs Previous Year | Jalisco | Agave Increase Price/Ton vs Previous Year | Aver age 5 states | ||||||||||||||
| 2000 | $ | 6,743 | n/a | n/a | 2000 | $ | 6,990 | n/a | n/a | ||||||||
| 2001 | $ | 10,198 | $ | 3,455 | 51.24% | Average Increase -6.80% | 2001 | $ | 12,340 | $ | 5,350 | 76.54% | Average Increase -10.94% | ||||
| 2002 | $ | 11,432 | $ | 1,235 | 12.11% | 2002 | $ | 9,216 | $ | -3,124 | -25.32% | ||||||
| 2003 | $ | 7,458 | $ | -3,974 | -34.76% | 2003 | $ | 6,179 | $ | -3,037 | -32.95% | ||||||
| 2004 | $ | 2,747 | $ | -4,711 | -63.17% | 2004 | $ | 4,574 | $ | -1,605 | -25.97% | ||||||
| 2005 | $ | 1,581 | $ | -1,166 | -42.43% | 2005 | $ | 2,513 | $ | -2,061 | -45.05% | ||||||
| 2006 | $ | 1,156 | $ | -426 | -26.93% | 2006 | $ | 1,838 | $ | -675 | -26.87% | ||||||
| 2007 | $ | 2,275 | $ | 1,119 | 96.83% | 2007 | $ | 2,078 | $ | 240 | 13.04% | ||||||
| -30% | 2008 | $ | 1,389 | $ | -885 | -38.93% | -32% | 2008 | $ | 1,966 | $ | -112 | -5.40% | ||||
| 2009 | $ | 1,094 | $ | -295 | -21.23% | 2009 | $ | 823 | $ | -1,143 | -58.15% | ||||||
| 2010 | $ | 1,086 | $ | -8 | -0.72% | 2010 | $ | 993 | $ | 170 | 20.69% | ||||||
| 2011 | $ | 1,240 | $ | 153 | 14.13% | Average Increase 46.32% | Average Increase 38.19% | 2011 | $ | 913 | $ | -80 | -8.05% | Average Increase 34.13% | Average Increase 32.19% | ||
| 2012 | $ | 1,252 | $ | 12 | 0.97% | 2012 | $ | 1,583 | $ | 670 | 73.41% | ||||||
| 2013 | $ | 1,823 | $ | 571 | 45.60% | 2013 | $ | 1,731 | $ | 148 | 9.33% | ||||||
| 2014 | $ | 4,881 | $ | 3,059 | 167.81% | 2014 | $ | 3,279 | $ | 1,549 | 89.47% | ||||||
| 2015 | $ | 5,031 | $ | 150 | 3.07% | 2015 | $ | 3,492 | $ | 212 | 6.47% | ||||||
| 2016 | $ | 5,076 | $ | 45 | 0.89% | Average Increase 31.42% | 2016 | $ | 4,348 | $ | 857 | 24.54% | Average Increase 30.57% | ||||
| 2017 | $ | 10,330 | $ | 5,254 | 103.52% | 2017 | $ | 7,999 | $ | 3,650 | 83.95% | ||||||
| 2018 | $ | 16,320 | $ | 5,990 | 57.98% | 2018 | $ | 12,182 | $ | 4,183 | 52.30% | ||||||
| 2019 | $ | 20,670 | $ | 4,350 | 26.66% | 2019 | $ | 13,463 | $ | 1,281 | 10.51% | ||||||
| -0,26% | 2020 | $ | 21,614 | $ | 944 | 4.57% | 6.06% | 2020 | $ | 16,722 | $ | 3,259 | 24.21% | ||||
| -5.09% | -12.10% | ||||||||||||||||
Source: Prepared by author with information from Government of Mexico, SIAP (2022a); INEGI, Consejo Agropecuario de Jalisco (2019); La exportación de… (2022); Morales (2022); and Government of Jalisco, IIEG (2020).
When analyzing the historical information on the price of agave, both for the state of Jalisco and jointly for the five DOT states (average), it turns out that from 2000 to 2010, the average annual price increase was -6.8% in Jalisco versus the average of the five DOT states with -10.94%; for the decade from 2011 to 2021, the highest average annual increase was for the state of Jalisco with 38.19% versus the average of the five DOT states with 32.19%. In both cases, the analysis shows that the highest level of profitability was for Jalisco; however, when analyzing the five years in the last decade (2016-2021) the end of the cycle of positive price growth is verified (for the last decade and the over 20 years under study): From 2011 to 2015, the average annual price increase in Jalisco was 46%, and for the five DOT states it was 34%; from 2016 to 2021, the average annual increase drops to 31% for Jalisco and 30% for the five DOT states.
3.2 The Tequila Industry in Mexico
According to the Consejo Regulador del Tequila (Tequila Regulatory Council) (2022) over the past 21 years tequila production increased by 345 million liters (190% since 2000); when comparing the year-on-year increase in total production of tequila, the average annual increase from 2000 to 2010 was 4.69%, versus 7.54% for the 2011 to 2021 period. Notably, in the last five years of this decade (2016 to 2021) the average annual growth was the highest in the last 20 years (2000-2021), at 15.64% on average (see Table 3).
Table 3 Historical evolution of tequila production in DOT states (2000-2021)
|
Tequila
Production Millions of Liters |
Increase vs Previous Year
Millions of Liters |
Increase vs Previous Year
% |
|||
| 2000 | 181.6 | n/a | n/a | 4.69% | |
| 2001 | 146.6 | -35 | -19.27% | ||
| 2002 | 140.6 | -6 | -4.09% | ||
| 2003 | 140.3 | -0.3 | -0.21% | ||
| 2004 | 176 | 35.7 | 25.45% | ||
| 2005 | 209.7 | 33.7 | 19.15% | ||
| 2006 | 242.7 | 33 | 15.74% | ||
| 2007 | 284.1 | 41.4 | 17.06% | ||
| 2008 | 312.1 | 28 | 9.86% | ||
| 2009 | 249 | -63.1 | -20.22% | ||
| 2010 | 257.5 | 8.5 | 3.41% | ||
| 2011 | 261.1 | 3.6 | 1.40% | -2.18% | 7.54% |
| 2012 | 253.2 | -7.9 | -3.03% | ||
| 2013 | 226.5 | -26.7 | -10.55% | ||
| 2014 | 242.4 | 15.9 | 7.02% | ||
| 2015 | 228.5 | -13.9 | -5.73% | ||
| 2016 | 273.3 | 44.8 | 19.61% | 15.64% | |
| 2017 | 271.4 | -1.9 | -0.70% | ||
| 2018 | 309.1 | 37.7 | 13.89% | ||
| 2019 | 351.7 | 42.6 | 13.78% | ||
| 2020 | 374 | 22.3 | 6.34% | ||
| 40.91% | |||||
Source: Prepared by author with information from the CRT (2022).
Tequila exports saw their highest value at the end of 2021, at 3.3 billion dollars. The record increase for this indicator (average annual increase) was in the last decade from 2011 to 2021, at 14.98%; in the five most recent years (2016-2021) it was 19.23% while the average for the years 2020 and 2021 it stood at 33.07%; the foregoing contrasts with the results of the 2000-2010 decade, at just 6.10%. (The increase in the total value of tequila exports from 2000 to 2021 was 656%). In 21 years, tequila exports increased 244% (240.6 million liters) observing its highest average annual growth in the decade from 2011 to 2021 at 7.67%, versus 5.19% in the period from 2000 to 2010. The greatest increase occurred in the last five years (2016 to 2021), at 10.95% (see Table 4).
Table 4 Comparative evolution of the export volume of tequila from DOT states versus its value, 2000-2021
|
Tequila
Exports Millions of Liters |
Increase vs Previous Year Millions of Liters |
Increase vs Previous Year % |
Tequila Value of Exports |
Export Value Millions of Dollars |
Change in Price vs Previous Year | Change in Price vs Previous Year | ||||||||
| 2000 | 98.8 | n/a | n/a | 2000 | $ | 439 | n/a | n/a | ||||||
| 2001 | 75.6 | -23.2 | -23.48% | 5.19% | 2001 | $ | 403 | $ | -36 | -8.20% | Av Increase 6.10% | |||
| 2002 | 88 | 12.4 | 16.40% | 2002 | $ | 478 | $ | 75 | 18.61% | |||||
| 2003 | 101.6 | 13.6 | 15.45% | 2003 | $ | 517 | $ | 39 | 8.16% | |||||
| 2004 | 109.1 | 7.5 | 7.38% | 2004 | $ | 513 | $ | -4 | -0.77% | |||||
| 2005 | 117.1 | 8.0 | 7.33% | 2005 | $ | 544 | $ | 31 | 6.04% | |||||
| 2006 | 140.1 | 23.0 | 19.64% | 2006 | $ | 662 | $ | 118 | 21.69% | |||||
| 2007 | 135.1 | -5.0 | -3.57% | 2007 | $ | 726 | $ | 64 | 9.67% | |||||
| 2008 | 137.4 | 2.3 | 1.70% | 2008 | $ | 698 | $ | -28 | -3.86% | |||||
| 2009 | 136.4 | -1.0 | -0.73% | 2009 | $ | 617 | $ | -81 | -11.60% | |||||
| 2010 | 152.5 | 16.1 | 11.80% | 2010 | $ | 748 | $ | 131 | 21.23% | |||||
| 2011 | 163.9 | 11.4 | 7.48% | 3.74% | 7.67% | 2011 | $ | 831 | $ | 83 | 11.10% | 9.87% | Av Increase 14.98% | |
| 2012 | 166.7 | 2.8 | 1.71% | 2012 | $ | 859 | $ | 28 | 3.37% | |||||
| 2013 | 172 | 5.3 | 3.18% | 2013 | $ | 997 | $ | 138 | 16.07% | |||||
| 2014 | 172.5 | 0.5 | 0.29% | 2014 | $ | 1,172 | $ | 175 | 17.55% | |||||
| 2015 | 182.9 | 10.4 | 6.03% | 2015 | $ | 1,187 | $ | 15 | 1.28% | |||||
| 2016 | 197.9 | 15.0 | 8.20% | 10.95% | 2016 | $ | 1,203 | $ | 16 | 1.35% | 19.23% | |||
| 2017 | 213.3 | 15.4 | 7.78% | 2017 | $ | 1,340 | $ | 137 | 11.39% | |||||
| 2018 | 224.1 | 10.8 | 5.06% | 2018 | $ | 1,582 | $ | 242 | 18.06% | |||||
| 2019 | 246.7 | 22.6 | 10.08% | 2019 | $ | 1,874 | $ | 292 | 18.46% | |||||
| 2020 | 286.7 | 40.0 | 16.21% | 33.07% | 2020 | $ | 2,442 | $ | 568 | 30.31% | ||||
| 18.38% | 35.83% | |||||||||||||
Source: Prepared by author with information from the CRT (2022), INEGI y Consejo Agropecuario de Jalisco (2019), La exportación de… (2022); Morales (2022), and Government of Mexico, SIAP (2022a).
Despite the sustained increase in tequila production, exports, and record revenues, the price of agave saw an all-time high in 2020, while by 2021 it had its first significant drop in 10 years.
3.3 Pearson Statistical Correlation Analysis (Minitab Software)
The price of agave in Jalisco shows the highest level of correlation respectively with the value of tequila exports (.763), volume of tequila exports (.662), and tequila production (.533). It has no correlation with agave production (-0.055). In the five DOT states, the highest degree of correlation with agave prices is with the value of tequila exports (.654), followed by the volume of tequila exports (.524), and tequila production (.407). It also has no correlation with agave production (.001). We can conclude that the variables that affect the price of agave (both for Jalisco in particular and for the five DOT states as a whole) are: the volume of tequila production, tequila exports, and the resulting income (see Table 5).
Table 5 Comparison of Pearson’s Correlation Analysis. Agave price in Jalisco and agave price in DOT states versus Area of agave production, Agave production, Tequila production, Tequila exports, and Value of tequila exports, 2000-2021.
| Correlations Jalisco |
Tequila
Production M/L |
Tequila
Exports M/L |
Area Agave J |
Production Agave J |
Price Agave J |
| Exp Teq M/L | 0.910 | ||||
| Area Agave J | 0.525 | 0.629 | |||
| Production Agave J | 0.468 | 0.522 | 0.978 | ||
| Price Agave J | 0.533 | 0.662 | 0.079 | -0.055 | |
| Value Exports $MM | 0.897 | 0.970 | 0.504 | 0.393 | 0.763 |
| Correlations 5 States |
Tequila
Production M/L |
Tequila
Exports M/L |
Area Agave 5S |
Production Agave 5S |
Price Agave 5S |
| Exp Teq M/L | 0.910 | ||||
| Area Agave 5S | 0.663 | 0.801 | |||
| Production Agave 5S | 0.613 | 0.699 | 0.972 | ||
| Price Agave 5S | 0.407 | 0.524 | 0.168 | 0.001 | |
| Value Exports $MM | 0.897 | 0.970 | 0.692 | 0.576 | 0.654 |
Source: Prepared by the author with Minitab (n.d.) software.
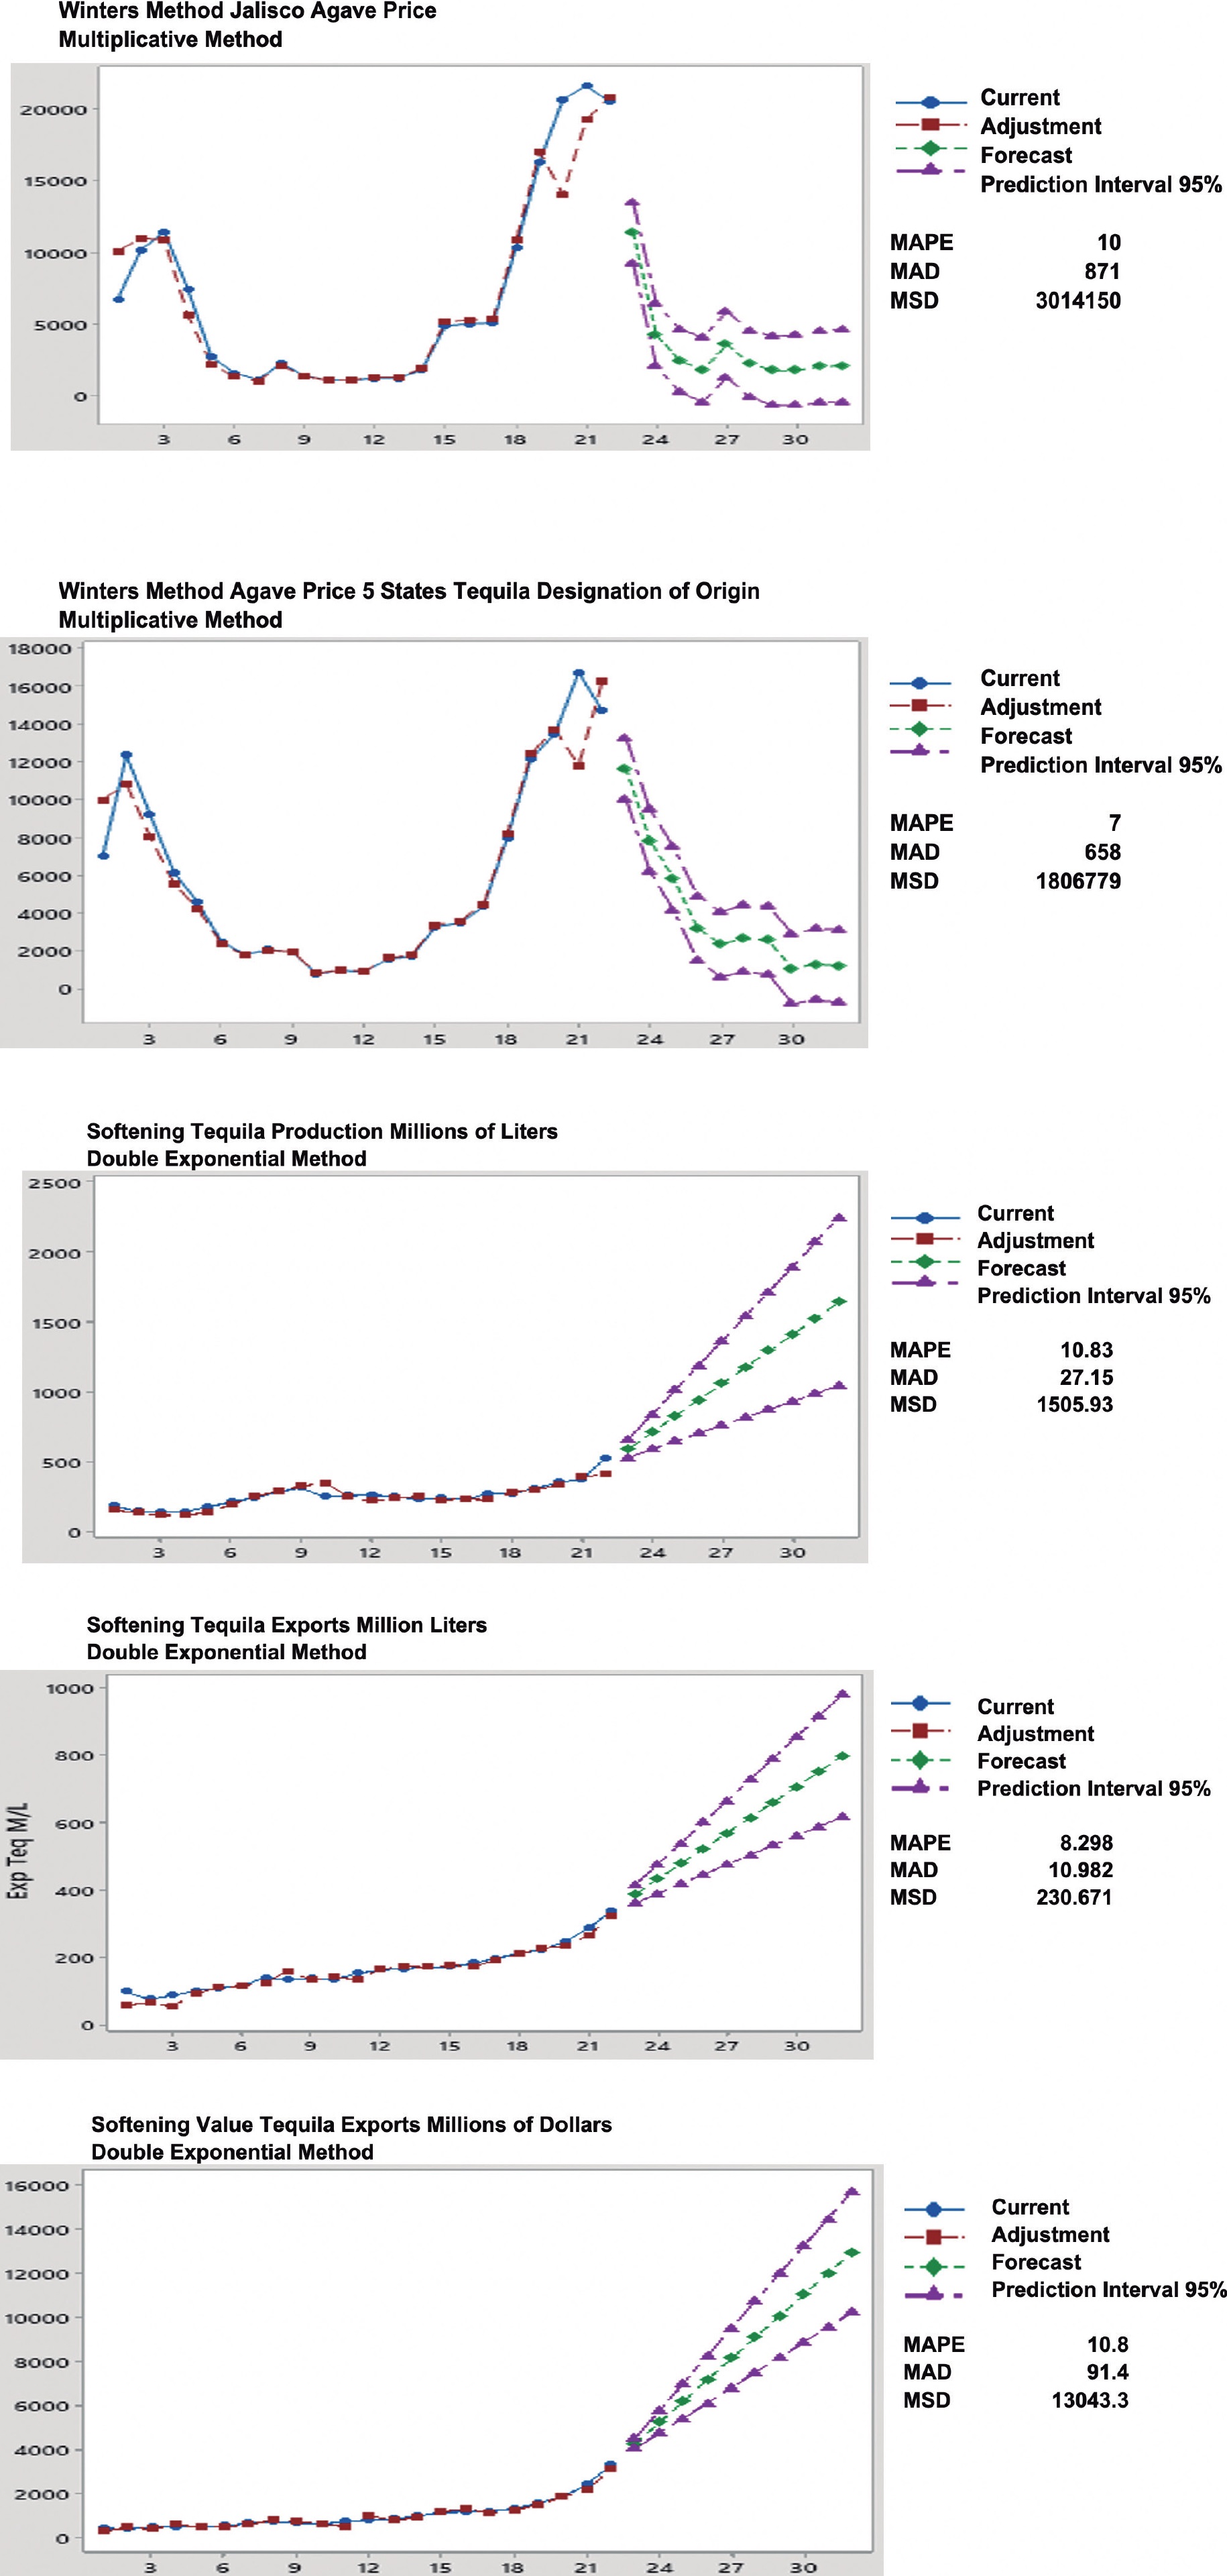
3.4 Forecast of the price of agave and of the variables correlated with its price dynamics (Minitab software)
Time series forecasting methods are applied to the historical data for: Price of agave in Jalisco, Price of agave in the five DOT states, Production of tequila, Exports of tequila, and the Value of exports of tequila.
The results of the time series forecasting methods that showed the greatest reliability are presented below (see Figure 2, Figure 3, Figure 4, Figure 5, and Figure 6).

Source: Prepared by the author with Minitab (n.d.) software.
Figure 2 Agave Price Forecast in Jalisco (thousands of pesos per ton). Winter’s Method, 2022-2031
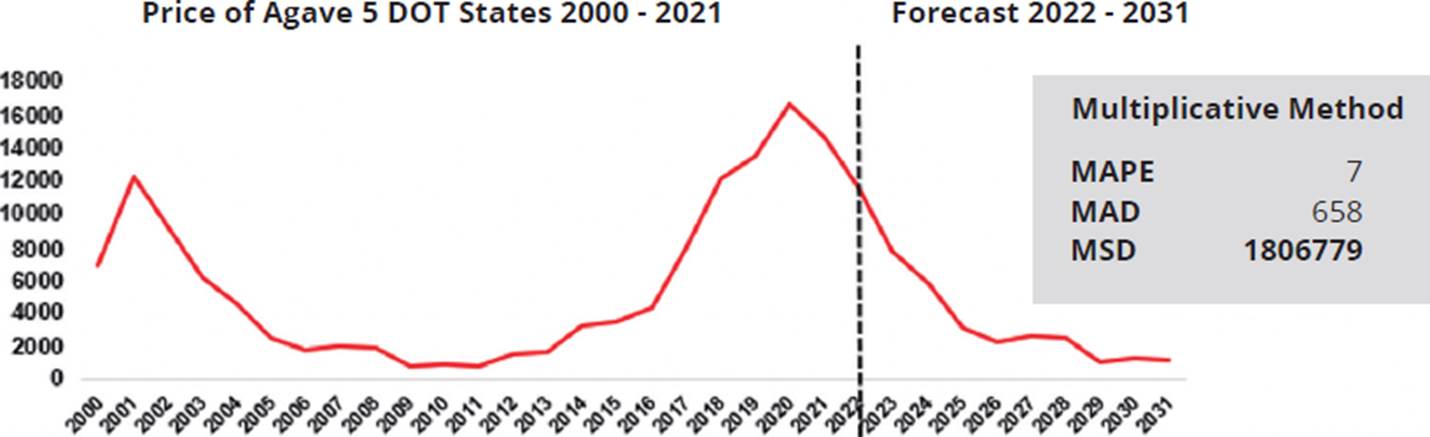
Source: Prepared by the author with Minitab (n.d.) software.
Figure 3 Agave Price Forecast in the DOT states (thousands of pesos per ton). Winter’s Method, 2022-2031

Source: Prepared by the author with Minitab (n.d.) software.
Figure 4 Tequila Production Forecast (millions of liters). Double Exponential Method, 2022-2031

Source: Prepared by the author with Minitab (n.d.) software.
Figure 5 Tequila Export Forecast (millions of liters). Double Exponential Method. 2022-2031

Source: Prepared by the author with Minitab (n.d.) software.
Figure 6 Tequila Export Value Forecast (millions of dollars). Double Exponential Method. 2022-2031
3.5 Comparison and analysis of the statistical evolution of each indicator and forecast for the next decade
In the decade from 2011 to 2021, all five indicators performed very well, in particular: the price of Jalisco agave, with an average annual increase of 38%; the five DOT states, with an increase of 32%; the production and export of tequila, at 8%; and for the total value of exports, at 15%.
The forecasts (2022 to 2031) indicate the following: negative growth in the average annual increase in the price of agave for Jalisco and the five DOT states (-12% and -18% respectively), in contrast, the value of exports of tequila increases 15% annually (the same as in the previous decade) and in the case of the production and export of tequila the average annual increase is 12% and 9% respectively (see Table 6).
Table 6 Comparison of the historical evolution and its forecast of the price of agave in Jalisco and the DOT states versus the Production of tequila, Volume of Exports of tequila, and Value of Exports of tequila, 2000-2031
| SIAP | SIAP | CRT | CRT | Various sources | ||||||||||
| Agave Price Jalisco (Tons) | % Change vs Previous Year | Agave Price DOT States (Tons) | % Change vs Previous Year | Prod Tequila (MIL) | % Change vs Previous Year | Exports Tequila (M/L) | % Change vs Previous Year | Exports Value Tequila ($MM) | % Change vs Previous Year | |||||
| 2000 | $ | 6,743 | n/a | $ | 6,990 | n/a | 181.60 | n/a | 98.80 | n/a | $ | 439 | n/a | |
| 2001 | $ | 10,198 | 51% | $ | 12,340 | 77% | 146.60 | -19% | 75.60 | -23% | $ | 403 | -8% | |
| 2002 | $ | 11,432 | 12% | $ | 9,216 | -25% | 140.60 | -4% | 88.00 | 16% | $ | 478 | 19% | |
| 2003 | $ | 7,458 | -35% | $ | 6,179 | -33% | 140.30 | 0% | 101.60 | 15% | $ | 517 | 8% | |
| 2004 | $ | 2,747 | -63% | $ | 4,574 | -26% | 176.00 | 25% | 109.10 | 7% | $ | 513 | -1% | |
| 2005 | $ | 1,581 | -42% | $ | 2,513 | -45% | 209.70 | 19% | 117.10 | 7% | $ | 544 | 6% | |
| 2006 | $ | 1,156 | -27% | $ | 1,838 | -27% | 242.70 | 16% | 140.10 | 20% | $ | 662 | 22% | |
| 2007 | $ | 2,275 | 97% | $ | 2,078 | 13% | 284.10 | 17% | 135.10 | -4% | $ | 726 | 10% | |
| 2008 | $ | 1,389 | -39% | $ | 1,966 | -5% | 312.10 | 10% | 137.40 | 2% | $ | 698 | -4% | |
| 2009 | $ | 1,094 | -21% | $ | 823 | -58% | 249.00 | -20% | 136.40 | -1% | $ | 617 | -12% | |
| 2010 | $ | 1,086 | -1% | $ | 993 | 21% | 257.50 | 3% | 152.50 | 12% | $ | 748 | 21% | |
| 2011 | $ | 1,240 | 14% | $ | 913 | -8% | 261.10 | 1% | 163.90 | 7% | $ | 831 | 11% | |
| 2012 | $ | 1,252 | 1% | $ | 1,583 | 73% | 253.20 | -3% | 166.70 | 2% | $ | 859 | 3% | |
| 2013 | $ | 1,823 | 46% | $ | 1,731 | 9% | 226.50 | -11% | 172.00 | 3% | $ | 997 | 16% | |
| 2014 | $ | 4,881 | 168% | $ | 3,279 | 89% | 242.40 | 7% | 172.50 | 0% | $ | 1.172 | 18% | |
| 2015 | $ | 5,031 | 3% | $ | 3,492 | 6% | 228.50 | -6% | 182.90 | 6% | $ | 1.187 | 1% | |
| 2016 | $ | 5,076 | 1% | $ | 4,348 | 25% | 273.30 | 20% | 197.90 | 8% | $ | 1.203 | 1% | |
| 2017 | $ | 10,330 | 104% | $ | 7,999 | 84% | 271.40 | -1% | 213.30 | 8% | $ | 1.340 | 11% | |
| 2018 | $ | 16,320 | 58% | $ | 12,182 | 52% | 309.10 | 14% | 224.10 | 5% | $ | 1.582 | 18% | |
| 2019 | $ | 20,670 | 27% | $ | 13,463 | 11% | 351.70 | 14% | 246.70 | 10% | $ | 1.874 | 18% | |
| 2020 | $ | 21,614 | 5% | $ | 16,722 | 24% | 374.00 | 6% | 286.70 | 16% | $ | 2.442 | 30% | |
| 2021 | $ | 20,514 | -5% | $ | 14,699 | -12% | 527.00 | 41% | 339.40 | 18% | $ | 3.317 | 36% | |
| Forecast 10 Periods | 2022 | $ | 11,414 | -44% | $ | 11,655 | -21% | 593.680 | 13% | 386.53 | 14% | $ | 4.283 | 29% |
| 2023 | $ | 4,234 | -63% | $ | 7,849 | -33% | 710.240 | 20% | 432.33 | 12% | $ | 5.250 | 23% | |
| 2024 | $ | 2,456 | -42% | $ | 5,839 | -26% | 826.800 | 16% | 478.14 | 11% | $ | 6.217 | 18% | |
| 2025 | $ | 1,811 | -26% | $ | 3,225 | -45% | 943.360 | 14% | 523.95 | 10% | $ | 7.184 | 16% | |
| 2026 | $ | 3,599 | 99% | $ | 2,373 | -26% | 1059.920 | 12% | 569.75 | 9% | $ | 8.151 | 13% | |
| 2027 | $ | 2,221 | -38% | $ | 2,699 | 14% | 1176.480 | 11% | 615.56 | 8% | $ | 9.118 | 12% | |
| 2028 | $ | 1,769 | -20% | $ | 2,570 | -5% | 1293.040 | 10% | 661.37 | 7% | $ | 10.085 | 11% | |
| 2029 | $ | 1,777 | 0% | $ | 1,083 | -58% | 1409.600 | 9% | 707.17 | 7% | $ | 11.052 | 10% | |
| 2030 | $ | 2,053 | 16% | $ | 1,317 | 22% | 1526.160 | 8% | 752.98 | 6% | $ | 12.019 | 9% | |
| 2031 | $ | 2,099 | 2% | $ | 1,220 | -7% | 1642.720 | 8% | 798.79 | 6% | $ | 12.986 | 8% | |
| Αν Increase 00 - 10 | -7% | -11% | 5% | 5% | 6% | |||||||||
| Αν Increase 11-21 | 38% | 32% | 8% | 8% | 15% | |||||||||
| Αν Increase 22 -31 | -12% | -18% | 12% | 9% | 15% | |||||||||
Source: Prepared by author with information from SIAP (2022a) and Minitab (n.d.).
4. Analysis of results
The Pearson Correlation analysis indicated that, for the study period, there is no relationship between agave production and price in the market with DOT (the coefficient in Jalisco was -.055, and in DOT states .001). By contrast, it showed a correlation with the production and export of tequila, including the amount of income from foreign trade. The blue agave production trend in DOT states was downward at the end of the last decade (2010-2021), with the negative average annual growth similarly affecting its price dynamics (similar trend for the next decade). This contrasts with the sustained positive growth seen in the last 10 years and underscores the forecast for the next 10 years for the production and export of tequila, and income from its sale.
4.1 Blue agave production
The downward trend in Jalisco and in DOT states has systematically shown a significant reduction in the average annual increase from the decade of 2000 to 2010 (from 14.42% and 12.81% respectively); from 2011 to 2021 the annual percentage increase for DOT states was 7.39%, and for Jalisco 5.55% (a 50% drop in this indicator). The fall in average annual growth has become more accentuated in the last five years (2016-2021), showing negative results for the first time in 21 years in this indicator: -.87% for the DOT states and -5.10% for Jalisco. These results clearly coincide with the fall in its price (and the trend) (see Table 7).
Table 7 Comparison of agave production in Jalisco versus DOT states, 2000-2021
|
Cumulative 5 DOT States
Agave Production |
Jalisco
Agave Production |
|||||||
| Tons | Tons | |||||||
| 2000 | 462,112 | n/a | 457,387 | n/a | ||||
| 2001 | 325,061 | -29.66% | 14.42% | 316,351 | -30.84% | 12.81% | ||
| 2002 | 222,182 | -31.65% | 221,682 | -29.93% | ||||
| 2003 | 430,639 | 93.82% | 430,054 | 94.00% | ||||
| 2004 | 838,781 | 94.78% | 810,461 | 88.46% | ||||
| 2005 | 922,311 | 9.96% | 882,357 | 8.87% | ||||
| 2006 | 984,146 | 6.70% | 949,356 | 7.59% | ||||
| 2007 | 1,254,295 | 27.45% | 1,141,095 | 20.20% | ||||
| 2008 | 1,472,874 | 17.43% | 1,272,074 | 11,48% | ||||
| 2009 | 802,704 | -45.50% | 659,708 | -48.14% | ||||
| 2010 | 810,084 | 0.92% | 702,309 | 6.46% | ||||
| 2011 | 1,284,899 | 58.61% | 17.29% | 7.39% | 1,092,547 | 55.56% | 18.34% | 5.55% |
| 2012 | 1,420,395 | 10.55% | 1,200,136 | 9.85% | ||||
| 2013 | 1,512,581 | 6.49% | 1,143,014 | -4.76% | ||||
| 2014 | 2,050,066 | 35.53% | 1,779,311 | 55.67% | ||||
| 2015 | 1,543,516 | -24.71% | 1,340,812 | -24.64% | ||||
| 2016 | 1,702,377 | 10.29% | -0.87% | 1,335,272 | -0.41% | -5.10% | ||
| 2017 | 1,565,656 | -8.03% | 1,132,611 | -15.18% | ||||
| 2018 | 1,526,897 | -2.48% | 1,096,946 | -3.15% | ||||
| 2019 | 1,519,775 | -0.47% | 1,130,438 | 3.05% | ||||
| 2020 | 1,578,918 | 3.89% | 1,146,833 | 1.45% | ||||
| -8.42% | -16.36% | |||||||
Source: Prepared by author with information from the SIAP (2022a).
4.2 Blue agave price
In 2020, agave reached its maximum price per ton in two decades (in Jalisco $21,614, and the average of the DOT states $16,722). The average annual increase from 2011 to 2021 was 38% for Jalisco and 32% for the DOT states (in the period from 2000 to 2010 it saw its worst performance, with an average annual drop of -7% and -11% respectively). The last five years (2016-2021) showed a reduction in the average annual increase: 31% for Jalisco and 30% for the five DOT states, which for the first time in 10 years saw 2021 close with a significant drop: -5% and -12% respectively compared to the previous year (2020). According to the results of the time series forecasts applied using Minitab software, this negative downward trend in the average annual increase will be maintained for the next decade (2022-2032): -12% for Jalisco and -18% for the five DOT states.
4.3 Production and Export of Tequila, Income from Foreign Sales
In contrast, the forecasts for the three variables correlated with the price of agave suggest a significantly different trend for the next decade (2022-2031) regarding the production and price of agave: the average annual increase in the value of tequila exports is expected to be 15%, production 12% (4%+ vs. the previous decade), and exports 9% (1%+ vs. the previous decade).
Note: As of the end of the reporting period for this investigation, in January 2023, there is no official information on the average price of agave for 2022 (SIAP, 2022a). However, the CRT provides figures on the production and export of tequila (millions of liters), based on external sources, and the value of their exports (millions of dollars) is available up until November 2022. The official data is compared with the forecast produced by the Minitab software, with the following results: The forecast for tequila production gives 91% certainty, the forecast for tequila exports presents 92% certainty, and the forecast for the value of exports, as of November 2022, is 93% (information on the cumulative total for the month of December is missing) (see Table 8).
Table 8 Comparison of the forecast for tequila Production, tequila Exports and tequila Export Value versus real values for 2022
| 2022 | Production Tequila (M/L) | Export Tequila (M/L) | Value Tequila Exports ($MM)* |
| CRT Real | 651 | 419 | $3.982 |
| S. Minitab | 594 | 387 | $4.283 |
| Diff | 57 | 32 | $-301 |
*Real value to the month of November 2022
Source: Prepared by author with information from the CRT (2022), and Solís (2022).
5. Discussion and Conclusion
Herrera Pérez et al. (2018) in his publication “Schemes of agricultural contracts for the production of Agave tequilana Weber in the tequila region, Jalisco” observes that the price of agave in the DOT states depends to a large extent on the oligopolistic control exerted by the leading tequila-producing companies in Mexico (the hypothesis that the price of agave is subject to control gains in significance when we observe that it progressively loses its relationship with the variables that this investigation has shown it is correlated).
In the decade from 2010 to 2021, a direct positive correlation of production, export of tequila and income from exports versus the price of agave is observed, while growth keeps pace in parallel over time, although, as previously noted, in the last five years, 2016-2021, there are already significant changes in the negative trend of the average annual price growth. By contrast, the forecast trend from 2022 to 2031 completely changes the positive relationship of the three variables versus the price of agave, with the opposite performance emerging, breaking with the correlation demonstrated over the last 20 years. The result of the study and forecast of the variables correlated with the price of agave (which should be causal referents in determining its value) enables us to confirm and verify from the quantitative context the hypothesis that the tequila agro-industrial oligopoly maintains close control over the price of agave.
Finally, as of 2016, the reduction in the average annual increase in the price of agave was not due to oversupply (the contraction in the growth trend of its supply being previously demonstrated). Despite the drop in the production trend of blue agave in DOT states, its value fell in the period with the highest increase (reaching record levels) in income resulting from the increase in tequila production and marketing (a trend apparently irreversible in the next decade).
The tequila industry seeks to meet the sustained growth in demand for tequila without transferring the benefits of this increased income to the primary producers of agave. From this perspective, we can understand the significance of the “historical moment” that saw the publication of the investigation “Effect of the age of the tequilana agave Weber Blue Variety on the quality and authenticity parameters for 100% Agave Silver Class tequila: Industrial scale evaluation” (Acosta Salazar et al., 2021) that demonstrated that processing “young agave” plants, just 3 or 4 years old (previously 6 years), does not affect its usefulness. This shift to the use of young agave does not entail any economic benefit for the primary producer either (the cultivation cycle of the blue agave plant from planting to harvesting is reduced by up to 50%, and therefore so are farmers’ costs), but does contribute significantly to the increase in its supply, further depressing its value. This will allow the tequila agro-industrial sector to reap the greatest possible economic benefits from the historical situation of the world tequila market.