


 nueva página del texto (beta)
 Inglés (pdf)
 Artículo en XML
 Referencias del artículo
 Enviar artículo por email
 Citado por SciELO
  Similares en
SciELO
Similares en
SciELO 
 Permalink
Introduction
Companies are generally in constant and unforeseen changes in all their guidelines, these can be of a type: social, economic, cultural, and political. These changes are due to the technological and social advances that society experiences over time and consequently, they bring about phenomena and question of great interest for the conduct of any investigation. Based on these considerations, this study seeks to contribute to all those organizations that offer a television service, because customer service is far most the best expression of this market, to build satisfied customers.
Every service provider company must continuously define and measure customer satisfaction, as service quality is a concept of particular importance for companies, since after receiving a service, customers compare it with what was expected. The expected service is formed based on previous experiences, feedback, and opinions from friends and similar institutions, as well as advertising. If the perceived service doesn't meet the expected level, customers lose interest. However, if the perceived service meets or exceeds expectations, customers are likely to return. In this scenario, the quality of service can be considered a subjective concept, dependent on customer opinions and resulting from their perception of the service provision compared to pre-consumption impressions (Lazzari and Moula, 2014).
Companies focus their attention on the constant measurement of their customers' satisfaction level. In marketing terms, the assessment of quality is understood as an aspect linked to the experiences that arise from using or enjoying a product or service. This is established as a key factor in the customer's future actions, including loyalty.
To ensure customer satisfaction, a company must ensure the quality of its products and services. In this context, quality alone leads to contented customers, representing a mindset that goes beyond simply troubleshooting for them (Horovitz, 1998). For this reason, it's essential to assess customer satisfaction in every interaction with the company, on a transactional basis. This evaluation of satisfaction or dissatisfaction can be advantageous as it's directly linked to specific experiences or actions, enabling the identification of areas for improvement in a more precise and effective manner. Customers can experience varying levels of satisfaction; if the performance of the product or service meets expectations, the customer will be satisfied, while if it exceeds those expectations, the customer will be highly pleased (Lamb, Hair y McDaniel, 2011).
This study assesses how viewers perceive the quality of television services using the Service Performance (SERPERF) model. In recent times, businesses have come to realize that the contentment consumers feel toward their products and services presents a significant competitive edge in the market. This advantage enables them to retain customer preference and maintain a strong market position. Ensuring customer satisfaction has become a challenging endeavor for companies, given that consumers have grown increasingly demanding. Simultaneously, they exhibit curiosity and discrimination while prioritizing product quality attributes, such as reliability, responsiveness, empathy, tangible features, safety, and other related factors.
Maintaining user satisfaction poses another formidable challenge due to the intense competition that an organization may face within a specific market. This study employs the SERVPERF model to assess how television services, namely Sky, Dish, Megacable, and open television, are perceived in the Isthmus of Oaxaca region. The central inquiry of this research is as follows: How do customers evaluate the quality of television services available in the Oaxaca region of the Isthmus of Tehuantepec? To address this query, twelve supporting questions were utilized, and a total of 920 surveys were conducted among users residing in major cities within the Isthmus of Tehuantepec, Oaxaca, such as Ixtepec, Juchitan, Tehuantepec, Salina Cruz, and Matias Romero. The primary objective of this study is to ascertain users' perceptions regarding the quality of television services provided in the Isthmus of Oaxaca.
The proposed hypothesis suggests that, overall, the perception of customers regarding the quality of television services among the population of the Isthmus of Tehuantepec in Oaxaca is unfavorable. Building on the aforementioned premise, this paper comprises an introduction, a theoretical framework, an explanation of the research methodology, subsequent presentation of attained results, and finally, the provision of conclusions and reflective insights on the study's findings.
Theoretical framework
The globalized and complex context in which companies operate today requires changes in their customer service. Adapting to new circumstances is presented as an unavoidable challenge if we want to guarantee the survival and prosperity of the Company. The companies have recognized that the satisfactory perception that the client has of their goods and services represents an important competitive advantage for the market because it allows them to maintain their preference and continue to take possession of that market, maintaining that satisfaction in the clients for the companies has it has been a difficult effort to achieve because since the consumers are increasingly demanding, curious and discriminating when prioritizing the quality characteristics of the product through values such as reliability, responsiveness, empathy, tangible elements, security, among other things.
Customers service id for organizations one of the great demands that needs adequate attention to achieve an impeccable provision of the same. Due to its relevance, companies make a great effort to deliver to their clients this set of activities that imply their nature, to make the user feel pleased and find it consistent with the value invested for its acquisition some factors that influence the delivery of customer service, which must be reviewed to establish how to intervene, to improve these actions. For this reason, the present work focuses on the perception of the quality of television services offered in the Oaxaca Isthmus through the SERVPERF model, these services are Sky, Dish, Megacable, and open television through values such as reliability, responsiveness, empathy, tangibles, and security.
Companies need to understand how to offer a service that meets their requirements. From the point of view of the authors Montoya and Boyero (2013), they establish that the service consists of the set of experiences resulting from the contact between the organization and the client, for which it is considered the best way to generate and adequate relationship, upon which their survival and success depend. Leppard and Molyneux (2000) argue that the company must understand the point of view of each user, in terms of their particular interpretation of customer service, since it depends on the different realities of each one. According to them, for some consumers it consists of having access to the service when they need it, considering formal aspects such as compliance with agreed hours, providing receptivity by listening to their needs, respecting the fulfillment of appointments, offering favorable demonstrations, among others. For their part, Aguilar and Vargas (2010) consider that the service consists of a process or set of actions that generally surrounds the moment of purchase, for that reason they are intangible goods that are consumed at the moment of their production.
There are characteristics inherent to the services, which are in the same way typical of customer service and some are described below:
Intangibility: According to the authors Zeithaml and Bitner (2002), it represents the most outstanding difference between products and services, since these are not tangible physical goods, palpable, possible to be seen or tasted, an advantage that tangible products have. For this reason, the services cannot be experienced before their use, some difficulties that the intangibility implies in terms of the marketing of the services, are that they cannot be inventoried, they are processed according to the behavior of the demand, and they are susceptible to being imitated. Because they are not patented, they do not have the possibility of being demonstrated at the moment and it is difficult to issue verbal opinions to clients.
Comprehensive: All the members of the organization are responsible for the production of the service, since each one intervenes in the final result that is delivered to the client, according to Serna (1999). It is for this reason that harmony is very important in the processes of the company from one area to another, internal communication, compliance with the times established in the general chain of the organization, because they work as an integrated group.
Simultaneous production and consumption: García (2016) points out that, regarding the marketing of services, three limitations are observed: first, there is difficulty in generating them massively; secondly, its quality depends on the way it is developed at the moment in front of the client, who tends to get involved, positively or negatively, generating in some cases difficult users. In addition, for Serna (1999), the service is a process where the provider is also part of its production and, therefore, cannot be separated from it.
Perishable: The services, considering their very nature, cannot be preserved, stored, returned, or resold. Once obtained, they are consumed and, therefore, exhausted. Serna (1999) states that customer service is produced and consumed instantly.
Satisfaction: As Serna (1999) explains, the service is produced and consumed instantly. Therefore, to a great extent, their satisfaction will depend on the way in which that opportunity is taken advantage of, as well as the efficiency with which it is produced and offered to the user.
Added value: From the point of view of Zeithaml and Bitner (2002), a tendency prevails in the users of the services, in terms of involving the attributes or components of the same when they discuss its value because for them it is important what received based on what was paid.
Regarding the SERVPERF model, the model was born as a result of the investigations carried out by Cronin and Taylor (1992) in eight service companies. The proposal was to validate an alternative method to assess perceived service quality and the significance of the relationships between service quality, customer satisfaction, and intentions to repurchase.
Based on a series of questionnaires, they contrasted the measurement of quality made through the discrepancy between expectations and perceptions of consumers and that made only with the perceptions or attitudes of the same. The 22 items proposed by SERVQUAL were used, suggesting on the one hand to apply SERVQUAL and on the other to measure quality only with the perception test proposed by this model. As discussed in the literature review and according to the tests carried out by Cronin and Taylor (1992), the SERVPERF scale seems to closely conform to the implications on attitudes and satisfaction.
In this way, it is stated that SERVPERF will have a better acceptance because the measurement exclusively of the perception of performance reflects more accurately the reality of the service provided.
As a result, they obtained that:
The quality of service is an antecedent of customer satisfaction.
Customer satisfaction has a significant effect on customer purchase intention.
Service quality has less effect on purchase intention than customer satisfaction.
They deduce that the SERVQUAL model of Parasuraman, Zeithaml and Berry (1988), is not the most adequate to measure the quality of the service due to the deficiencies analyzed.
Assuming that service quality and satisfaction are different constructs, the most common acceptance of the differences between both elements is that perceived service quality is a form of attitude, a global evaluation, while satisfaction is the measure of a specific transaction. The treatment of expectations as expected is based on the consumer's experiences with a specific type of service organization.
Hence, Cronin and Taylor (1992) state that the service literature has confused the relationship between consumer satisfaction and service quality. This distinction is important for both service managers and researchers because providers need to know whether or not what consumers expect corresponds to the level of provision, or whether or not they are satisfied with the highest perceived quality. The importance of this result has been a serious effort to clarify the relationship between satisfaction and service quality.
Frías (2007) points out that the relationship between service quality, customer satisfaction, and purchase intentions is still unexplored. Figure 1 brings together the fundamental differences between the paradigms that support one or the other model.

In 1992, Joseph Cronin and Steven Taylor strongly criticized the SERVQUAL model because they considered that the scale does not fit all classes of services, and suggested that service quality should be measured based on attitudes. Thus, as a result of their research, an alternative scale called Service Performance (SERVPERF) emerged. As seen in Figure 2, this model is based on perceptions of service quality from the five dimensions of service quality: reliability, responsiveness, empathy, tangibles, and safety. Although the authors are based on the Service of Quality model (SERQUAL), they only focus on measuring perceptions, excluding expectations because they consider that they are external factors that can bias the perception of service beneficiaries (Álvarez, 2015).
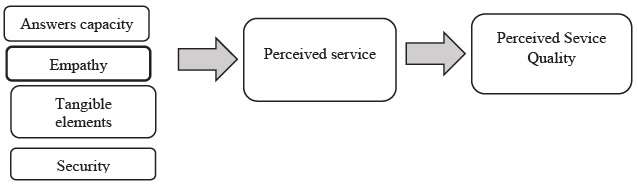
Figure 2 refers to the performance of the provider in the service encounter, which allows the quality of the service to be objectively measured. In the representation, you can see the five dimensions proposed by Cronin & Taylor that group the 22 items defined to assess perception.
Methodology used
Ibarra and Casas (2015) argue that the Servperf model is optimal for achieving the research objectives because the interviewee takes less time to answer the questionnaire since they are only asked once for each item; interpretation and analysis work is simple. In addition, although the opposite might be thought, with this model no information is lost, since the incorporation of a question on global satisfaction related to the service or product makes it possible to analyze the contribution of the remaining items to the level of global satisfaction achieved. On the other hand, the specific aspects that are subject to assessment must be the result of a prior study of expectations, carried out by applying qualitative techniques.
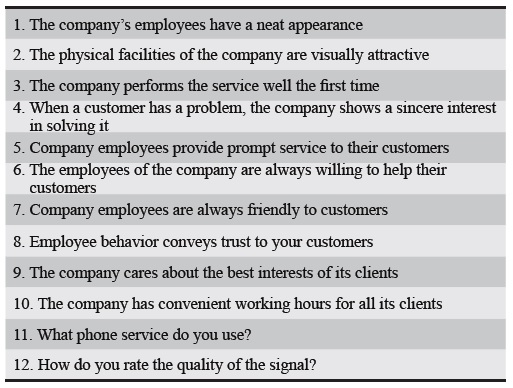
As explained before, the SERVQUAL and SERVPERF models incorporate 22 items, although this number can be considered as the maximum number of attributes to introduce in the quality analysis to be carried out. According to the theory, it is advisable to manage between 10 and 12 items, because it is convenient that the number of items is adapted to the specific needs of each study (Jaráiz and Pereira, 2014). Taking into account the above considerations, a 12-item instrument was designed to be applied in the study (Table 1) similar to that of Calabuig, Quintanilla, and Mundina (2008), Rodríguez et al. (2003), Torres and Luna (2017) applied an adapted model of the SERVPERF of 12 items to assess the perception of the quality of television services. The first two questions measure the tangible elements, the next two the reliability criterion, questions five and six the responsiveness, questions seven and eight assess the security dimension, questions nine and ten assess empathy. Question 11 allows us to know the company that provides the television service, and question 12 qualifies the quality of the signal. The respondent's age, sex, marital status, educational level, and occupation were also documented.
Table 1 Participation by gender
| City | Man | Woman |
| Juchitán | 121 | 70 |
| Salina Cruz | 127 | 86 |
| Tehuantepec | 127 | 73 |
| Matías Romero | 86 | 70 |
| Ixtepec | 67 | 93 |
| Total | 528 | 392 |
Source: Self made
Likewise, each dimension variable was constructed with the average of the variables within each criterion. Regarding the scale, the long numerical one (0 to 10) was used, since it incorporates advantages over others, such as the Likert scale, which, despite being easy to understand, is not very precise in terms of the score assigned to each element. In the scale used, zero represents the minimum degree of assessment by the user of banking services and 10 is equivalent to the maximum degree of assessment. The convenience of using the numerical scale 0-10 with respect to 1-10 lies in the fact that its midpoint is number five, in addition to the fact that sometimes clients who are very dissatisfied with the service want to value zero and it makes it possible to obtain percentages of the scale directly (Jaráiz and Pereira, 2014). The connection between this scale and the one employed in education is readily apparent, wherein grades 6, 7, 8, 9, and 10 signify passing marks, while scores below 5 indicate failure. Consequently, we will establish a correlation using the terms adequate, satisfactory, commendable, outstanding, and exceptional, respectively.
The quantity of customers to be included in the survey was established using a simple random sampling approach for proportions, with the aim of maintaining a maximum margin of error in estimation of 5% (e = 0.05) and a confidence level of 95% [ 100(1 − α) % = 95% ], while assuming an exceedingly large population. The formula employed for determining the sample size aligns with equation 1:
Where Z21−α/2 represents the 1 − α/2 quantile of the standard normal distribution, e stands for the highest acceptable error, p signifies the probability of possessing the sought-after characteristic, and q = 1 − p. Since the precise value of probability p is unknown, the decision was made to account for the maximum variance, which arises when p = q = 0.5. For a confidence level of 95%, the quantile Z21−α/2= 1.96. By employing the computations using equation 1, the smallest required sample size for estimating proportions is obtained; for instance, the sample size needed to estimate the proportion of users perceiving the service as excellent is 920 users. Likewise, since there are five more populated cities in the region studied (Ixtepec, Juchitán, Tehuantepec, Salina Cruz, and Matías Romero), it was planned to obtain at least 920/5 = 184 surveys per population, thus ensuring representativeness by city. The information collection was carried out on business days. It is noteworthy that, although the information was collected according to simple random sampling for proportions since in the first instance the proportions of the different ratings that users gave to the service received would be estimated, the analysis of the random sample collected was more It was broad and included a subpopulation study according to age, sex, marital status, degree of study and occupation of the respondent. To evaluate the reliability of the instrument used (table 1), Cronbach's alpha (Cronbach, 1951) was used, which is determined by equation 2:
Where S i 2 is the variance of item i, S2 t is the variance of the totals and k is the number of items. If the items are combined additively and measure the unobservable characteristic in the same direction, then the items are strongly correlated and thus we have a reliable instrument. In such a case the coefficient α tends to the value 1. In contrast, α tends to zero if the items are independent or weakly correlated. This indicates that the instrument is not reliable, since it extracts information via unrelated questions, leading to erroneous conclusions.
Taking into account the above considerations, a 12-item instrument was designed to be applied in the study (Figure 3). The first two questions assess tangible elements, the next two reliability, the next two responsiveness, question seven and eight the security dimension, question nine and ten empathy, question 11 lets you know the company that lends you the television service, and 12 rates the quality of the signal. The respondent's age, sex, marital status, educational level and occupation were also documented.
Results
Table 1 shows the characteristics of the respondents by municipality and sex, in total there were 920 participants 528 men and 392 women in the 5 most populated cities of the Oaxacan Isthmus, Mexico. Table 2 shows the total education in percentage, 36.73% of participation are those who studied high school, this is the highest percentage followed by 23.69% who studied secondary school. Table 3 shows the structure of the sample by age group in percentage, the highest participation group is between 20 to 29 years of age with 29.02%, followed by the group of 30 to 39 years of age with 25.67 %. Table 4 presents the structure of the sample by occupation in percentage, people with a job obtained the largest percentage, this being 49.67%.
Table 2 Total education in percentage
| Education | None | Elementary | Junior High | High School | University | Master degree/ Doctorate |
| % | 0.65 | 18.15 | 23.69 | 36.73 | 19.13 | 1.63 |
Source: Self made
Table 3 Structure of the simple by age group in percentage
| Age | 18-19 | 20-29 | 30-39 | 40-49 | 50 or more |
| % | 0.32 | 29.02 | 24.67 | 21.84 | 24.13 |
Source: Self made
Table 4 Structure of the simple by occupation in percentage
| Occupation | Housewife | Employee | Professional | Student | Entrepreneur | Retired | Unemployed | Other |
| % | 16.84 | 49.67 | 6.52 | 7.06 | 5.54 | 5.89 | 4.34 | 4.13 |
Source: Self made
Instrument reliability.
The results achieved when calculating Cronbach's alpha with the 12 items of the applied instrument, a value of 0.982 was obtained and Cronbach's alpha based on the typified elements is .970, this leads us by the hand to think that the instrument designed to measure the perception of the quality of television services is reliable. Now, by dimension, Cronbach's alpha was 0.985 for the tangible element, .978 for the reliability, responsiveness, and security elements, and for the empathy element. According to Hernández Sampieri et al. (2010, p. 302), alpha values greater than 0.5 correspond to an instrument with medium reliability, and values greater than 0.75 refer to acceptable reliability. For our research, the five measured elements obtained values greater than 0.75.
Results on the perception of the quality of television services throughout the region
Based on what is stated in the methodology regarding the measurement of the results obtained from the respondents, tables 5 to 9 show the five dimensions of the quality of television services by region: tangible element, reliability element, responsiveness, security element, and empathy element. Table 10 presents the average of the five elements.
The tangible element (Table 5) 60.81% of the participants gave a passing grade against 3.46% disapproval, 35.6% do not have a television at home; the reliability element (Table 6) presents 57.82% approval against 6.43% disapproval, 35.74% do not have a TV at home; In terms of response capacity (Table 7), 55.15% approved the service provided and only 9.19% disapproved, 35.64% do not have TV; Regarding the security element (Table 8), it obtained 57.38% approval and 6.96% disapproved, 35.64% do not have TV; Regarding the empathy element (Table 9), 56.04% approved the service and only 8.30% failed it, 35.64% do not have TV; Finally, the average obtained (Table 10) of the five elements, 57.44% approved the service and only 6.87% disapproved, 35.64% do not have a TV at home.
Table 5 Average of the 5 elements
| < = 5 | >= 6 | Does not apply | |
| Tangible | 3.46% | 60.81% | 35.71% |
| Reliability | 6.43% | 57.82% | 35.74% |
| Response capacity | 9.19% | 55.15% | 35.64% |
| Security | 6.96% | 57.38% | 35.66% |
| Empathy | 8.30% | 56.04% | 35.64% |
| Average | 6.87% | 57.44% | 35.67% |
Source: Self made
Analyzing the perception of the quality of television services by city surveyed, we can see that in terms of the tangible element by city (Table 6) Tehuantepec and Ixtepec more than 64% of the participants give it passing grades, in Matías Romero 42%. of the participants do not have a TV at home; Regarding the reliability element (Table 7) Tehuantepec and Ixtepec, more than 60% of the respondents give it passing grades; Regarding the response capacity element (Table 8), Tehuantepec and Salina Cruz, more than 58% of the participants give passing grades; Analyzing the security element (Table 9) 50% of all respondents give passing grades, in the case of Salina Cruz only 2.11% give failing grades; Finally, regarding the empathy element (Table 10) Tehuantepec, Salina Cruz, Ixtepec and Juchitán, more than 54% of those surveyed give passing grades, only 3.5% of those surveyed in Salina Cruz give failing grades.
Table 6 Tangible element tangible by city
| City | < = 5 | >= 6 | Does not apply |
| Juchitán | 2.88% | 58.64% | 38.48% |
| Salina Cruz | 0.94% | 62.21% | 36.85% |
| Tehuantepec | 2.50% | 65.00% | 32.50% |
| Matías Romero | 3.21% | 54.17% | 42.63% |
| Ixtepec | 7.81% | 64.06% | 28.13% |
Source: Self made
Table 7 Reliability element by city
| City | < = 5 | >= 6 | Does not apply |
| Juchitán | 6.28% | 55.24% | 38.48% |
| Salina Cruz | 2.82% | 59.86% | 37.32% |
| Tehuantepec | 4.75% | 62.75% | 32.50% |
| Matías Romero | 7.37% | 50.32% | 42.31% |
| Ixtepec | 10.94% | 60.94% | 28.13% |
Source: Self made
Table 8 Response capacity by city
| City | < = 5 | >= 6 | Does not apply |
| Juchitán | 9.95% | 51.83% | 38.22% |
| Salina Cruz | 3.99% | 58.92% | 37.09% |
| Tehuantepec | 6.50% | 61.00% | 32.50% |
| Matías Romero | 9.62% | 48.08% | 42.31% |
| Ixtepec | 15.94% | 55.94% | 28.13% |
Source: Self made
Table 9 Security element by city
| City | < = 5 | >= 6 | Does not apply |
| Juchitán | 3.40% | 58.38% | 38.22% |
| Salina Cruz | 2.11% | 60.80% | 37.09% |
| Tehuantepec | 4.75% | 62.75% | 32.50% |
| Matías Romero | 8.01% | 49.68% | 42.31% |
| Ixtepec | 16.56% | 55.31% | 28.13% |
Source: Self made
Table 10 Empathy element by city
| City | < = 5 | >= 6 | Does not apply |
| Juchitán | 6.81% | 54.97% | 38.22% |
| Salina Cruz | 3.52% | 59.39% | 37.09% |
| Tehuantepec | 6.25% | 61.25% | 32.50% |
| Matías Romero | 10.26% | 47.44% | 42.31% |
| Ixtepec | 14.69% | 57.19% | 28.13% |
Source: Self made
Table 11 shows the TV service used in percentage used by respondents throughout the region of the Oaxaca Isthmus, first with 45.69% of respondents Megacable and second with 31.18% use open TV, third with 12.88 % use SKY, in fourth place with 6.38% use Dish and those who do not have a TV are 3.87% of the respondents; Table 12 shows the TV service used by city, with the respondents from Tehuantepec and Ixtepec occupying the first place with 53%, they are the ones that most use the service offered by Tele Cable and in second place with 47% of the respondents are those from Salina Cruz using Cable TV.
Table 11 Television service used
| Public Access | 31.18% |
| Megacable | 45.69% |
| SKY | 12.88% |
| Dish | 6.38% |
| None TV | 3.87% |
Source: Self made
Table 12 Television service used
| City | None TV | Public Access | Megacable | SKY | Dish |
| Juchitán | 3.14% | 37.17% | 43.46% | 12.04% | 4.19% |
| Salina Cruz | 2.83% | 33.96% | 47.64% | 8.96% | 6.60% |
| Tehuantepec | 2.00% | 31.00% | 53.00% | 8.00% | 6.00% |
| Matías Romero | 7.64% | 33.12% | 31.21% | 22.29% | 5.73% |
| Ixtepec | 3.75% | 20.63% | 53.13% | 13.13% | 9.38% |
| Average | 3.87% | 31.18% | 45.69% | 12.88% | 6.38% |
Source: Self made
Regarding the quality of the television signal offered in the region, table 13 presents the results, 79.15% gave passing grades and only 16.97% gave failing grades, 3.87% of those surveyed do not have a television; the results obtained by city: we can point out that more than 82% of those surveyed in Juchitán, Salina Cruz, and Tehuantepec gave passing grades as a good sign, only 22.93% of those surveyed in Matías Romero gave failing grades, these being the city with the most problems in the received television signal.
Conclusion
As per all gathered data, 64.95% of those surveyed hire a television service, this percentage is distributed as follows: 45.69% Megacable, 12.88% Sky and 6.38% Dish, 31.18% use the open television service and 3.87% do not have a television this is 35.05% of those surveyed do not hire a television service.
Consumers who do not complain about poor service received may choose to go with the competition and carry out a negative communication process with respect to the company.
In the analysis of the perception of the quality of the services of the five elements evaluated, the tangible element obtained an approval rating greater than or equal to six, with 60.81% approval, the responsiveness element only 55.17% gave a rating greater than or equal to six. In general, we can state that television service customers approve of what companies offer them since the general average obtained is 57.44% of those surveyed gave a rating greater than or equal to six.
The failing result of less than five was obtained from the five elements evaluated, the tangible element reached 3.46%; in the reliability element, 6.43% of the respondents qualified with failing evaluations less than or equal to five.
Regarding the analysis by city, the participants in Tehuantepec always gave the highest ratings in the five elements: the tangible element 65%, the reliability element 62.75%, the responsiveness element 61%, the security element 62.75% and, the empathy element, 61.25% gave scores greater than or equal to six.
Carrying out the analysis of the poorly evaluated city, Matías Romero gave the lowest scores: the tangible element, the reliability element, the responsiveness element, the security element, and the empathy element reached 42.30% of the participants giving lower scores or equal to five.
To remain among the consumers' preference, the quality of customer service is one of the key points, 79.15% of those surveyed gave ratings greater than or equal to six, approved the quality of the television signal received, stating that they are satisfied with the service offered.
Ibarra and Casas (2015) said that the importance of quality acquired in services has allowed broadening the spectrum of the term of the dimension of excellence, which in response to the fulfillment of the requirements and needs of the clients, as well as to the correct orientation of the results obtained after an evaluation, in order to contribute to the continuous improvement of the processes and procedures that give meaning to the service that companies provide to their clients and/or users.
The measurement of excellence in services has made it possible to contribute to the achievement of the strategic objectives of organizations that participate in a specific sector, as part of the large service industry.
The current globalization of markets has led companies to a growing and dynamic competition and therefore has profoundly changed business practice. The customer is the predominant figure and is required to be satisfied with the service offered, so you have to provide the product that he wants. The client is a source of strategic information on the quality of the product or service; therefore, knowing in depth the needs of the consumer, as well as finding the best way to satisfy them with appropriate strategies in a time of changing markets, are vital issues for the survival and prosperity of organizations.
The perception of the quality of the services according to the five elements evaluated indicate higher levels of satisfaction than dissatisfaction, however, improvement processes must be developed since clients always demand better services, for this reason, it is necessary to adopt service approaches to the customer with a long-term vision and incorporate quality models aimed at exceeding customer expectations.
Cruz, González y Valenzo (2021) suggest that enhancing organizational competitiveness can be achieved by focusing on customer satisfaction, which plays a crucial role in shaping models that gauge the alignment of company products and services with customer expectations. Our research highlights that the assessment of service quality across the five key dimensions indicates higher satisfaction levels rather than dissatisfaction. However, it is imperative to instigate improvement processes, as customers consistently strive for optimal service experiences.
Ramos et al. (2020) state that the Servperf model provides a means to assess the quality level of service-oriented companies, leveraging client feedback to devise effective strategies that mutually benefit both the company and its customers. In our scenario, the residents of Matías Romero require alternative strategies due to their negative evaluations of the provided service.

