


 nova página do texto(beta)
 Inglês (pdf)
 Artigo em XML
 Referências do artigo
 Enviar este artigo por email
 Citado por SciELO
  Similares em
SciELO
Similares em
SciELO 
 Permalink
Introduction
A group of microorganisms, mainly yeasts and bacteria, tends to colonize bee environments such as the floral nectar and honey. They have specialized in exploiting environments rich in sugars, deficient in other nutrients such as lipids, proteins, vitamins, and amino acids, and extreme in their conditions of high or low water availability (Nicolson et al. 2007; Herrera et al. 2009; Álvarez-Pérez and Herrera 2012; Pozo et al. 2012). The yeasts that inhabit floral nectar interact with various floral visitors, mainly insects, which disperse them among flowers and into other sugar-rich environments that may drastically differ in terms of chemistry and nutrients (Lachance et al. 2001; Canto et al. 2008; Starmer and Lachance 2011; Pozo et al. 2015; Madden et al. 2018). The specific associations established by the yeasts with their vectors, such as bees, enable them to disperse and colonize environments beyond floral nectar. Yeasts proliferate in environments with contrasting conditions with the floral nectar, including for example bee gut, honey, and bee bread in the bee nests (Hajsig 1958; Gilliam 1997; Rosa et al. 2003; Teixeira et al. 2003; Brysch-Herzberg 2004). This implies, for example, that yeasts should move through environments with differing sugar concentrations. When moving from flowers to bee nests, yeasts must cope with environments of increasing sugar concentrations (Spencer and Spencer 1997; Belisle et al. 2012; Lievens et al. 2015; Pozo et al. 2015; Madden et al. 2018). Sugar concentration in the floral nectar of tropical plants can range from about 1 to 50 % (Nepi et al. 2009; Canto et al. 2017), but in honey stored in bee nests, it can vary from 60 to 85 % (Snowdon and Cliver 1992; De-Melo et al. 2018). This sugar gradient is salient because, at medium to high sugar concentrations, water availability for metabolic processes (quantitatively expressed as water activity, aw) declines (Grant 2004; Buzzini et al. 2018). Environments such as honey have lower water activity (aw = 0.56-0.62 according to Pascual-Maté et al. 2018), than floral nectar (aw = 0.93-0.99 according to Lievens et al. 2015), which can be a limiting factor for yeast growth.
For yeasts to move and survive in environments such as floral nectar and honey is a challenge because they must face an environmental gradient determined by water activity and osmotic pressure. These variables determine yeast growth kinetics in any habitats to which bees transport them (Spencer and Spencer 1997; Pozo et al. 2015). In their movement and dispersal between flowers and nests, yeasts move from an environment that provides an osmotic pressure conducive to growth, to one that imposes a high osmotic pressure on cells. High osmotic pressure is one of the main limitations on cell growth and size in general (Stevenson et al. 2015). A gradient of increasing sugar concentration in the medium causes a gradual rise in osmotic pressure, affecting yeast cell growth as well as cell size since water loss due to osmosis reduces cell volume and the amount of water available for cellular processes (Rose 1975; Mager and Siderius 2002; Grant 2004; Raspor and Zupan 2006; Lievens et al. 2015; Stevenson et al. 2015). For example, yeast strains of Saccharomyces cerevisiae and Zygosaccharomyces rouxii exhibit decreased cellular density and biomass as well as slower growth rates when medium sugar concentrations gradually increase (e.g., 40 to 60 %) (Membré et al. 1999; Arroyo-López et al. 2009). In yeast strains isolated from flower and bee environments, the effect of the increasing sugar gradient on the kinetic growth and cell size is currently unexplored. This phenomenon is important because the sugar concentration gradient can determine growth kinetics and the ability of a yeast strain to exploit new ecological niches and acts as a selective force to yeast specialization in extreme sugary environments (Herrera et al. 2012; Chappell and Fukami 2018). The objective of the study was to quantify growth kinetics of four yeast strains isolated from floral nectar and honey of Melipona beecheii, in response to increments in the sugar concentration of the growth medium, similar to the concentration gradient that is experienced by yeasts when transported from floral nectar to honey stored in bee nests. The increase in sugar concentration causes declines in yeast cell growth and size. We hypothesize that the yeast strains isolated from the floral nectar will grow better in low or medium concentrations of sugar in the growth medium; however, yeast strains isolated from honey will grow better at high concentrations of sugar in the medium.
Material and methods
Strains
We studied four strains of yeasts, two of them were isolated from the floral nectar of Tecoma stans (L.) Juss. ex Kunth (Bignoniaceae) and Distimake aegyptius (L.) Simões and Staples (Convolvulaceae), and the other two, from the honey stored in nests of the native stingless bee Melipona beecheii (Apidae: Meliponini) isolated in two previous works (Lizama 2011; Canto and Herrera 2012). All strains were deposited in the microbial collection of the Centro de Investigación Científica de Yucatán, A.C. (CICY), and preserved in sterile distilled water at 10 °C until the experiments were carried out. Taxonomical identity of the strains was Metschnikowia koreensis, strain CICY-RN-035 and Sympodiomycopsis paphiopedili, strain CICY-RN-209, both isolated from the floral nectar; Starmerella apicola, strain CICY-RN-364, and Starmerella apicola 2, strain CICY-RN- 354, isolated from the honey. The criteria to select the strains were their frequency in nectar, or honey samples, percentage of identical sites (nucleotides; approximately 99 %), and coverage sequence (approximately 99 %) observed among strains and reported in two previous studies (Lizama 2011; Canto and Herrera 2012). The criteria denote the association of the strains with their source (nectar and honey). Appendix is shown the nucleotide sequences for the D1-D2 region of the large subunit ribosomal DNA and GenBank accessions of the tested strains.
Inoculum, cell count, and viability
Prior to the experiment, the strains were reactivated by incubation in cell culture dishes containing YPD media agar (yeast extract peptone dextrose) with (w/w) 2 % glucose, 1 % peptone, 0.5 % yeast extract, and 2 % agar (Sigma Aldrich). Glucose was the carbohydrate source used in the culture medium (Rodrigues et al. 2006). The sown yeasts incubated for 5-12 days at 24 °C until colony growth was observed. Then, all colonies on each plate were suspended in 3 mL sterile distilled water and diluted again in sterile distilled water (1:100) and finally diluted in methylene blue solution (1:200) to identify living (colorless) and dead (blue) cells (Kwolek-Mirek and Zadrag-Tecza 2014). One aliquot (10 µL) of each cell suspension was placed in an improved Neubauer chamber (Marienfeld®, 0·1 mm depth), and examined under a microscope to record living cell count, dead cell count and total cell count in ten quadrants (0.04 mm3). These cell counts were used to estimate two parameters:a) culture density per microliter of growth medium (equation 1, Canto et al. 2017) and, b) the viability of the cells in suspension (equation 2, Kwolek-Mirek and Zadrag-Tecza, 2014):
A final solution with a culture density of 9 x 10⁴ living cells / μL was obtained for each strain. This solution was the initial culture density for the calibration curves and the inoculum for growth experiments.
Calibration curves
For estimation of culture density, growth curves for each strain were generated by correlating the absorbance values with culture density values produced by direct microscopic counts (Valero et al. 2006). Inocula (culture density of 9 x 10⁴ living cells/ μL) of strains were cultured in triplicate in 100 mL YPD broth containing (w/w) 2 % glucose, 1 % peptone (Sigma Aldrich) and, 0.5 % yeast extract. Strains were incubated in an orbital agitator (Zhicheng® ZHWY-200B) at 150 rpm and 24 °C and yeast cells counted in triplicate (10 µL aliquots) with a microscope (Olympus® CX31) and improved Neubauer chamber (Marienfeld®, 0·1 mm depth) at a 10-40x magnification. Absorbance was measured in triplicate for accuracy (3 mL aliquots) with a spectrophotometer (Jenway 6405 UV-Vis) calibrated to 590 nm. The total experiment duration was 76 h, and absorbance measurements were taken every four hours. Time intervals were used in each species to provide an accurate characterization of the three growth phases: 1)latency, when cells have adapted to initial environmental and nutritional conditions; 2) exponential, when cells have adapted to the medium and attain maximum multiplication rate; and 3) stationary, during which multiplication rate becomes fairly similar to mortality rate.
Calibration curves were fit using regression models to produce an equation that best described growth. Absorbance was the response variable and culture density was the causal variable. Statistical analyses were run with the SPSS ver. 17 software. Finally, the variable of absorbance was used to estimate cell growth in experiments with different glucose concentrations.
Culture cell density
Culture density (cells / µL) in each strain at different glucose concentrations was assessed in triplicate using YPD broth (w/w) containing one of the glucose concentration tested (2, 10, 20, 40 or 60 %) plus 1 % peptone, and 0.5 % yeast extract (Sigma Aldrich). Each replicate corresponded to an Erlenmeyer flask (250 mL) containing 100 mL YPD medium and inoculum, which incubated at 150 rev min-1 and 24 °C. The sugar concentration of 2 %, used in conventional microorganism growth trials, was designated as the low concentration treatment in this study. The moderate concentrations were 10 and 20 % glucose, commonly found in floral nectar, and the high concentrations were 40 and 60 %, frequently observed in the honey (Souza et al. 2006; Da Silva et al. 2016; De-Melo et al. 2018). We also registered the time in hours to which each strain achieved every growth phase.
Given that the culture medium turbidity affects absorbance measurement, adjustments were applied to absorbance measurements by using the averaged value of absorbance of another two replicates of not inoculated YPD broth under the same experimental conditions set for the strains. Each replicate for the absorbance adjustment consisted of an Erlenmeyer flask (250 mL) containing 100 mL of culture medium but no added yeast. Additionally, we used a cuvette that contained water as blank (absorbance value with no medium) before measure absorbance in samples for each medium type, using a spectrophotometer (Jenway® 6405 UV-Vis) calibrated to 590 nm. Cell density in samples for each combination of strain and sugar concentration treatment, were calculated with the equation derived from calibration curves.
Growth parameters
For each strain, we estimated and compared two growth parameters, the rate of the maximum specific growth (μmax), which is the maximum multiplication rate attained by microbial cells (Salvesen and Vadstein 2000; Maier 2009), and the duplication time (td), which is the time in hours required by microbial cells to duplicate themselves and produce a new generation (Sprouffske and Wagner, 2016; Giannuzzi, 2018). These parameters calculated using equation 3 and 4 as follow:
Cell length
The effect of increased sugar concentration on cell size in each strain was analyzed. At stationary phase onset in each glucose concentration level, an aliquot (10 µL) was taken, and lactophenol blue (10 µL) stain added. Images were taken of the cells using an improved Neubauer chamber in a microscope (×1000 magnification) and a photographic camera (Infinity 1®). Measurements of length were taken of approximately 90 randomly selected cells from each replica of strains and glucose concentrations, using the Infinity Analyze ver. 5.0.2 software (Lumenera Corp.) calibrated to the 1000 x magnification.
Statistical analysis
The effect of glucose concentration on culture density was analyzed by fitting a generalized mixed model to the data. The glucose concentration and the strain were fixed factors, and the time interval (h) was a random variable. This analysis conducted for each yeast strain used only data from the exponential growth phase since this period tent to be linear, and therefore allows comparisons between the different yeasts and sugar concentrations. Data for S. paphiopedili were squareroot transformed to achieve linearity. The analyses were conducted with the MIXED procedure of the SAS ver. 9.1.3 statistical software (Statistical Analysis System. Institute, Cary, NC, USA). To test the effect of glucose concentration on cell size (length), we conducted a Kruskal-Wallis nonparametric test in the SPSS ver. 17 software.
Results
Culture density
We observed differences both between the different strains and between the sugar concentrations in the culture medium (Figure 1). Slower growth and a lower maximum density are observed with increasing sugar concentrations above 20 % (Figure 1a). For M. koreensis strain, the model used was significant (χ2 = 5.20; P < 0.05), explaining a relatively high amount of the data variance. The significant factors were glucose concentration (F4, 8 = 6181.68; P < 0.0001), time (F6, 12 = 2877.74; P < 0.0001) and the interaction between glucose concentration and time (F24, 28 = 112.67; P < 0.0001). Culture density in this strain decreases with increasing glucose concentrations (P < 0.0001, Bonferroni test). The YPD broths with 2, 10 and 20 % glucose concentrations had the highest cell growth, almost three times that observed in the broth 60 % glucose concentration (1.06 × 10⁶ cells / µL). In this strain, the latency phase lasted only 8 h at low and moderate glucose concentrations (2, 10, and 20 %) but up to 16 h at higher concentrations (40 and 60 %). The longest exponential phase (14 h) was in the 10 % sugar concentration.
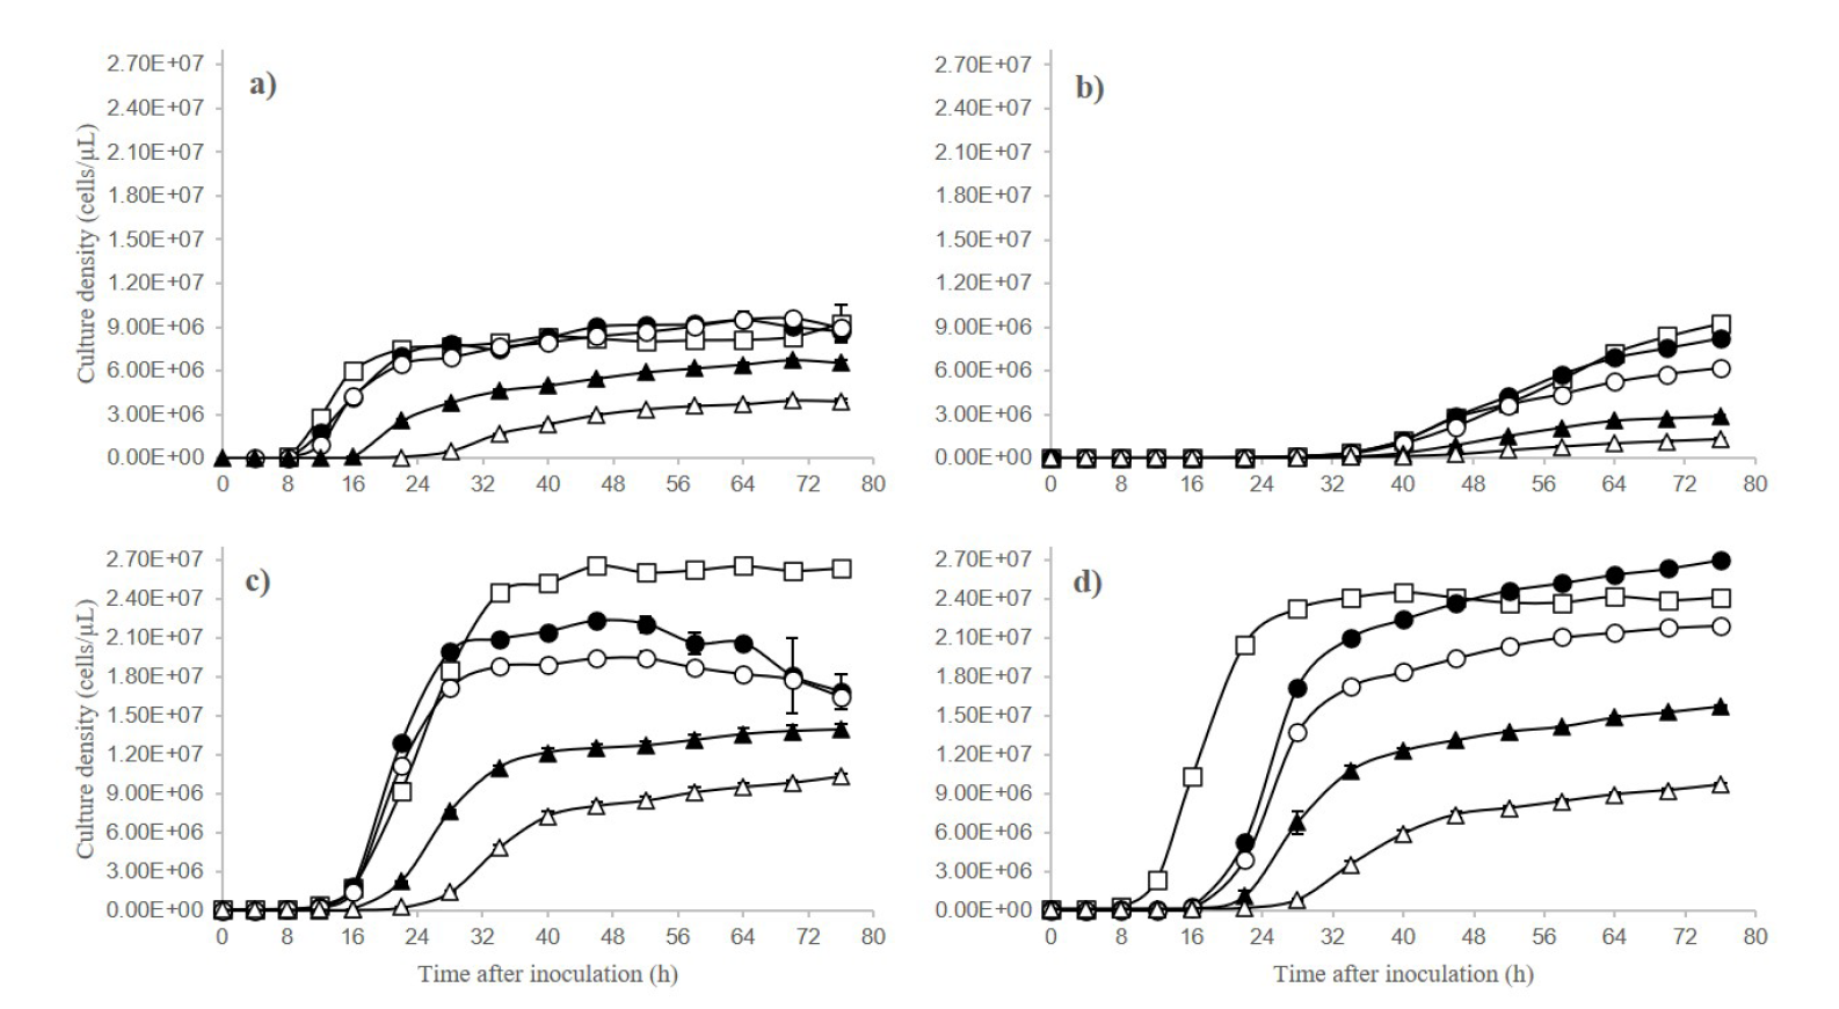
Figure 1 Culture density (cells / µL ± SD) of four yeast strains. a: CICY-RN-035 (Metschnikowia koreensis). b: CICY-RN-209 (Sympodiomycopsis paphiopedili), both isolated from the floral nectar. c: CICY-RN-364 (Starmerella apicola). d: CICY-RN- 354 (Starmerella apicola 2), isolated from the honey of Melipona beecheii. Growth media used was YPD with stepped increments in glucose concentration (w/w): (□) 2 %, (•) 10 %, (o) 20 %, (▲) 40 %, and (Δ) 60 %.
In the S. paphiopedili strain, the model was significant (χ2 = 4.37; P < 0.05), but the growth was pronouncedly slower than the growth of the other strains studied here (Figure 1b). Growth of the strain was affected by the glucose concentration (F4, 8 = 4789.81; P < 0.0001), time (F7, 14 = 4001.04; P < 0.0001), and also by the interaction between glucose concentration and time (F28, 56 = 101.25; P < 0.0001). The growth was similar between glucose concentrations, very low in latency, until 40 hours of cultivation; after approximately 40 hours, the culture density decreases with increasing glucose concentrations (P < 0.0001, Bonferroni test). After 40 hours, culture density was highest in the broth with 2 % glucose concentration (4.81 × 10⁶ cells / µL), exceeding the culture density at 40 % (1.49 × 10⁶ cells /µL) and 60 % (5.48 × 10⁵ cells / µL). The latency phase of growth lasting approximately 42 hours at all broth concentrations, and it was longer at 40 and 60 %.
For the S. apicola strain, the model was significant (χ2 = 7.85; P < 0.05). The factors glucose concentration (F4, 8 = 11396; P < 0.0001), time (F5, 10 = 11250.10; P < 0.0001) and the interaction between glucose concentration and time (F20, 40 = 482.37; P < 0.0001) were significant. Similar to the other strains (Figure 1c), we observed in this one a slower growth and a lower maximum density with increasing sugar concentrations above 20 % (P < 0.0001, Bonferroni test). Density was highest in 2 % glucose (1·35 × 107 cells / µL) and lowest in 60 % (4·52 × 106 cells / µL). In low and intermediate glucose concentrations (2, 10, and 20 %), the latency phase was shorter (12 h) but longer (> 16 h) at the high concentrations (40 and 60 %). The exponential phase duration decreased as glucose concentration increased; at the 2 % concentration it lasted 18 h, and at 60 % it lasted 12 h.
For the S. apicola 2 strain, the model was significant (χ2=5.88; P < 0.05). In this strain, only the factor of glucose concentration had a significant effect on culture density (F4, 8 = 177.98; P < 0.0001). We observed (Figure 1d) a slower growth and a lower maximum density with increasing sugar concentrations above 20 % (P < 0.0001, Bonferroni test). Culture density was highest (1.12 × 10⁷ cells / µL) at the 10 % concentration, and notably limited in the 40 % (6.22 × 10⁶ cells / µL) and 60 % (3.41 × 10⁶ cells / µL) concentrations. The latency phase lasted eight hours at the 2 % concentration and got longer to 16 h at 60 % concentration. The exponential phase also lengthened as glucose concentration increased, from ten hours at the 2 % concentration to 12 h at the 60 % concentration.
Growth parameters
The rate of the maximum specific growth (μmax) and duplication time (td) of each strain responded to the glucose concentration in the broth medium. In the strain of M. koreensis, the μmax was highest at the 2 % concentration and decreased as sugar concentration increased (the 40 % concentration was an exception), and the td was shortest and increased as the sugar concentration did. A similar pattern in the μmax and td observed for the strains CICY-RN-364 (S. apicola) and CICY-RN- 354 (S. apicola 2). The exception was the strain CICY-RN-209 (S. paphiopedili), which showed the lowest growth rate and the longest duplication time, no matter the glucose concentration (Table 1).
Table 1 Average (± SD) of the rate of the maximum specific growth (μmax) and duplication time (td) in hours (h) of four yeast strains under an increasing gradient of glucose concentration in the medium
| CICY-RN-035 Metschnikowia koreensis | CICY-RN-209 Sympodiomycopsis paphiopedili | CICY-RN-364 Starmerella apicola | CICY-RN- 354 Starmerella apicola 2 | |||||
| Glucose | µmax | td | µmax | td | µmax | td | µmax | td |
| 2 % | 0·52 ± | 1·34 ± | 0·08 ± | 8·99 ± | 0·15 ± | 4·72 ± | 0·22 ± | 3·23 ± |
| 0·04 | 0·11 | 0·002 | 0·28 | 0·01 | 0·34 | 0·001 | 0·02 | |
| 10 % | 0·41 ± | 1·69 ± | 0·07 ± | 9·44 ± | 0·20 ± | 3·48 ± | 0·20 ± | 3·51 ± |
| 0·01 | 0·04 | 0·003 | 0·43 | 0·004 | 0·08 | 0·01 | 0·11 | |
| 20 % | 0·38 ± | 1·81 ± | 0·07 ± | 9·44 ± | 0·21 ± | 3·37 ± | 0·21 ± | 3·34 ± |
| 0·01 | 0·05 | 0·004 | 0·55 | 0·003 | 0·04 | 0·01 | 0·09 | |
| 40 % | 0·51 ± | 1·37 ± | 0·08 ± | 8·30 ± | 0·13 ± | 5·21 ± | 0·19 ± | 3·63 ± |
| 0·01 | 0·03 | 0·01 | 0·49 | 0·004 | 0·17 | 0·03 | 0·51 | |
| 60 % | 0·22 ± | 3·13 ± | 0·09 ± | 7·88 ± | 0·14 ± | 5·12 ± | 0·17 ± | 4·18 ± |
| 0·02 | 0·31 | 0·01 | 0·42 | 0·003 | 0·11 | 0·01 | 0·22 | |
Strains isolated from floral nectar were Metschnikowia koreensis and Sympodiomycopsis paphiopedili, and the isolated from honey were Starmerella apicola and Starmerella apicola 2.
Cell length
The nonparametric test indicated that different glucose concentrations affect cell length. In general, all the study yeasts reduced in cell size due to the increment of glucose concentration in the broth medium (Figure 2). The strains exhibited a reduction in cell length as follow: strains CICY-RN-035 (M. koreensis) from 7.31±1.57 to 5.6 ± 1.01, strain CICY-RN-364 (S. apicola) from 3.77 ± 0.58 to 2.53 ± 0.37, strain CICY-RN- 354 (S. apicola 2) from 4.13 ± 0.88 to 2.87 ± 0.48, and strain CICY-RN-209 (S. paphiopedili) from 7.21 ± 1.26 to 5.95±1.72 (Figure 3).

Figure 2 Cells of four yeast strains: CICY-RN-035 (Metschnikowia koreensis), CICY-RN-209 (Sympodiomycopsis paphiopedili), both isolated from the floral nectar; CICY-RN-364 (Starmerella apicola), and CICY-RN- 354 (Starmerella apicola 2), isolated from the honey of Melipona beecheii. Growth media used was YPD with stepped increments in glucose concentration (w/w): 2 %, 10 %, 20 %, 40 %, and 60 % glucose. Cells were stained with lactophenol blue to observe at ×1000 magnification.

Figure 3 Cell size (µm) of four yeast strains in artificial media with 2 %, 10 %, 20 %, 40 %, and 60 % glucose (w/w). a: CICY-RN-035 (Metschnikowia koreensis). b: CICY-RN-209 (Sympodiomycopsis paphiopedili), both isolated from the floral nectar. c: CICY-RN-364 (Starmerella apicola). d: CI-CY-RN- 354 (Starmerella apicola 2), isolated from the honey of Melipona beecheii. The plot shows the 25th, 50th (median), and 75th percentiles.
Discussion
Growth was different between the four evaluated yeasts in response to glucose concentration and the type of yeast strain. Higher glucose concentration reduced growth in terms of culture density per microliter, growth rate, duplication time, and cell length. The strains with the highest culture density at high glucose concentrations were the strains isolated from honey, while those isolated from floral nectar had lower culture density at high concentrations.
The ability of microorganisms to grow at high solute concentrations is called osmotolerance (Blomberg and Adler 1992; Buzzini et al. 2018). This capacity is vital in yeast strains colonizing nectar and honey environments because it allows them to protect membrane function and maintain intracellular biochemical processes regardless of the low or high water availability in the sugary environments (Lachance et al. 2001; Lachance 2006; Pozo et al. 2015; Mittelbach et al. 2016). According to the results obtained in the present study, the M. koreensis strain has a wide tolerance range with respect to sugar concentration in its growth medium, so it can thrive in both nectar and honey. This agrees with previous reports in which this species has been observed in the following flower environments: in the nectar of T. stans (Bignoniaceae) which is high in glucose (48 %), in the flowers of Lilium sp. which has an intermediate glucose concentration in its nectar (19 %), and in the nectar of Ipomoea sp., which has nectar with a high sugar concentration (67 %) (Hong et al. 2001; Galetto and Bernadello 2004; Stolar and Davis 2010; Canto and Herrera 2012). The genus Metschnikowia includes several strains related to floral nectar and flowers. For example, the strains of M. reukaufii, M. gruessii, M. lachancei, and M. vanudenii tend to associate with bees in substrates such as honey and can grow in 40-60 % glucose concentrations (Giménez-Jurado et al. 2003; Brysch-Herzberg 2004). Culture density data for the strain of M. koreensis suggests that it can grow adequately in honey or concentrated nectars, meaning that the yeast can survive in environments with low water activity such as honey (aw = 0.53-0.67) as well as in environments with slightly higher water activity such as floral nectar (aw = 0.93-0.99) (Lievens et al. 2015).
The presence of a strain of S. paphiopedili in sugar-rich substrates associated with bees is rare, although the yeast was isolated for the first time from the nectar of the orchid Paphiopedilum primurinum (Sugiyama et al. 1991). The strain studied here was isolated from the floral nectar of D. aegyptius (32 %) but was found to grow at high glucose concentrations (e.g., 60 %), albeit in a significantly reduced manner. This yeast is unable to grow at relatively high glucose concentrations (50 %) (Sugiyama et al. 1991), and it prefers growth conditions with a moderate glucose concentration, such as the 32 % in D. aegyptius (Convolvulaceae) nectar (Canto and Herrera 2012). Sympodiomycopsis paphiopedili is a Basidiomycota yeast, a type rarely observed in floral nectar (Lachance 2006). Basidiomycota yeasts are more sensitive than Ascomycota yeasts to low water activity (high sugar concentration) in a growth medium (Tekolo et al. 2010; Mittelbach et al. 2015).
Results show that both strains of S. apicola 2 and S. apicola are osmotolerant strains that can maintain a constant growth rate at glucose concentrations of 40 and 60 %. For the strain of S. apicola this ability was first reported over sixty years ago (Hajsig 1958). Our results show that strains had similar growth pattern, exhibiting accelerated growth at a relatively low glucose concentration (20 %) and moderate growth at higher sugar concentration. Both strains were isolated from M. beecheii honey, which has a highsugar concentration (71-76 %) (Souza et al. 2006; Moo-Huchin et al. 2015). Conventional tests evaluating a microorganism’s ability to grow at high sugar concentrations (osmotolerance) only use a 60 % glucose concentration (Barnett et al. 2007). However, yeasts associated with sugary substrates such as floral nectar and honey confront varying sugar concentrations during movement between environments and can find themselves in concentrations gradually increasing to a maximum of up to 80 %. Although this study has the limitation of having simplified the gradient of sugar composition and concentrations that yeasts cope from floral nectar to honey environments, the most evident gradient is the stepped increase of sugar concentration due to the loss of water in the medium, similar to the sugar gradient tested here. The results contribute to elucidate how some types of strains can be found mostly in the flower substrates and others in the honey, and how the gradient of sugar concentration, from floral nectar to honey is acting as an ecological filter that leads to yeast strain specialization.
Cell length decreased as medium glucose concentration increased, independent of strain. This physiological response is expected in microorganisms growing in environments with high solute concentrations. Under these conditions, cells maintain a balance between intracellular solute concentration and that of the surrounding environment, causing cells to lose water by osmosis and reduce their volume (Rose 1975). Strains of Z. mellis from Apis mellifera honey reduced their cell size as the amount of sugar in the culture medium increased (Marvin et al. 1931). In another case, the yeast S. cerevisiae reduced cell volume in concentrated sodium chloride solutions, which was due to the loss of water in response to high osmotic pressure (Morris et al. 1983). The only evaluated strain that did exhibit a considerable reduction in cell length was the strain of S. paphiopedili. The reduction may be the result of differences in cell membrane lipid composition between Basidiomycota and Ascomycota, which could facilitate active transport in some species but not in others (Golubev et al. 2004). Even sugar composition (O’Brien and Ralph 1966) and cell wall lamellar structure (Kreger-Van Rij and Veenhuis 1971) differ between these two fungal divisions. Further research on these characteristics will help to understand how the membrane and cell wall are involved in fungal response to high sugar concentrations like those in floral nectar and honey.
The results obtained indicated that yeast strains isolated from floral nectar and from honey have different levels of osmotolerance, which can be interpreted as adaptive strategies to survive, proliferate, and even migrate between sugar environments. Although each of the four evaluated strains exhibited the ability to grow in, or migrate between environments with different glucose concentrations, all exhibited reduced growth as concentration increased. The different growth trajectories observed in each yeast strain suggest that they are specialized to grow in a specific sugar concentration favoring rapid growth and high cell densities. The two strains isolated in nectar grew best at low and moderate glucose concentrations, while the strains isolated in honey did so at relatively high glucose concentrations; the latter also experienced smaller reductions in cell size. These adaptations allow the strains colonizing honey to grow better at high sugar concentrations, reinforcing the idea that they are associated with bees; in this case, native stingless bees such as M. beecheii. These findings help to clarify which biological aspects are involved in the association of yeast strains with native bees and their food resources, such as honey and floral nectar. To better understand the functional role of the yeast strains capable of colonizing sugary flower and bee-related environments in bee and plant life, future research involving more strains both isolated from floral nectar and honey is necessary.

