


 nova página do texto(beta)
 Inglês (pdf)
 Artigo em XML
 Referências do artigo
 Enviar este artigo por email
 Citado por SciELO
  Similares em
SciELO
Similares em
SciELO 
 Permalink
Introduction
Soil micromycetes critically affect ecosystems by participating in the degradation of soil organic matter and nutrient cycling. They also play an important role in soil trophic chains as a basic food source for fungivorous organisms as mites, springtails, and earthworms (Dighton, 2003). Micromycetes are mainly distributed in the superficial soil horizons and the rhizosphere zone, representing a high percentage of the total microbial biomass in soil (Swift et al., 1994). Because microfungi synthesize different kind of enzymes, along with macromycetes, bacteria, actinomycetes, and soil mesoand macrofauna, they participate to the decomposition of plant and animal remains, thereby contributing toward the elimination of organic wastes generated by ecosystems and nutrient recycling. During decomposition, micromycetes also liberate several minerals in soluble form, such as inorganic ions that can be more easily absorbed by plant roots, therefore supporting the fertility of ecosystems (Dighton, 2003).
Despite the ecological importance of soil saprobic micromycetes, there are very few studies addressing their diversity in tropical and semitropical forests. Tropical montane cloud forests (TMCF) exhibit a high diversity of plant species and communities, as a result of high humidity and mild temperatures that create favorable conditions for the coexistence of temperate and Neotropical flora (Rzedowski, 1996). Impressively, even though TMCF only covers 0.8 % of Mexico, it contains 10 to 12 % of all plant species recorded in Mexico, including 2,500 endemic plant species. Therefore, TMCF is considered the most diverse type of vegetation per unit area (Rzedowski, 1996). TMCF has an enormous value not only because of its high biodiversity and associated uses, but also because of the important ecosystem services that it provides, such as carbon capture, water catchment, water purification, erosion control, and sediment control in rivers.
These forests also provide regulating services, preventing or mitigating natural disasters such as landslides and flooding that affect large areas in Mexican lowlands (Bruijnzeel and Hamilton, 2001). Unfortunately, TMCF is the most threatened ecosystem in the world, with more than half of its area that has been transformed to other land uses. In Veracruz, Mexico, TMCF has mostly been modified or disappeared because of human settlements and the establishment of agricultural crops. Human activities and disturbances, such as habitat destruction, urban development, industrialization, agriculture, contamination, and pesticide use, can potentially affect the fungal diversity of these forests (Tsui et al., 1998). Given this context, the aim of the present study was to analyze the diversity and community structure of cultured saprobic filamentous soil fungi in four TMCF fragments with distinct landscape quality.
Materials and methods
Study area
The study was carried out in the Coatepec-Huatusco region, in the center of Veracruz, Mexico (elevation 1,500-2,100 masl). The average annual rainfall in the region varies between 1300 and 2200 mm, and the average annual temperature ranges from 12 to 19 ºC. Typically, there are three defined seasons: a relatively dry and temperate season from October to March (with cold northerly fronts), a dry and warm season from April to May, and a humid and warm season from June to October (Williams-Linera, 1997).
Four tropical TMCF fragments were selected in the central region of Veracruz. The soil type was classified as umbric andosol. The soil physico-chemical characteristics of the four study plots were determined following the protocols described in Geissert and Ibañez (2008) (Table 1). The composition of tree species is similar between the plots, although species dominance changes from one fragment to another (Williams-Linera and López-Gómez, 2008; García-de la Cruz et al., 2013) (Table 1).
Table 1. Study sites. Tropical montane cloud forest (TMCF) fragments in the central region of Veracruz. Soil physicochemical properties (organic carbon, available phosphorus (P), organic matter (OM) (gr/kg), soil pH, carbon-nitrogen ratio (C/N), Nitrogen (N), elevations and relief in the study sites. Index landscape quality and tree composition
| TMCF | OC | Available | OM | PH | C/N | N | Elevation | Relief | Landscape | Tree |
| Study sites | (G KG-1) | p | (GR/KG) | (GR/KG) | Masl | Quality | Composition | |||
| key | (mg/kg) | |||||||||
| Tropical montane cloud forest 1 MIRADOR | 30.08 | 1.75 | 6.8 | 5.16 | 12 | 2.86 | 1900 | Hills of moderate to strong slope | 276 | Eriobotrya japonica, Quercus sartorii, Tapirira mexicana, Trema micrantha, Zinowiewia integerrima. |
| Tropical montane cloud forest 2 SANTUARIO | 68.3 | 1.5 | 11.78 | 5.82 | 13.4 | 5 | 1500 | Hills of moderate to strong slope | 230 | Carpinus caroliniana, Clethra mexicana, Liquidambar styraciflua, Myrsine coriacea, Quercus xalapensis, Senecio arborescens, Turpinia insignis. |
| Tropical montane cloud forest 3 MASCOTA | 47.67 | 2.22 | 24.9 | 3.97 | 10.7 | 4.37 | 2000 | Steeply sloping canyon slope | 275.6 | Alchornea latifolia, Clethra mexicana, Quercus affinis, Quercus leiophylla y Quercus salicifolia, Liquidambar styraciflua, Turpinia insignis. |
| Tropical montane cloud forest 4 CAÑADAS | 41.33 | 0.1 | 10 | 4.53 | 9.9 | 4.05 | 2100 | Steeply sloping canyon slope | 280.2 | Beilschmiedia mexicana, Brunellia mexicana, Hampea integerrima Quercus insignis, Quercus leiophylla, Quercus sartorii, Styrax glabrescens, Turpinia insignis, Tapirira mexicana. |
Soil physicochemical properties, according to Geissert and Ibañez (2008)
Index landscape quality to López-Barrera and Landgrave (2008)
Elevations to Williams-Linera et al. (1997)
Tree composition to Williams-Linera and López-Gómez (2008); García-De La Cruz et al. (2013)
Sampling design
Two surveys (May and September 2017) were carried out in the four TMCF sites. At each site, five sampling points separated by 50 m (to ensure their independence) were chosen. To avoid edge effects, a distance of at least 100 m was placed between sampling points and the nearest road. The center of each sampling point was a tree. From these central points, two 1-m perpendicular axes were marked. At the ends of each axis, a 100 g soil sample was taken from a depth of 0-10 cm. In the laboratory, at room temperature (26 °C) the four soil samples of each sampling point were mixed to obtain a compound sample. The soil was dried at ambient temperature (26 °C) to remove excess water and stored at 5 ºC for 5 d until processing for isolation of fungi. In total, 40 compound samples (4 sampling sites × 5 sampling points × 2 samples) were analyzed.
Isolation, quantification, and identification of saprobic filamentous microfungi
To detect and isolate microfungi, we used a soil particle filtration technique (Bills et al., 2004). Fifty soil particles from each compound sample were sown in dichloran rose-bengal chloramphenicol (DBRC) agar in 10 Petri dishes (50 particles × 5 points = 250 particles × 4 sites = 1000 particles per survey × 2 surveys = a total of 2000 inoculated particles).
The Petri dishes containing the particles were incubated for 15 d. All emerging colonies were quantified and transferred to tubes with potato dextrose agar (PDA) culture medium for subsequent quantification and identification. For each species, semi-permanent slide preparations were made in lactic acid. Morphological identification was performed using taxonomic keys and specialized literature (Domsch et al., 1980; Gams and Bissett, 1998). Non-fruiting fungal colonies were quantified and classified as sterile mycelia.
Analysis of variables
For each survey, species accumulation curves were calculated to compare the richness of filamentous fungi among forest fragments and to estimate the specific richness per fragment and at the landscape level using the non-parametric Jackknife 1 and bootstrap richness estimators. The following variables were calculated to evaluate and compare the diversity of saprobic filamentous soil fungi among sites: a) total abundance of colonies, calculated as the total number of colonies isolated from 250 soil particles (50 particles × 5 sampling points = 250 × 2 surveys = 500 particles per site); b) relative abundance (RA %) of each species, calculated by dividing the number of colonies of a given species by the total number of isolated communities from a given site, and multiplying the result by 100; c) frequency of occurrence (FO %), calculated as the number of sampling dates on which a given species was isolated divided by the total number of sampling dates, multiplied by 100; d) species richness (S), equivalent to the total number of species present in each site; e) species diversity according to the Shannon-Wiener (H´) index; f) equitativity, calculated by dividing the Shannon diversity index by the logarithm of the number of taxa. These calculations were performed in the PAST software (ver. 1.84) (Hammer et al., 2001).
To determine dominance patterns, Whittaker (abundance-dominance) curves were calculated for each site; the total abundance of each species was plotted against the range of species (ordered from highest to lowest abundance). To detect differences in the abundance, richness, and diversity of species among sites, one-way analyses of variance (ANOVAs) were conducted after checking requirements for normal distribution and homogeneity of variance of data using Kolmogorov-Smirnov and Bartlett’s tests, respectively. When the effects of these latter factors were shown to be significant by the ANOVAs, paired Tukey HSD post hoc tests were performed. These analyses were conducted in the Statistical software (ver. 7). Complementarity between sites was estimated in the PAST software (ver. 1.84) using the Bray-Curtis index based on abundance data. A simple linear regression was performed in Statistical (ver. 7) to understand the relationships between species abundance, richness, and diversity and the landscape quality index (within a 2-km radius of each site) and physico-chemical soil characteristics of the sites.
Results
Species richness
In the four TMCF sites, 233 species from 51 genera were recorded, 95 sterile strains and 11 Xilarial type strains. The largest and the fewest number of species were found at the MASCOTA site (MS) and SANTUARIO site (SS), representing 45 and 25 % of the total number of species recorded respectively (Table 2). According to the Jackknife 1 and bootstrap estimators, the species inventory at the landscape level represented 52-64 % of the expected morphospecies. The estimators confirmed that 57 species (Jackknife 1) to 133 species (bootstrap) are missing from the inventory (Table 2). The accumulation curves for the morphospecies did not stabilize for any of the TMCF fragments (Figure 1). With respect to species richness per site, the MS and SS had the highest (107 spp.) and the lowest (60 spp.) species richness respectively. Statistical analyses showed significant differences (F= 4.58, p= 0.008) in species richness among sites (Table 3).
Table 2. Observed and estimate species of saprobic filamentous microfungi in four tropical montane cloud forest (TMCF) fragments of central Veracruz, Mexico
| TMCF | Observed species | Estimate species | Estimate species | Inventory |
| Study sites | Jack 1 | Boostrap | % | |
| MIRADOR | 99 | 173 | 125 | 79% |
| SANTUARIO | 60 | 105 | 78 | 77% |
| MASCOTA | 107 | 179 | 137 | 78% |
| CAÑADAS | 93 | 160 | 120 | 77% |
| LANDSCAPE | 233 | 370 | 294 | 80% |
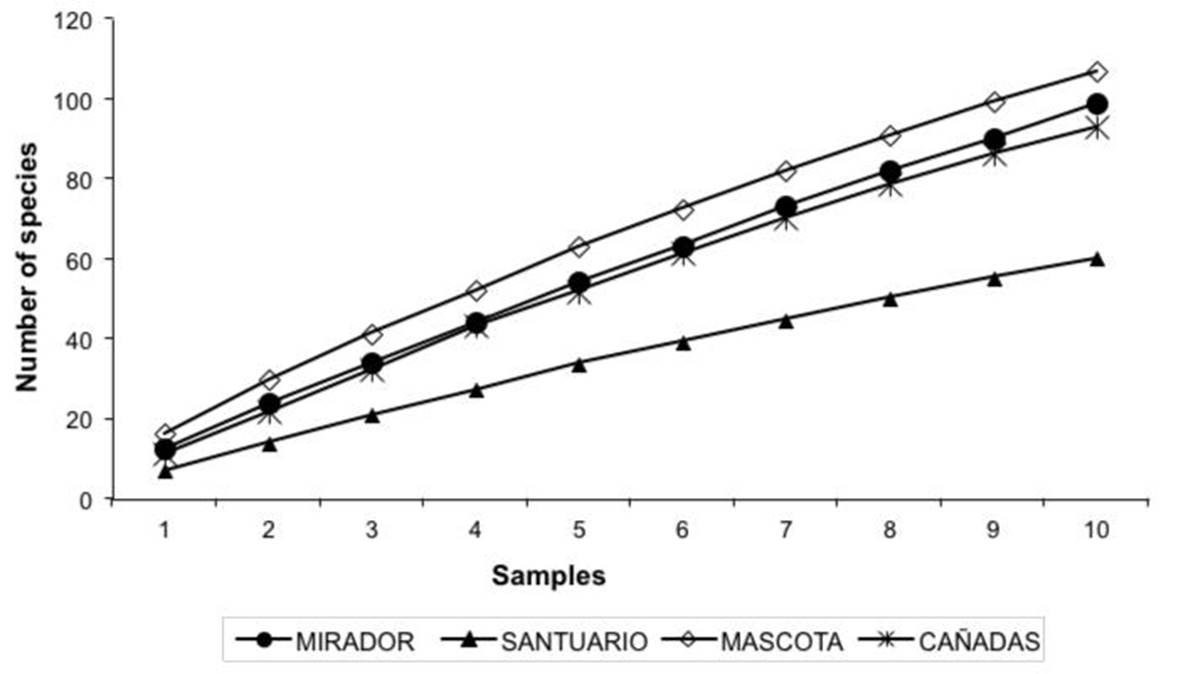
Figure 1. Accumulation curves of observed species from the assembly of saprobic fungi in four fragments of tropical montane cloud forest in Veracruz state, Mexico.
Table 3. Abundance* (number of colonies isolated to 250 soil particle), Richness **, diversity ** (Shannon Index H´) and equitativity** of saprobic filamentous microfungi in four tropical montane cloud forest fragments of central Veracruz, México. s.d (Standar deviation)
| Forest | Abundance | Richness | Diversity (h’) | Equitativity | ||||
| fragment | Total | Average±s.d | Total | Average±s.d | Total | Average±s.d | Total | Average±s.d |
| MIRADOR | 184 | 18.43 ± 8.87 ab | 99 | 13.2 ± 5.86 a | 4.2 | 2.37 ± 0.49 a | 0.93 | 0.96± 0.02 a |
| SANTUARIO | 108 | 10.8 ± 3.93 b | 60 | 7.3 ± 2.3 b | 3.6 | 1.78 ± 0.44 b | 0.90 | 0.91± 0.13 a |
| MASCOTA | 217 | 21.9 ± 7.26 a | 107 | 14.8 ± 4.51 a | 4.3 | 2.52 ± 0.27 a | 0.95 | 0.95± 0.03 a |
| CAÑADAS | 155 | 15.5 ± 9.66 ab | 93 | 11.5 ± 5.52 b | 4.2 | 2.20 ± 0.48 b | 0.94 | 0.96± 0.04 a |
*Average of ten replicates in two sampling.
** Average of ten replicates in two sampling.
† Shared superscripts (a, b) by study sites indicate no signifiicant differences between them (p≤ 0.05).
Abundance and dominance patterns
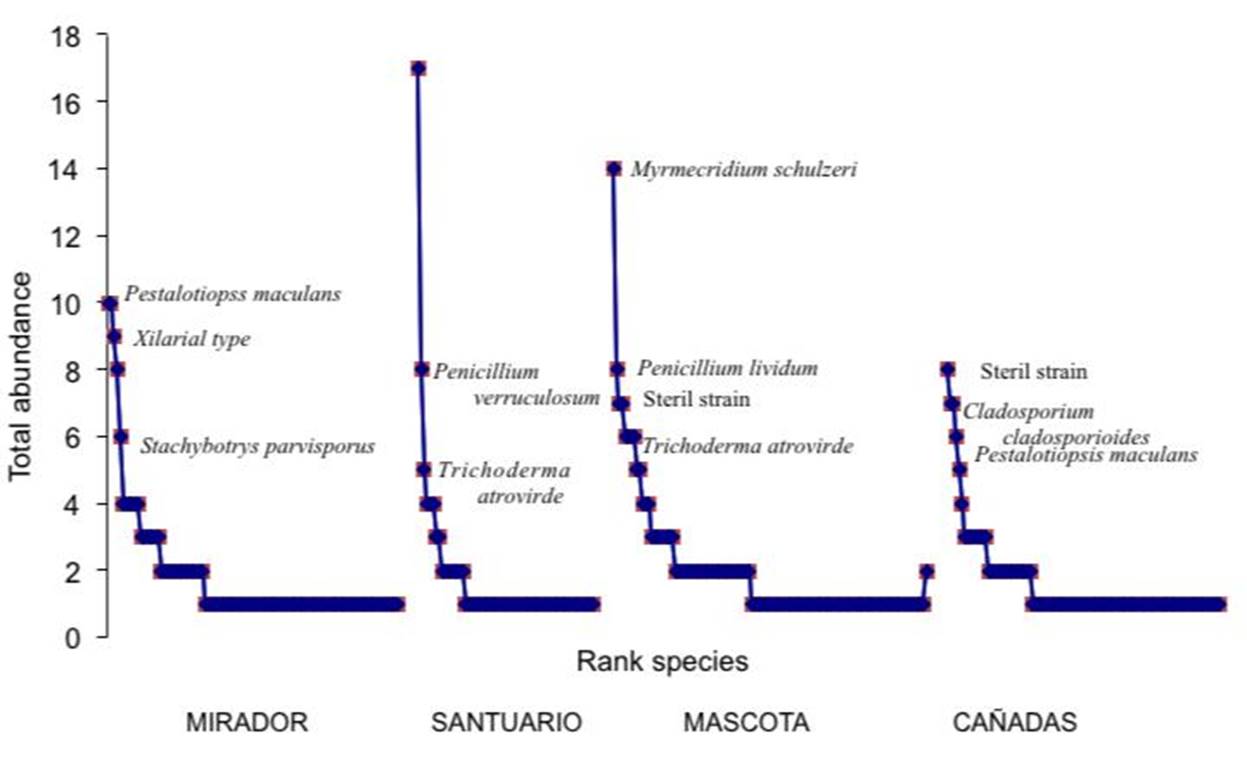
The slopes of the abundance-dominance curves of the MIRADOR (MIS) and CAÑADAS sites (CS) are similar and less pronounced than those of the SS and MS (Figure 2). No species maintained the same position in the hierarchical order of dominance across the four forest fragments. Talaromyces flavus was abundant at the SS, whereas Myrmecridium schulzeri was abundant at the MS. Trichoderma atroviride and a sterile strain (53) were abundant at the SS, MS, and CS. Pestalotiopsis maculans was abundant at the MIS and moderately abundant at the CS. The majority of species were rare (68 %). Forty-seven percent were singletons (single individuals), and 20 % were doubletons (two individuals) (Figure 2). The total abundance of colonies varied from 108 to 217. Significant differences in total abundance were found among sites (F= 3.67, p= 0.02), with the highest abundance corresponding with the MS and the lowest with the SS (t= 0.014) (Table 3).
Diversity and equitativity
The diversity index for the four forest fragments ranged from 3.6 to 4.3, significantly varying among fragments (F= 5.36, p= 0.003). The highest value was found at the MS (Table 3), which significantly differed (ANOVA; F= 5.36, p= 0.003) from the SS (F= 5.36, p= 0.003). The equitativity among sites ranged from 0.90 to 0.94, without significant differences among sites (F= 0.93, p= 0.43) (Table 3).
Frequency of occurrence
In terms of distribution at the landscape level, the following species were detected across all sites in at least one of the two surveys: M. schulzeri, P. maculans, T. atroviride, V. nigra, T. cremeum, F. solani, C. terrestris, and P. olsoni (Table 4). The percent relative abundance of the species ranged from 2.9 to 76.5 % (Table 4). A high percentage of the species presented values lower than <5 %. Species with values between 10 and 16.7 % in at least one survey included Fusarium poae, F. tricinctum, T. cremeum, and T. koningii. With respect to frequency of occurrence, the following categories were established for the species: very frequent (FO= 100 %), frequent (FO= 75 %), occasional (FO= 50 %), and sporadic (FO= 25 %). Most of the micromycetes isolated were sporadic (153 spp., 64.5 %); some were occasional (55 spp., 23.2 %), and few frequent (16 spp., 6.7 %) or very frequent (12 spp., 5.06 %).
Table 4. Frequency of occurrence % (Fr) and relative abundance average of the saprobic filamentous microfungi found at the study sites over the survey. *Only strains identified at the species level are included
| Species | Fr | mis | ss | ms | cs | Species | Fr | mis | ss | ms | cs |
| Acremonium chryrosogenum | 25 | - | - | - | 0.3 | Fusarium poae | 25 | - | - | - | - |
| Acremonium kiliense | 50 | - | - | - | 0.5 | Fusarium semitectum | 25 | - | - | - | - |
| Acremonium murorum | 50 | - | - | 0.8 | 0.8 | Fusarium solani | 100 | 1.3 | 1.1 | 0.4 | 1.4 |
| Acremonium potronii | 25 | - | - | - | - | Fusarium solani var. coeruleum | 25 | - | - | - | - |
| Acremonium roseolum | 50 | 1.1 | - | - | - | Fusarium stilboides | 25 | 0.4 | - | - | - |
| Acremonium strictum | 25 | - | - | - | - | Fusarium trichothecioides | 25 | - | - | - | - |
| Aspergillus niveus | 25 | - | 2.2 | - | - | Geomyces pannorum | 50 | - | - | 0.7 | 0.4 |
| Aspergillus ochraceus | 25 | - | - | 0.8 | - | Geotrichum candidum | 75 | 0.5 | - | - | - |
| Aspergillus versicolor | 25 | - | - | - | - | Gliocadium penicilloides | 25 | - | 1.4 | - | - |
| Beauveria bassiana | 50 | - | - | - | - | Gliocadium solani | 50 | - | - | 0.4 | - |
| Chaetomium ampullare | 25 | - | - | - | - | Gonytrichum macrocladum | 25 | - | 0.8 | - | - |
| Chaetomium aureum | 25 | - | - | - | - | Hypoxilon serpens | 25 | - | - | - | 0.4 |
| Chaetomium fumicola | 25 | - | 0.8 | - | - | Hypoxilon serpens var. serpens | 25 | - | - | - | - |
| Chaetomium globosporum | 25 | - | - | - | - | Marianaea elegans | 50 | 2.5 | - | - | 2.5 |
| Chaetomium robustum | 50 | - | - | 0.7 | - | Metharrhizium anisoplae | 25 | - | - | - | - |
| Chloridium chlamydosporis | 50 | - | - | - | - | Metharrizium marquandie | 50 | 2.0 | - | - | 1.4 |
| Chrysosporium serpens | 25 | - | - | 0.7 | - | Monocillium indicum | 25 | - | 0.6 | - | - |
| Cladosporium cladosporioides | 50 | - | 0.8 | - | - | Mortierella vinosa | 25 | - | 1.7 | - | - |
| Cladosporium sphaerospermum | 50 | 1.1 | 1.7 | - | - | Myrothecium roridum | 50 | 0.6 | 1.4 | - | - |
| Cordana oblongispora | 25 | 0.6 | - | - | - | Myrmecridium schulzeri | 100 | 1.5 | 0.8 | 1.8 | 0.4 |
| Cordana pauiceptata | 25 | - | - | - | - | Nectria haematococa | 25 | 0.4 | - | - | - |
| Cylindrocarpon oidium | 25 | - | - | 1.6 | - | Neosartoria fischeri | 100 | - | - | 0.4 | 0.5 |
| Eladia saccula | 25 | - | 0.7 | - | - | Oidiodendron tenuisinum | 25 | - | 1.4 | - | - |
| Eupenicillium ludwigii | 25 | - | 0.8 | - | - | Paecillomyces clavisporus | 25 | - | - | - | - |
| Eurotium chevalieri | 25 | - | - | - | - | Paecilomyces carneus | 25 | - | - | - | 0.8 |
| Fusarium decemcellulare | 50 | 0.5 | 4.5 | - | - | Paecilomyces clavisporus | 50 | 0.7 | - | - | - |
| Fusarium fusaroides | 25 | 0.6 | - | - | - | Paecilomyces griseoviridis | 25 | - | - | 1.8 | - |
| Paecilomyces hawaiiensis | 25 | - | - | - | - | Scopularopsis brumptii | 25 | - | - | 0.8 | - |
| Paecilomyces lillacinus | 50 | 0.8 | - | - | - | Sesquicillium candelabrum | 50 | - | - | - | - |
| Penicillium brevicompactum | 50 | - | - | 0.6 | - | Sporotrix schenckii | 25 | - | - | - | 0.4 |
| Penicillium citrinum | 25 | - | - | 0.4 | - | Stachybotris albipes | 25 | - | - | 0.8 | - |
| Penicillium decumbens | 75 | - | 1.5 | 2.9 | 0.5 | Stachybotris parvisporus | 75 | 5.1 | - | 0.9 | 2.5 |
| Penicillium duclauxii | 25 | - | - | - | - | Talaromyces flavus | 75 | 0.6 | 3.6 | - | - |
| Penicillium fellutanum | 50 | 0.7 | - | 1.9 | - | Talaromyces intermedius | 25 | - | - | 1.2 | - |
| Penicillium glandicola | 75 | 0.7 | - | 0.4 | 1.4 | Talaromyces trachysperum | 25 | - | - | - | 0.7 |
| Penicillium implicatum | 50 | 0.5 | - | 1.2 | - | Talaromyces udagawae | 25 | - | - | 2.1 | - |
| Penicillium islandicum | 25 | - | - | - | 1.4 | Talaromyces wortmanii | 25 | 0.6 | - | - | - |
| Penicillium italicum | 50 | - | 2.2 | - | - | Torula herbarum | 25 | - | - | 1.1 | - |
| Penicillium lividum | 75 | - | - | - | - | Trichoderma anam. Podostroma alutaceum | 25 | - | 0.7 | - | - |
| Penicillium melinii | 50 | 0.6 | - | - | - | Trichoderma atrovirde | 100 | - | 3.6 | 2.5 | 2.8 |
| Penicillium olsoni | 100 | - | 0.6 | - | 1.5 | Trichoderma cremeum | 100 | 0.4 | - | 0.8 | 0.9 |
| Penicillium restrictum | 25 | 0.5 | - | - | - | Trichoderma hamatum | 25 | - | - | 1.4 | - |
| Penicillium rugulosum | 50 | - | - | - | 1.4 | Trichoderma harzianum | 75 | - | 0.8 | - | 0.9 |
| Penicillium verruculosum | 75 | - | 7.3 | 0.4 | - | Trichoderma koningi | 25 | - | - | - | 0.3 |
| Penicillium vulpinum | 50 | - | - | - | 0.5 | Trichoderma longipiles | 25 | - | - | 0.7 | - |
| Pestalotiopsis maculans | 100 | 3.0 | 0.8 | 0.8 | 1.7 | Trichoderma oblongispora | 75 | - | 1.1 | 0.4 | - |
| Pestalotiopsis uvicola | 25 | - | - | - | - | Trichoderma pseudokoningii | 25 | - | - | - | - |
| Phialocephala phycomyces | 25 | - | - | - | - | Trichoderma strictipitis | 50 | - | - | 0.7 | - |
| Phialophora mustae | 25 | - | - | 0.7 | - | Trichoderma viride | 50 | - | - | 0.7 | - |
| Phialophora richardsiae | 75 | 0.4 | - | 0.8 | 0.3 | Verticilliu suchalsporium | 50 | - | - | 2.0 | - |
| Pseudobotrytis terrestris | 100 | 0.6 | - | - | 2.5 | Verticillium alboatrum | 25 | - | - | 0.4 | - |
| Pyrenochaeta unguis | 50 | 0.7 | - | 0.7 | - | Verticillium fungicola | 75 | 0.4 | 0.8 | - | 0.5 |
| Sagenomella diversispora | 25 | - | - | - | - | Virgaria nigra | 100 | 2.2 | 1.5 | 0.7 | 0.3 |
| Scopularipsis brevicaulis | 50 | - | - | - | 0.7 |
Complementarity among sites
The complementarity between the four sites was extremely high. The values of the complementarity index ranged from 68 to 84 %, with an average of 74.89 % (Table 5). The highest complementarity (greatest difference in fungal composition) was found between the MIS and SS (84.2 %). The lowest degrees of complementarity (greatest similarity in fungal composition) were found between the MIS and CS (68.7 %) as well as between the MS and CS (68.5 %) (Table 4). The MIS and MS had the greatest number of shared species (39). Forty-five percent of the species at the MS were exclusive (49 spp.). Meanwhile, 37 and 38 species were exclusive to the MIS and CS respectively, and 26 species to the SS (Table 5).
Table 5. Complementary matrix in the composition of saprobic fiilamentous microfungi calculated by the Bray Curtis index (above diagonal) and number of species shared (under diagonal) in the study sites
| Tmcf | Mirador | Santuario | Mascota | Cañadas |
| Study Sites | ||||
| MIRADOR | 99/38 | 15.75 | 26.3 | 31.27 |
| SANTUARIO | 21 | 60/26 | 22.0 | 24.3 |
| MASCOTA | 39 | 24 | 107/49 | 31.55 |
| CAÑADAS | 36 | 22 | 33 | 93/37 |
Numbers in black indicate the total number of species for each site/ exclusive species. The percentages of complementarity that vary from zero, when both fragments are identical in species composition, up to 100, when the species of both fragments are completely different, down the number of shared species.
Relationship of abundance, species richness, and species diversity with landscape quality and soil physico-chemical characteristics
In the simple regression analyses, a significant relationship was only found between the diversity of saprotrophic filamentous fungi and the landscape quality index, indicating that a greater diversity of morphospecies was found as the landscape quality increased (p= 0.018) (Figure 3). Some interesting tendencies were observed between soil pH and morphospecies diversity (p= 0.14), abundance (p= 0.16), and richness (p= 0.14), even though the results were not significant (Figure 3).

Discussion
Fungi are important components of the biodiversity of tropical forests. The colonization and decomposition of soil organic matter are performed by a wide range of microorganisms, yet fungi and bacteria play a particularly important role in nutrient recycling. The overview of studies on soil fungal diversity largely depends on the techniques used to detect fungal communities. The soil particle filtration technique is widely used because it favors the isolation of fungi whose hyphae are associated with soil particles and, therefore, are active in soil (Bills et al., 2004). Soil washing generally eliminates the spores of rapid-growth fungi and allows slow growing species to be expressed. However, fungi are nutritionally diverse, so there is not a single cultivation medium appropriate for all fungal species. In addition, many isolated fungi may require natural substrates to form fruiting bodies, complicating taxonomic identification by traditional methods (Bills and Polishook, 1994). Considering these limitations, molecular techniques would be of great assistance in identifying isolated fungal strains. Thus, a detailed morphological description was made of each of the 104 sterile strains, and their abundance was quantified in each survey. In this way, all the isolates were accounted for enabling calculation of the evaluated parameters.
Most of the studies on saprobic soil micromycetes in primary ecosystems have been carried out in temperate regions, as coniferous forests in Canada (De Bellis et al., 2007), the United States (Gochenaur, 1978), and China (Cheng et al., 2015). Fewer studies have been carried out in Africa (Persiani et al., 1998), Malaysia (Varghese, 1972; Bettuci and Roquebert, 1995), Brazil (Pfenning, 1997), and India (Panda et al., 2010; Saikia and Joshi, 2012; Chandini and Rajeshwari, 2017).
The present study demonstrated the high richness of saprotrophic soil fungi in TMCF in Mexico. A total of 233 species were identified from 666 isolates. Most studies on saprobic soil micromycetes in tropical forests have reported a smaller number of taxa, except for Persiani et al. (1998), who reported 519 species in a forest along the Ivory Coast. Previous studies recorded 38 species in Malaysia (Varghese, 1972); in India 63 species (Saikia and Joshi, 2012), 81 species (Chandini and Rajeshwari, 2017) and 118 species (Panda et al., 2010) and 80 species in a tropical forest of Brazil (Pfenning, 1996). In recent years, DNA sequence-based methods have been used to survey soil fungal diversity of various terrestrial ecosystems, including forests; He et al. (2017) recorded 7501 OTU, 43 % were saprobic fungi. Shi et al (2014) detected 7630 OTUs, saprobic fungi representing 80 % of these. Bueé et al. (2009) recorded an average of 830 fungal operational taxonomic units (OTUs) per site in temperate forest.
Soil is an important habitat because it shelters a wide diversity of species and provides a wide variety of important environmental services. At the landscape level, the representativeness of the inventory was 52 to 64 % according to the richness estimators (Jackknife 1 and bootstrap). For each site, the representativeness of the inventories ranged from 42 to 79 %. Overall, the inventories of all forested sites and each forested site included more than 50 % of the estimated species. We consider that the sampling effort allowed to detect an overview of the composition of the soil fungal community. Molecular methods offer the prospect of a more thorough documentation of diversity. However, while numerous recent studies (Buée et al., 2009, Jumpponen and Jones 2009) have utilized high‐throughput sequencing to examine various aspects of fungal biodiversity, these studies have failed to saturate a sampling (rarefaction) curve.
In this study the community of soil fungal species in the TMCF fragments presented a Raukier pattern: few species were abundant, and many species were uncommon or had low abundances. A group of species common to cloud forests were detected in all fragments: M. schulzeri, P. maculans, T. atroviride, V. nigra, T. cremeum, F. solani, C. terrestris, A. fischeri, and P. olsoni. However, these species were not always the most abundant. The most abundant species were T. flavus at the SS, M. schulzeri at the MS, and P. maculans at the MIS. Talaromyces flavus has been frequently observed in North America, Europe, and Australia (Beuchat, 1986). Its ascospores can reportedly survive high temperatures. Pestalotiopsis maculans is a common and abundant habitant in the leaf litter of some TMCF trees in Mexico (Heredia et al., 2000) and Costa Rica (Bills and Polishook, 1994). The presence of this latter microfungi at all the studied sites shows that it can successfully grow from the leaf litter through the first soil horizons. Myrmecridium schulzeri, a lignicolous ascomycete that represents the imperfect state of the genus Ophiostoma, is associated with the decomposing wood of different TMCF tree species.
Different studies suggest that fungal diversity is greater in tropical regions than temperate regions (Suryanarayanan et al., 2009). In tropical forests, employing traditional survey methods there have been reported diversity index (H´) values of 1.8 (Grantina, 2011), 2.4-2.5 (Saravanakumar and Kaviyarasan, 2010), 3.4 (Devi et al., 2012), 3.1-3.5 (Satish et al., 2007), 3.7 (Banakar et al., 2012), and 4.1 (Panda et al., 2007). Devi and Dkhar (2014) reported H´ values of 2.7 for fungi in an Indian forest with similar vegetation and altitudinal characteristics as cloud forest. Comparatively, the fungal diversity index in the present study ranged from 3.6 to 4.3, confirming the high species diversity of the studied TMCF.
Of the 233 species detected, the MS had the highest number (107 spp.), followed by MIS (99 spp.), CS (93 spp.) and, finally, SS (60 spp.). With respect to beta diversity, the study sites presented a high richness, diversity, and equitativity of filamentous saprotrophic fungal morphospecies at the regional level. In addition, high morphospecies complementarity and high morphospecies turnover among the fragments was found. This may be related with the degree of alteration of the sites reflected by the amount of open areas and the landscape quality. In particular, the SS had the lowest diversity. López-Barrera and Landgrave (2008) assigned this latter site a low value on the landscape quality index, while the rest of the fragments were considered high quality. The landscape quality index considered a 2-km radius around each point and contemplated open areas and areas without vegetation cover in addition to incipient, intermediate, and dense shade, which may be interpreted to correspond with certain types of vegetation.
The qualitative and quantitative differences in fungal populations between fragments indicate that vegetation and proximity to urban areas influence the micro-fungal populations of the soil. Disturbances to soil and vegetation could be a determining factor of the lower fungal count at the disturbed forest site (SS). Liu et al. (2016) reported that soil microbial diversity decreased with increasing disturbance. Carney and Matson (2006) showed evidence of the human alteration of soil microbial communities via the modification of plant community composition and diversity. On the other hand, high plant diversity also has a strong impact on the soil microbial community, mainly because of increased plant production (Liu et al., 2016).
Environmental factors that influence plant and animal distribution have been more widely studied than those that control the patterns of distribution and community composition of soil microorganisms (Rousk et al., 2010). Regarding the microbial communities, McCulley and Burke (2004) found that plant species composition, soil type, seasonal variability, temperature, and availability of organic substances are primarily factors that controlled them. Meanwhile, saprophytic fungi are sensitive to soil conditions, pH, texture, moisture, and oxygen level (Setala and McLean, 2004).
Contrary to what we expected, in this study we didn’t found any significant correlation (p>0.05) between the physico-chemical soil parameters and the diversity, richness, and abundance of saprobic fungi. However, some interesting tendencies were observed for soil pH, which influenced the abundance, richness, and diversity of saprobic fungal species (70 % related), although not significantly (p= 0.14, p= 0.16, p= 0.14 respectively). Specifically, abundance, diversity, and richness were higher in the sites with a pH of around 4-5 (CS, MIS, and MS) and lower in the SS, with a pH fluctuating around 6. The impact of pH on soil microbial communities has been widely described in previous studies. Generally, studies on fungal biomass have shown that lower pH tends to favor fungal development (Rousk and Nadkarni, 2009). In a boreal forest, Högberg et al. (2007) observed that fungi strongly decreased as the range of soil pH increased. Pennanen et al. (1998) also found that fungal growth increased at pH values of lower than 4 in forest soil, and similar findings were reported by Banakar et al. (2012). The results described herein estimate the composition and diversity of the soil fungal community in four TMCF sites. The findings clearly reveal that TMCF soil in the central region of Veracruz, Mexico, exhibits a high richness, diversity, and equitativity of saprobic filamentous fungal species, as well as a high turnover rate and high number of exclusive species. Greater knowledge of the ecology of soil fungal communities can enable the development of strategies to conserve native saprobic species or to use them for bioprospecting industrially important enzymes or biomolecules.

