


 nueva página del texto (beta)
 Español (pdf)
 Artículo en XML
 Referencias del artículo
 Enviar artículo por email
 Citado por SciELO
  Similares en
SciELO
Similares en
SciELO 
 Permalink
The break-even point is one of the most used tools when carrying out financial analysis in order to make the most appropriate business decisions, the calculation and result of this tool is used to determine the economic amount in sales and the volume of units of products or necessary services to cover operating expenses and variable costs, showing its result that there is no profit or loss in the business activity, thus achieving the operating break-even point.
The calculations necessary for profitability are made based on the assumption of the expected normal level of operations of a project, which is why the calculation considers the normal use of installed capacity, but the entrepreneurs know that normal capacity is rarely used, or total in the actual operations of the Project. The uncertainty related to internal supply and external demand forces entrepreneurs to ask themselves: What happens if the project is not executed at the assumed capacity level? Will the project be in a position to at least recover its costs? Among others, these risk-induced questions motivate the calculation of the breakeven point (Satya & Deshpande, 1982).
The historical background of the break-even point as a tool that is part of the financial analysis for decision-making in organizations can be found in an accumulation of works carried out by various authors, highlighting the following among others:
Henry Hess (1903), who graphically raised the relationship between utility, cost, volume and price, capturing it through the "crossing point graph" (cross over chart).
Knoeppel & Seybold (1918) reflected in his book, Graphic Production Control, the classification between fixed and variable costs of the company. Until the 1960s some authors still referred to this representation as: Knoeppel graph.
Walter Rautenstrauch (1930), in his book: The Successful Control of Profits, uses the name break-even point to describe the relationships of cost, volume, price and profit. In his book too, he gives a detailed explanation of its use for decision-making in the company.
In the investigation carried out by Fordon (1951), mention is made of the Graph of Results (profit-volume graph). As a consequence of this graph, in the 1970s the denomination began to be used: Palanca Operativa (Operating Leverage), named after its similarity of the graph with a lever.
At present, in financial analysis and in decision-making by organizations, the break-even point tool is used very frequently in its classification as operational break-even point and financial break-even point.
The operating break-even point is a financial ratio used to measure the degree of operating leverage that a company has. The objective of the calculation of the operating break-even point is to determine the amount of sales or income sufficient to cover the fixed operating expenses and the variable costs in a project or an organization.
The financial break-even point is a financial ratio that is used to measure the degree of financial leverage that a company has. The objective of calculating the financial break-even point is to determine the amount of sales or income sufficient to cover fixed expenses, variable costs and the cost or interest generated by the debt contracted to support the tangible and intangible investments in a project or a company. organization.
Economic and financial indicators are useful tools that benefit organizations by facilitating timely and appropriate decision-making in relation to their corporate and financial strategies.
Next, the evolution of some economic and financial indicators of the Mexican environment is described and shown to facilitate decision-making related to personal and business strategies in an integral manner.
National Consumer Price Index (INPC, Spanish)
The Price and Quotation Index of the Mexican Stock Exchange (IPC, Spanish)
Exchange rate
Equilibrium interbank interest rate (TIIE, Spanish)
CETES rate of return
Investment units (UDIS, Spanish)
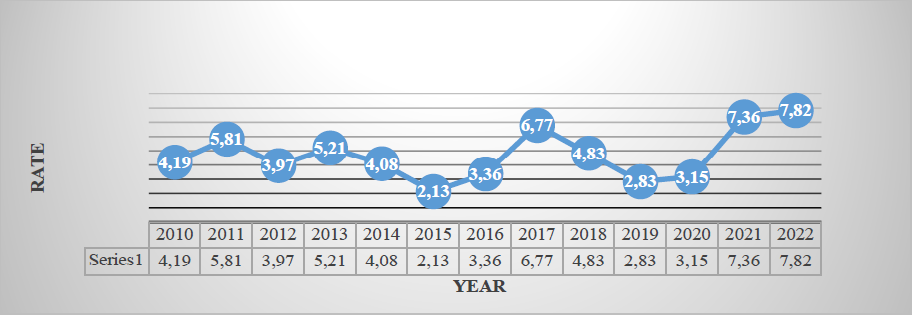
1. NATIONAL CONSUMER PRICE INDEX (INPC)
Born in 1995 and reflecting changes in consumer prices, measures the general increase in prices in the country. It is calculated fortnightly by the Bank of Mexico and INEGI (2022). INPC is published in the Official Gazette of the Federation on the 10th and 25th of each month. The reference period is the second half of December 2010.
Table 1 Accumulated inflation in the year (Base: 2nd. Fortnight of December 2010 = 100 with data provided by Banco de México)
| Periodo | 2010 | 2011 | 2012 | 2013 | 2014 | 2015 | 2016 | 2017 | 2018 | 2019 | 2020 | 2021 | 2022 |
|---|---|---|---|---|---|---|---|---|---|---|---|---|---|
| Enero | 1.48 | 0.77 | 0.98 | 0.79 | 0.90 | -0.09 | 0.38 | 1.70 | 0.53 | 0.09 | 0.48 | 0.86 | 0.59 |
| Febrero | 2.15 | 1.42 | 1.47 | 1.46 | 1.15 | 0.09 | 0.82 | 2.29 | 0.91 | 0.06 | 0.90 | 1.50 | 1.43 |
| Marzo | 2.52 | 1.84 | 1.55 | 1.99 | 1.43 | 0.51 | 0.97 | 2.92 | 1.24 | 0.44 | 0.85 | 2.34 | 2.43 |
| Abril | 1.98 | 0.72 | 0.69 | 1.81 | 1.24 | 0.25 | 0.65 | 3.04 | 0.90 | 0.50 | -0.17 | 2.67 | 2.98 |
| Mayo | 0.60 | -0.70 | -0.65 | 0.95 | 0.91 | -0.26 | 0.20 | 2.92 | 0.73 | 0.21 | 0.22 | 2.88 | 3.17 |
| Junio | 0.49 | -0.41 | -0.41 | 1.12 | 1.09 | -0.09 | 0.31 | 3.18 | 1.12 | 0.27 | 0.76 | 3.43 | 4.04 |
| Julio | 0.56 | -0.04 | 0.32 | 1.14 | 1.42 | 0.06 | 0.57 | 3.57 | 1.66 | 0.65 | 1.43 | 4.04 | 4.81 |
| Agosto | 0.91 | 0.30 | 0.92 | 1.31 | 1.73 | 0.27 | 0.86 | 4.08 | 2.26 | 0.63 | 1.82 | 4.24 | 5.54 |
| Septiembre | 1.27 | 0.73 | 1.12 | 1.61 | 2.18 | 0.27 | 1.47 | 4.41 | 2.69 | 0.89 | 2.06 | 4.88 | 6.19 |
| Octubre | 2.35 | 2.33 | 2.12 | 2.77 | 2.74 | 1.16 | 2.09 | 5.06 | 3.22 | 1.44 | 2.68 | 5.76 | 6.79 |
| Noviembre | 3.89 | 4.87 | 3.86 | 4.57 | 3.57 | 1.71 | 2.89 | 6.15 | 4.10 | 2.26 | 2.76 | 6.97 | 7.41 |
| Diciembre | 4.19 | 5.81 | 3.97 | 5.21 | 4.08 | 2.13 | 3.36 | 6.77 | 4.83 | 2.83 | 3.15 | 7.36 | 7.82 |
Source: Own elaboration (INEGI, 2022). Route: Indicadores económicos de coyuntura > Índices de precios >Índice nacional de precios al consumidor. Base segunda quincena de julio de 2018=100 > Mensual > Índice > Índice general
Source: Own elaboration (INEGI, 2022). Route: Indicadores económicos de coyuntura > Índices de precios > Índice nacional de precios al consumidor. Base segunda quincena de julio de 2018=100 > Mensual > Índice > Índice general
Graph 1 Inflation in Mexico (2010-2022 accumulated at the end of the year)

Source: Own elaboration (INEGI, 2022). Route: Indicadores económicos de coyuntura > Índices de precios > Índice nacional de precios al consumidor. Base segunda quincena de julio de 2018=100 > Mensual > Índice > Índice general
Graph 2 Inflation in Mexico (accumulated January-December 2022)
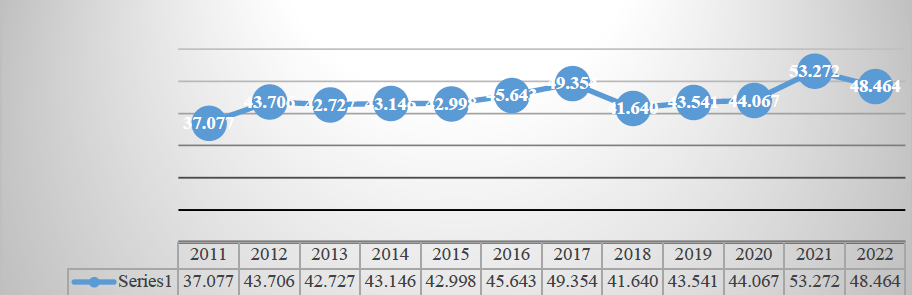
2. THE PRICE AND QUOTATION INDEX OF THE MEXICAN STOCK EXCHANGE (IPC)
Represents the change in the values traded on the Mexican Stock Exchange concerning the previous day to determine the percentage of rising or fall of the most representative shares of the companies listed therein.
Table 2 The Price and Quotation Index of the Mexican Stock Exchange (Base: October 1978, 0.78=100)
| Periodo | 2010 | 2011 | 2012 | 2013 | 2014 | 2015 | 2016 | 2017 | 2018 | 2019 | 2020 | 2021 | 2022 |
|---|---|---|---|---|---|---|---|---|---|---|---|---|---|
| Enero | 30,392 | 36,982 | 37,422 | 45,278 | 40,879 | 40,951 | 43,631 | 47,001 | 50,456 | 43,988 | 44,862 | 42,986 | 51,331 |
| Febrero | 31,635 | 37,020 | 37,816 | 44,121 | 38,783 | 44,190 | 43,715 | 46,857 | 47,438 | 42,824 | 41,324 | 44,593 | 53,401 |
| Marzo | 33,266 | 37,441 | 39,521 | 44,077 | 40,462 | 43,725 | 45,881 | 48,542 | 46,125 | 43,281 | 34,554 | 47,246 | 56,537 |
| Abril | 32,687 | 36,963 | 39,461 | 42,263 | 40,712 | 44,582 | 45,785 | 49,261 | 48,354 | 44,597 | 36,470 | 48,010 | 51,418 |
| Mayo | 32,039 | 35,833 | 37,872 | 41,588 | 41,363 | 44,704 | 45,459 | 48,788 | 44,663 | 42,749 | 36,122 | 50,886 | 51,753 |
| Junio | 31,157 | 36,558 | 40,199 | 40,623 | 42,737 | 45,054 | 45,966 | 49,857 | 47,663 | 43,161 | 37,716 | 50,290 | 47,524 |
| Julio | 32,309 | 35,999 | 40,704 | 40,838 | 43,818 | 44,753 | 46,661 | 51,012 | 49,698 | 40,863 | 37,020 | 50,868 | 48,144 |
| Agosto | 31,680 | 35,721 | 39,422 | 39,492 | 45,628 | 43,722 | 47,541 | 51,210 | 49,548 | 42,623 | 36,841 | 53,305 | 44,919 |
| Sep. | 33,330 | 33,503 | 40,867 | 40,185 | 44,986 | 42,633 | 47,246 | 50,346 | 49,504 | 43,011 | 37,459 | 51,386 | 44,627 |
| Oct. | 35,568 | 36,160 | 41,620 | 41,039 | 45,028 | 44,543 | 48,009 | 48,626 | 43,943 | 43,337 | 36,988 | 51,310 | 49,922 |
| Nov. | 36,817 | 36,829 | 41,834 | 42,499 | 44,190 | 43,419 | 45,286 | 47,092 | 41,733 | 42,820 | 41,779 | 49,699 | 51,685 |
| Dic. | 38,551 | 37,077 | 43,706 | 42,727 | 43,146 | 42,998 | 45,643 | 49,354 | 41,640 | 43,541 | 44,067 | 53,272 | 48,464 |
Source: Own elaboration (BANXICO, 2022).
Source: Own elaboration (BANXICO, 2022). https://www.banxico.org.mx/SieInternet/consultarDirectorioInternetAction.do?sector=7&accion=consultarCuadro&idCuadro=CF57&locale=es
Graph 3 The Price and Quotation Index of the Mexican Stock Exchange, 2010 - 2022 (Score at the end of each year)

Source: Own elaboration (BANXICO, 2022). https://www.banxico.org.mx/SieInternet/consultarDirectorioInternetAction.do?sector=7&accion=consultarCuadro&idCuadro=CF57&locale=es
Graph 4 The Price and Quotation Index of the Mexican Stock Exchange, January-December 2022 (Score at the end of each month)
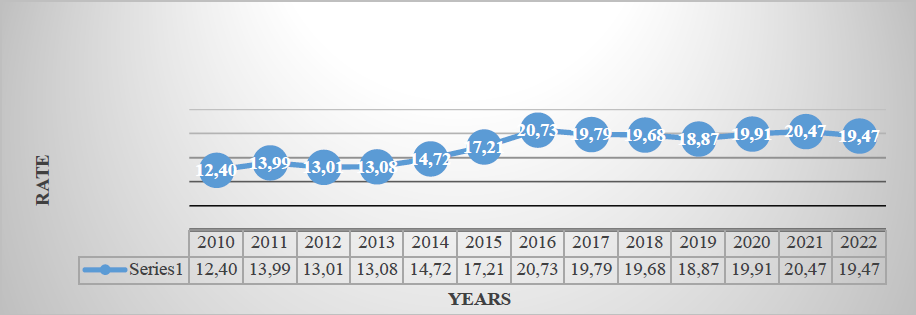
3. EXCHANGE RATE
It is the value of the Mexican peso with respect to the dollar calculated with the daily average of the five most important banks in the country, which reflects the spot price (cash), negotiated between banks. It is highly related to Inflation, the interest rate, and the Mexican Stock Exchange.
Table 3 Exchange rate (National currency per US dollar, parity at the end of each period)
| Periodo | 2010 | 2011 | 2012 | 2013 | 2014 | 2015 | 2016 | 2017 | 2018 | 2019 | 2020 | 2021 | 2022 |
|---|---|---|---|---|---|---|---|---|---|---|---|---|---|
| Enero | 12.81 | 12.02 | 12.95 | 12.71 | 13.37 | 14.69 | 18.45 | 21.02 | 18.62 | 19.04 | 18.91 | 20.22 | 20.74 |
| Febrero | 12.96 | 12.17 | 12.87 | 12.87 | 13.30 | 14.92 | 18.17 | 19.83 | 18.65 | 19.26 | 19.78 | 20.94 | 20.65 |
| Marzo | 12.61 | 11.97 | 12.80 | 12.36 | 13.08 | 15.15 | 17.40 | 18.81 | 18.33 | 19.38 | 23.48 | 20.44 | 19.99 |
| Abril | 12.24 | 11.59 | 13.20 | 12.16 | 13.14 | 15.22 | 19.40 | 19.11 | 18.86 | 19.01 | 23.93 | 20.18 | 20.57 |
| Mayo | 12.68 | 11.63 | 13.91 | 12.63 | 12.87 | 15.36 | 18.45 | 18.51 | 19.75 | 19.64 | 22.18 | 19.92 | 19.69 |
| Junio | 12.72 | 11.84 | 13.66 | 13.19 | 13.03 | 15.57 | 18.91 | 17.90 | 20.06 | 19.21 | 23.09 | 19.91 | 20.13 |
| Julio | 12.83 | 11.65 | 13.28 | 12.73 | 13.06 | 16.21 | 18.86 | 17.69 | 18.55 | 19.99 | 22.20 | 19.85 | 20.34 |
| Agosto | 12.73 | 12.41 | 13.27 | 13.25 | 13.08 | 16.89 | 18.58 | 17.88 | 19.07 | 20.07 | 21.89 | 20.06 | 20.09 |
| Septiembre | 12.86 | 13.42 | 12.92 | 13.01 | 13.45 | 17.01 | 19.50 | 18.13 | 18.90 | 19.68 | 22.14 | 20.56 | 20.09 |
| Octubre | 12.45 | 13.20 | 13.09 | 12.89 | 13.42 | 16.45 | 18.84 | 19.15 | 19.80 | 19.16 | 21.25 | 20.53 | 19.82 |
| Noviembre | 12.33 | 14.03 | 13.04 | 13.09 | 13.72 | 16.55 | 20.55 | 18.58 | 20.41 | 19.61 | 20.14 | 21.45 | 19.40 |
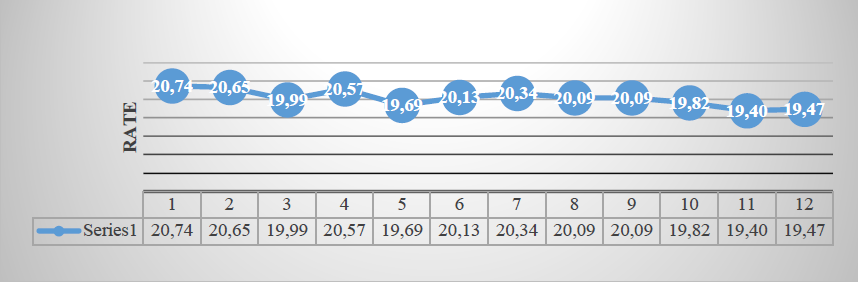
| Diciembre | 12.40 | 13.99 | 13.01 | 13.08 | 14.72 | 17.21 | 20.73 | 19.79 | 19.68 | 18.87 | 19.91 | 20.47 | 19.47 |
NOTE: Exchange rate FIX by The Banco de México, used for settle obligations denominated in foreign currency. Quote at the end
Source: Own elaboration (BANXICO, 2022).
Source: Own elaboration (BANXICO, 2022). https://www.banxico.org.mx/SieInternet/consultarDirectorioInternetAction.do?sector=6&accion=consultarCuadro&idCuadro=CF102&locale=es
Graph 5. Exchange rate (National currency per US dollar, 2010-2022, FIX parity at the end of 100 each year)
Source: Own elaboration (BANXICO, 2022). https://www.banxico.org.mx/SieInternet/consultarDirectorioInternetAction.do?sector=6&accion=consultarCuadro&idCuadro=CF102&locale=es
Graph 6 Exchange rate (National currency per US dollar, January-December 2022, FIX parity at the end of each month)
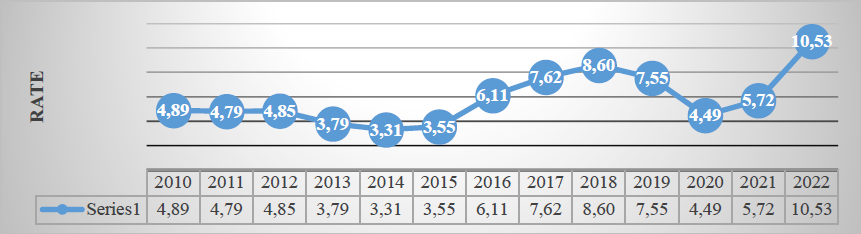
4. EQUILIBRIUM INTERBANK INTEREST RATE (TIIE)
On March 23, 1995, the Bank of Mexico, to establish an interbank interest rate that better 101 reflects market conditions, released the Interbank Equilibrium Interest Rate through the Official Gazette of the Federation.
Table 4 Equilibrium interbank interest rate (28-day quote)
| Periodo | 2010 | 2011 | 2012 | 2013 | 2014 | 2015 | 2016 | 2017 | 2018 | 2019 | 2020 | 2021 | 2022 |
|---|---|---|---|---|---|---|---|---|---|---|---|---|---|
| Enero | 4.91 | 4.86 | 4.79 | 4.84 | 3.78 | 3.29 | 3.56 | 6.15 | 7.66 | 8.59 | 7.50 | 4.47 | 5.72 |
| Febrero | 4.92 | 4.84 | 4.78 | 4.80 | 3.79 | 3.29 | 4.05 | 6.61 | 7.83 | 8.54 | 7.29 | 4.36 | 6.02 |
| Marzo | 4.92 | 4.84 | 4.77 | 4.35 | 3.81 | 3.30 | 4.07 | 6.68 | 7.85 | 8.51 | 6.74 | 4.28 | 6.33 |
| Abril | 4.94 | 4.85 | 4.75 | 4.33 | 3.80 | 3.30 | 4.07 | 6.89 | 7.85 | 8.50 | 6.25 | 4.28 | 6.73 |
| Mayo | 4.94 | 4.85 | 4.76 | 4.30 | 3.79 | 3.30 | 4.10 | 7.15 | 7.86 | 8.51 | 5.74 | 4.29 | 7.01 |
| Junio | 4.94 | 4.85 | 4.77 | 4.31 | 3.31 | 3.30 | 4.11 | 7.36 | 8.10 | 8.49 | 5.28 | 4.32 | 7.42 |
| Julio | 4.92 | 4.82 | 4.78 | 4.32 | 3.31 | 3.31 | 4.59 | 7.38 | 8.11 | 8.47 | 5.19 | 4.52 | 8.04 |
| Agosto | 4.90 | 4.81 | 4.79 | 4.30 | 3.30 | 3.33 | 4.60 | 7.38 | 8.10 | 8.26 | 4.76 | 4.65 | 8.50 |
| Sep. | 4.90 | 4.78 | 4.81 | 4.03 | 3.29 | 3.33 | 4.67 | 7.38 | 8.12 | 8.04 | 4.55 | 4.75 | 8.89 |
| Octubre | 4.87 | 4.79 | 4.83 | 3.78 | 3.28 | 3.30 | 5.11 | 7.38 | 8.15 | 7.97 | 4.51 | 4.98 | 9.56 |
| Noviembre | 4.87 | 4.80 | 4.85 | 3.80 | 3.31 | 3.32 | 5.57 | 7.39 | 8.34 | 7.78 | 4.48 | 5.13 | 10.00 |
| Diciembre | 4.89 | 4.79 | 4.85 | 3.79 | 3.31 | 3.55 | 6.11 | 7.62 | 8.60 | 7.55 | 4.49 | 5.72 | 10.53 |
Source: Own elaboration (BANXICO, 2022).
Source: Own elaboration (BANXICO, 2022). https://www.banxico.org.mx/SieInternet/consultarDirectorioInternetAction.do?sector=18&accion=consultarCuadro&idCuadro=CF101&locale=es
Graph 7 Equilibrium interbank interest rate, 2010- 2022 (at the end of each year)

Source: Own elaboration (BANXICO, 2022). https://www.banxico.org.mx/SieInternet/consultarDirectorioInternetAction.do?sector=18&accion=consultarCuadro&idCuadro=CF101&locale=es
Graph 8. Equilibrium interbank interest rate, January-December 2022 (28-day quote)
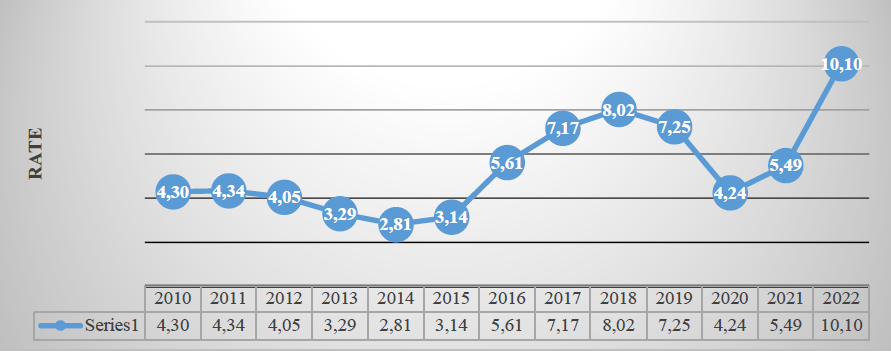
5. CETES RATE OF RETURN
Table 5 CETES rate of return (28-day)
| Periodo | 2010 | 2011 | 2012 | 2013 | 2014 | 2015 | 2016 | 2017 | 2018 | 2019 | 2020 | 2021 | 2022 |
|---|---|---|---|---|---|---|---|---|---|---|---|---|---|
| Enero | 4.49 | 4.14 | 4.27 | 4.15 | 3.14 | 2.67 | 3.08 | 5.83 | 7.25 | 7.95 | 7.04 | 4.22 | 5.50 |
| Febrero | 4.49 | 4.04 | 4.32 | 4.19 | 3.16 | 2.81 | 3.36 | 6.06 | 7.40 | 7.93 | 6.91 | 4.02 | 5.94 |
| Marzo | 4.45 | 4.27 | 4.24 | 3.98 | 3.17 | 3.04 | 3.80 | 6.32 | 7.47 | 8.02 | 6.59 | 4.08 | 6.52 |
| Abril | 4.44 | 4.28 | 4.29 | 3.82 | 3.23 | 2.97 | 3.74 | 6.50 | 7.46 | 7.78 | 5.84 | 4.06 | 6.68 |
| Mayo | 4.52 | 4.31 | 4.39 | 3.72 | 3.28 | 2.98 | 3.81 | 6.56 | 7.51 | 8.07 | 5.38 | 4.07 | 6.90 |
| Junio | 4.59 | 4.37 | 4.34 | 3.78 | 3.02 | 2.96 | 3.81 | 6.82 | 7.64 | 8.18 | 4.85 | 4.03 | 7.56 |
| Julio | 4.60 | 4.14 | 4.15 | 3.85 | 2.83 | 2.99 | 4.21 | 6.99 | 7.73 | 8.15 | 4.63 | 4.35 | 8.05 |
| Agosto | 4.52 | 4.05 | 4.13 | 3.84 | 2.77 | 3.04 | 4.24 | 6.94 | 7.73 | 7.87 | 4.50 | 4.49 | 8.35 |
| Sep. | 4.43 | 4.23 | 4.17 | 3.64 | 2.83 | 3.10 | 4.28 | 6.99 | 7.69 | 7.61 | 4.25 | 4.69 | 9.25 |
| Oct. | 4.03 | 4.36 | 4.21 | 3.39 | 2.90 | 3.02 | 4.69 | 7.03 | 7.69 | 7.62 | 4.22 | 4.93 | 9.00 |
| Nov. | 3.97 | 4.35 | 4.23 | 3.39 | 2.85 | 3.02 | 5.15 | 7.02 | 7.83 | 7.46 | 4.28 | 5.05 | 9.70 |
| Dic. | 4.30 | 4.34 | 4.05 | 3.29 | 2.81 | 3.14 | 5.61 | 7.17 | 8.02 | 7.25 | 4.24 | 5.49 | 10.01 |
Source: Own elaboration (BANXICO, 2022).
Source: Own elaboration (BANXICO, 2022). https://www.banxico.org.mx/SieInternet/consultarDirectorioInternetAction.do?sector=22&accion=consultarCuadro&idCuadro=CF107&locale=es
Graph 9 CETES rate of return 2010- 2022 (at the end of each year)

Source: Own elaboration (BANXICO, 2022). https://www.banxico.org.mx/SieInternet/consultarDirectorioInternetAction.do?sector=22&accion=consultarCuadro&idCuadro=CF107&locale=es
Graph 10 CETES rate of return, January-December del 2022 (at the end of each month)
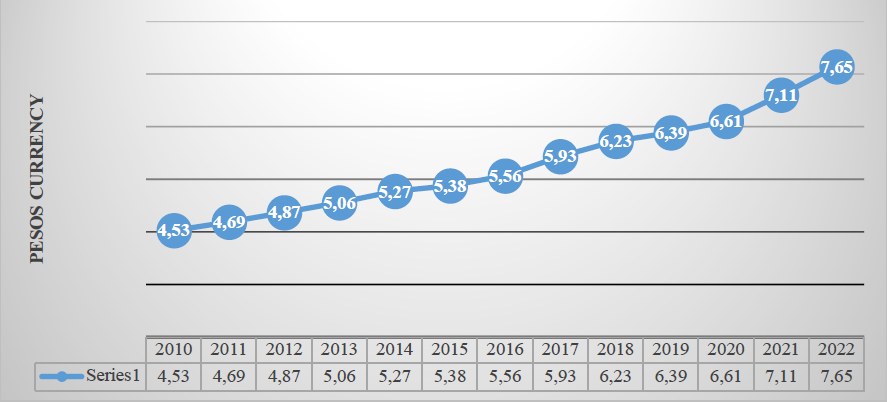
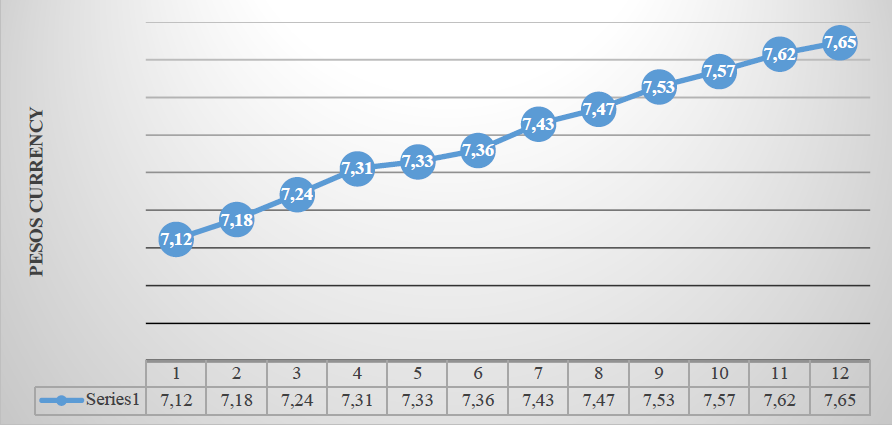
6. INVESTMENT UNITS (UDIS)
The UDI is a unit of account of constant real value to denominate credit titles. It does not apply to checks, commercial contracts, or other acts of commerce.
Table 6 Investment units (value concerning pesos)
| Periodo | 2010 | 2011 | 2012 | 2013 | 2014 | 2015 | 2016 | 2017 | 2018 | 2019 | 2020 | 2021 | 2022 |
|---|---|---|---|---|---|---|---|---|---|---|---|---|---|
| Enero | 4.37 | 4.56 | 4.73 | 4.89 | 5.10 | 5.29 | 5.41 | 5.62 | 5.97 | 6.25 | 6.44 | 6.64 | 7.12 |
| Febrero | 4.41 | 4.57 | 4.75 | 4.92 | 5.13 | 5.29 | 5.43 | 5.69 | 6.00 | 6.25 | 6.46 | 6.70 | 7.18 |
| Marzo | 4.44 | 4.59 | 4.75 | 4.94 | 5.15 | 5.30 | 5.44 | 5.71 | 6.02 | 6.26 | 6.49 | 6.75 | 7.24 |
| Abril | 4.46 | 4.59 | 4.75 | 4.97 | 5.15 | 5.32 | 5.45 | 5.75 | 6.03 | 6.28 | 6.43 | 6.79 | 7.31 |
| Mayo | 4.43 | 4.58 | 4.71 | 4.96 | 5.13 | 5.29 | 5.42 | 5.75 | 6.01 | 6.27 | 6.42 | 6.81 | 7.33 |
| Junio | 4.41 | 4.55 | 4.74 | 4.95 | 5.13 | 5.28 | 5.42 | 5.75 | 6.01 | 6.26 | 6.44 | 6.83 | 7.36 |
| Julio | 4.42 | 4.57 | 4.77 | 4.95 | 5.14 | 5.28 | 5.42 | 5.76 | 6.04 | 6.27 | 6.49 | 6.87 | 7.43 |
| Agosto | 4.43 | 4.58 | 4.78 | 4.95 | 5.16 | 5.29 | 5.44 | 5.79 | 6.07 | 6.29 | 6.52 | 6.90 | 7.47 |
| Sep. | 4.44 | 4.59 | 4.80 | 4.97 | 5.18 | 5.31 | 5.45 | 5.82 | 6.11 | 6.29 | 6.55 | 6.92 | 7.53 |
| Oct. | 4.47 | 4.61 | 4.83 | 4.99 | 5.20 | 5.33 | 5.49 | 5.84 | 6.13 | 6.31 | 6.57 | 6.97 | 7.57 |
| Nov. | 4.50 | 4.64 | 4.85 | 5.02 | 5.23 | 5.36 | 5.53 | 5.89 | 6.17 | 6.35 | 6.60 | 7.04 | 7.62 |
| Dic. | 4.53 | 4.69 | 4.87 | 5.06 | 5.27 | 5.38 | 5.56 | 5.93 | 6.23 | 6.39 | 6.61 | 7.11 | 7.65 |
Source: Own elaboration (BANXICO, 2022).
Source: Own elaboration (BANXICO, 2022). https://www.banxico.org.mx/SieInternet/consultarDirectorioInternetAction.do?accion=consultarCuadro&idCuadro=CP150&locale=es
Graph 11 Investment units 2010-2021 (At the end of the year)
Source: Own elaboration (BANXICO, 2022). https://www.banxico.org.mx/SieInternet/consultarDirectorioInternetAction.do?accion=consultarCuadro&idCuadro=CP150&locale=es
Graph 12 Investment units, January-December 2022
Finally, we will mention that the analysis tool known as the break-even point can be calculated under two scenarios 1) a project or an organization with a single product or service and 2) for an organization or project with multiple products or services. taking as reference the mix of products or services.

