


 text new page (beta)
 English (pdf)
 Article in xml format
 Article references
 Send this article by e-mail
 Cited by SciELO
  Similars in
SciELO
Similars in
SciELO 
 Permalink
Business analysis began its development by supporting its activity in indexes, quotients or financial ratios, also known as ratios. Financial ratios are ways of comparing and investigating the relationships that exist between the different elements of the financial information of organizations. (Ross, Westerfield and Jaffe. 2018).
Financial analysts have used financial ratios since the 19th century to carry out the evaluation, to know the situation, as well as the financial and economic evolution of companies, initially they were used to measure credit liquidity, later under the direction of Alexander Wall, financial of the Federal Reserve Board in the United States, the financial ratios were used as a management technique, (Gremillet, 1989).
Towards the end of the 19th century and until the 1930s, the ability of financial ratios to predict possible business failure was analyzed. Subsequently, the focus was on determining long-term solvency and the possible prediction of bankruptcy, with the traditional approach that used financial ratios as a measure of credit liquidity taking a backseat.
The empirical studies of the financial ratios applied to the prediction of bankruptcies were given at the end of the sixties in the classic works with a predictive approach carried out by Beaver (1966) and Altman (1968).
In the hypothesis used by Beaver, the solvency of companies is linked to a group of independent financial ratios that can be controlled; This hypothesis, according to Bizquerra (1989), represents the beginning of univariate statistical analysis and later the development of multivariate analysis.
The theory of solvency in principle was based on the methodology of financial ratios. Subsequently, given certain weaknesses in the financial ratios in their simple interpretation, solvency theory began to be enriched with multivariable statistical methods which, together with the development of statistical software (SPSS, SAS, BMPD, LISREL, SPAD, etc.), they provided more powerful and reliable instruments. (Ibarra, 2006)
Univariate analysis is the most elementary approach, and it has the drawback that, despite having a relatively large set of financial indicators, in principle these are basically examined in isolation and later an opinion is issued based on the knowledge and experience financial analyst.
Multivariate analysis is the approach that aims to decipher the links and relationships that exist between the different indicators, in such a way that the evaluation of the financial performance of the companies is carried out in a joint and structured manner, providing an integrating vision and of the different factors that condition life and business dynamics.
Multivariate analysis is part of statistics and data analysis that studies, analyzes, represents, and interprets the data resulting from observing more than one variable on a sample of individuals. (González, Ruiz and Nieto, 2020).
Among the main classifications used in multivariate models are those that divide them into a)descriptive or exploratory methods (no prior hypothesis is established); and b) explanatory or confirmatory methods (they are based on a theoretical framework to support and empirically validate a hypothesis).
Another classification is the one that divides the methods into: a) reductive methods (factorial analysis, main components, canonical correlation, cluster analysis, correspondence analysis); and b) dependency methods (variance analysis, covariance analysis, multiple regression, discriminant analysis, logit conditional probability analysis and probit conditional probability analysis). (Ibarra, 2006)
Economic and financial indicators are useful tools that benefit organizations by facilitating timely and appropriate decision-making in relation to their corporate and financial strategies.
Next, the evolution of some economic and financial indicators of the Mexican environment is described and shown to facilitate decision-making related to personal and business strategies in an integral manner.
National Consumer Price Index (INPC, Spanish)
The Price and Quotation Index of the Mexican Stock Exchange (IPC, Spanish)
Exchange rate
Equilibrium interbank interest rate (TIIE, Spanish)
CETES rate of return
Investment units (UDIS, Spanish)
1.NATIONAL CONSUMER PRICE INDEX (INPC)
Born in 1995 and reflecting changes in consumer prices, measures the general increase in prices in the country. It is calculated fortnightly by the Bank of Mexico and INEGI (2021). INPC is published in the Official Gazette of the Federation on the 10th and 25th of each month. The reference period is the second half of December 2010.
Table 1 Accumulated inflation in the year (Base: 2nd. Fortnight of December 2010 = 100 with data provided by Banco de México)
| Periodo | 2010 | 2011 | 2012 | 2013 | 2014 | 2015 | 2016 | 2017 | 2018 | 2019 | 2020 | 2021 | 2022 |
| Enero | 1.48 | 0.77 | 0.98 | 0.79 | 0.90 | -0.09 | 0.38 | 1.70 | 0.53 | 0.09 | 0.48 | 0.86 | 0.59 |
| Febrero | 2.15 | 1.42 | 1.47 | 1.46 | 1.15 | 0.09 | 0.82 | 2.29 | 0.91 | 0.06 | 0.90 | 1.50 | 1.43 |
| Marzo | 2.52 | 1.84 | 1.55 | 1.99 | 1.43 | 0.51 | 0.97 | 2.92 | 1.24 | 0.44 | 0.85 | 2.34 | 2.43 |
| Abril | 1.98 | 0.72 | 0.69 | 1.81 | 1.24 | 0.25 | 0.65 | 3.04 | 0.90 | 0.50 | -0.17 | 2.67 | 2.98 |
| Mayo | 0.60 | -0.70 | -0.65 | 0.95 | 0.91 | -0.26 | 0.20 | 2.92 | 0.73 | 0.21 | 0.22 | 2.88 | |
| Junio | 0.49 | -0.41 | -0.41 | 1.12 | 1.09 | -0.09 | 0.31 | 3.18 | 1.12 | 0.27 | 0.76 | 3.43 | |
| Julio | 0.56 | -0.04 | 0.32 | 1.14 | 1.42 | 0.06 | 0.57 | 3.57 | 1.66 | 0.65 | 1.43 | 4.04 | |
| Agosto | 0.91 | 0.30 | 0.92 | 1.31 | 1.73 | 0.27 | 0.86 | 4.08 | 2.26 | 0.63 | 1.82 | 4.24 | |
| Septiembre | 1.27 | 0.73 | 1.12 | 1.61 | 2.18 | 0.27 | 1.47 | 4.41 | 2.69 | 0.89 | 2.06 | 4.88 | |
| Octubre | 2.35 | 2.33 | 2.12 | 2.77 | 2.74 | 1.16 | 2.09 | 5.06 | 3.22 | 1.44 | 2.68 | 5.76 | |
| Noviembre | 3.89 | 4.87 | 3.86 | 4.57 | 3.57 | 1.71 | 2.89 | 6.15 | 4.10 | 2.26 | 2.76 | 6.97 | |
| Diciembre | 4.19 | 5.81 | 3.97 | 5.21 | 4.08 | 2.13 | 3.36 | 6.77 | 4.83 | 2.83 | 3.15 | 7.36 |
Source: Own elaboration (INEGI, 2022). Route: Indicadores económicos de coyuntura > Índices de precios > Índice nacional de precios al consumidor. Base segunda quincena de julio de 2018=100 > Mensual > Índice > Índice general

Source: Own elaboration (INEGI, 2022). Route: Indicadores económicos de coyuntura > Índices de precios > Índice nacional de precios al consumidor. Base segunda quincena de julio de 2018=100 > Mensual > Índice > Índice general
Graph 1 Inflation in Mexico (2010-2021 accumulated at the end of the year)

Source: Own elaboration (INEGI, 2022). Route: Indicadores económicos de coyuntura > Índices de precios > Índice nacional de precios al consumidor. Base segunda quincena de julio de 2018=100 > Mensual > Índice > Índice general
Graph 2 Inflation in Mexico (accumulated January-April 2022)
2.THE PRICE AND QUOTATION INDEX OF THE MEXICAN STOCK EXCHANGE (IPC)
Represents the change in the values traded on the Mexican Stock Exchange concerning the previous day to determine the percentage of rising or fall of the most representative shares of the companies listed therein.
Table 2 The Price and Quotation Index of the Mexican Stock Exchange (Base: October 1978, 0.78=100)
| Periodo | 2010 | 2011 | 2012 | 2013 | 2014 | 2015 | 2016 | 2017 | 2018 | 2019 | 2020 | 2021 | 2022 |
| Enero | 30,392 | 36,982 | 37,422 | 45,278 | 40,879 | 40,951 | 43,631 | 47,001 | 50,456 | 43,988 | 44,862 | 42,986 | 51,331 |
| Febrero | 31,635 | 37,020 | 37,816 | 44,121 | 38,783 | 44,190 | 43,715 | 46,857 | 47,438 | 42,824 | 41,324 | 44,593 | 53,401 |
| Marzo | 33,266 | 37,441 | 39,521 | 44,077 | 40,462 | 43,725 | 45,881 | 48,542 | 46,125 | 43,281 | 34,554 | 47,246 | 56,537 |
| Abril | 32,687 | 36,963 | 39,461 | 42,263 | 40,712 | 44,582 | 45,785 | 49,261 | 48,354 | 44,597 | 36,470 | 48,010 | 51,418 |
| Mayo | 32,039 | 35,833 | 37,872 | 41,588 | 41,363 | 44,704 | 45,459 | 48,788 | 44,663 | 42,749 | 36,122 | 50,886 | |
| Junio | 31,157 | 36,558 | 40,199 | 40,623 | 42,737 | 45,054 | 45,966 | 49,857 | 47,663 | 43,161 | 37,716 | 50,290 | |
| Julio | 32,309 | 35,999 | 40,704 | 40,838 | 43,818 | 44,753 | 46,661 | 51,012 | 49,698 | 40,863 | 37,020 | 50,868 | |
| Agosto | 31,680 | 35,721 | 39,422 | 39,492 | 45,628 | 43,722 | 47,541 | 51,210 | 49,548 | 42,623 | 36,841 | 53,305 | |
| Sep. | 33,330 | 33,503 | 40,867 | 40,185 | 44,986 | 42,633 | 47,246 | 50,346 | 49,504 | 43,011 | 37,459 | 51,386 | |
| Oct. | 35,568 | 36,160 | 41,620 | 41,039 | 45,028 | 44,543 | 48,009 | 48,626 | 43,943 | 43,337 | 36,988 | 51,310 | |
| Nov. | 36,817 | 36,829 | 41,834 | 42,499 | 44,190 | 43,419 | 45,286 | 47,092 | 41,733 | 42,820 | 41,779 | 49,699 | |
| Dic. | 38,551 | 37,077 | 43,706 | 42,727 | 43,146 | 42,998 | 45,643 | 49,354 | 41,640 | 43,541 | 44,067 | 53,272 |
Source: Own elaboration (BANXICO, 2022). https://www.banxico.org.mx/SieInternet/consultarDirectorioInternetAction.do?sector=7&accion=consultarCuadro&idCuadro=CF57&locale=es

Source: Own elaboration (BANXICO, 2022). https://www.banxico.org.mx/SieInternet/consultarDirectorioInternetAction.do?sector=7&accion=consultarCuadro&idCuadro=CF57&locale=es
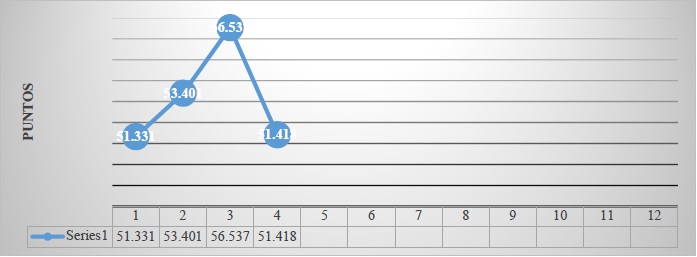
Graph 3 The Price and Quotation Index of the Mexican Stock Exchange, 2010 - 2021 (Score at the end of each year)
Source: Own elaboration (BANXICO, 2022). https://www.banxico.org.mx/SieInternet/consultarDirectorioInternetAction.do?sector=7&accion=consultarCuadro&idCuadro=CF57&locale=es
Graph 4 The Price and Quotation Index of the Mexican Stock Exchange, January-April 2022 (Score at the end of each month)
3.EXCHANGE RATE
It is the value of the Mexican peso with respect to the dollar calculated with the daily average of the five most important banks in the country, which reflects the spot price (cash), negotiated between banks. It is highly related to Inflation, the interest rate, and the Mexican Stock Exchange.
Table 3 Exchange rate (National currency per US dollar, parity at the end of each period)
| Periodo | 2010 | 2011 | 2012 | 2013 | 2014 | 2015 | 2016 | 2017 | 2018 | 2019 | 2020 | 2021 | 2022 |
| Enero | 12.81 | 12.02 | 12.95 | 12.71 | 13.37 | 14.69 | 18.45 | 21.02 | 18.62 | 19.04 | 18.91 | 20.22 | 20.74 |
| Febrero | 12.96 | 12.17 | 12.87 | 12.87 | 13.30 | 14.92 | 18.17 | 19.83 | 18.65 | 19.26 | 19.78 | 20.94 | 20.65 |
| Marzo | 12.61 | 11.97 | 12.80 | 12.36 | 13.08 | 15.15 | 17.40 | 18.81 | 18.33 | 19.38 | 23.48 | 20.44 | 19.99 |
| Abril | 12.24 | 11.59 | 13.20 | 12.16 | 13.14 | 15.22 | 19.40 | 19.11 | 18.86 | 19.01 | 23.93 | 20.18 | 20.57 |
| Mayo | 12.68 | 11.63 | 13.91 | 12.63 | 12.87 | 15.36 | 18.45 | 18.51 | 19.75 | 19.64 | 22.18 | 19.92 | |
| Junio | 12.72 | 11.84 | 13.66 | 13.19 | 13.03 | 15.57 | 18.91 | 17.90 | 20.06 | 19.21 | 23.09 | 19.91 | |
| Julio | 12.83 | 11.65 | 13.28 | 12.73 | 13.06 | 16.21 | 18.86 | 17.69 | 18.55 | 19.99 | 22.20 | 19.85 | |
| Agosto | 12.73 | 12.41 | 13.27 | 13.25 | 13.08 | 16.89 | 18.58 | 17.88 | 19.07 | 20.07 | 21.89 | 20.06 | |
| Septiembr e | 12.86 | 13.42 | 12.92 | 13.01 | 13.45 | 17.01 | 19.50 | 18.13 | 18.90 | 19.68 | 22.14 | 20.56 | |
| Octubre | 12.45 | 13.20 | 13.09 | 12.89 | 13.42 | 16.45 | 18.84 | 19.15 | 19.80 | 19.16 | 21.25 | 20.53 | |
| Noviembre | 12.33 | 14.03 | 13.04 | 13.09 | 13.72 | 16.55 | 20.55 | 18.58 | 20.41 | 19.61 | 20.14 | 21.45 | |
| Diciembre | 12.40 | 13.99 | 13.01 | 13.08 | 14.72 | 17.21 | 20.73 | 19.79 | 19.68 | 18.87 | 19.91 | 20.47 |
NOTE: Exchange rate FIX by The Banco de México, used for settle obligations denominated in foreign currency. Quote at the end
Source: Own elaboration (BANXICO, 2022). https://www.banxico.org.mx/SieInternet/consultarDirectorioInternetAction.do?sector=6&accion=consultarCuadro&idCuadro=CF102&locale=es
Source: Own elaboration (BANXICO, 2022). https://www.banxico.org.mx/SieInternet/consultarDirectorioInternetAction.do?sector=6&accion=consultarCuadro&idCuadro=CF102&locale=es
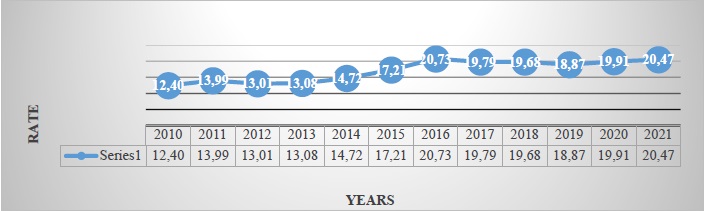
Graph 5 Exchange rate (National currency per US dollar, 2010-2021, FIX parity at the end of each year)
Source: Own elaboration (BANXICO, 2022). https://www.banxico.org.mx/SieInternet/consultarDirectorioInternetAction.do?sector=6&accion=consultarCuadro&idCuadro=CF102&locale=es
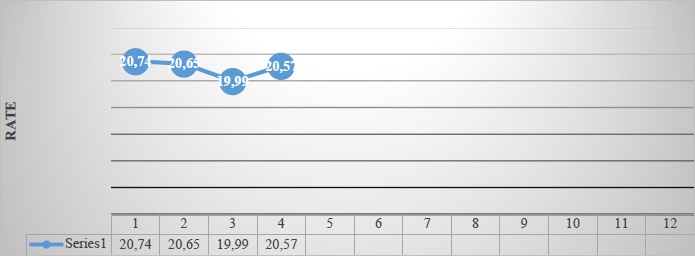
Graph 6 Exchange rate (National currency per US dollar, January-April 2022, FIX parity at the end of each month)
4.EQUILIBRIUM INTERBANK INTEREST RATE (TIIE).
On March 23, 1995, the Bank of Mexico, to establish an interbank interest rate that better reflects market conditions, released the Interbank Equilibrium Interest Rate through the Official Gazette of the Federation.
Table 4 Equilibrium interbank interest rate (28-day quote)
| Periodo | 2010 | 2011 | 2012 | 2013 | 2014 | 2015 | 2016 | 2017 | 2018 | 2019 | 2020 | 2021 | 2022 |
| Enero | 4.91 | 4.86 | 4.79 | 4.84 | 3.78 | 3.29 | 3.56 | 6.15 | 7.66 | 8.59 | 7.50 | 4.47 | 5.73 |
| Febrero | 4.92 | 4.84 | 4.78 | 4.80 | 3.79 | 3.29 | 4.05 | 6.61 | 7.83 | 8.54 | 7.29 | 4.36 | 6.23 |
| Marzo | 4.92 | 4.84 | 4.77 | 4.35 | 3.81 | 3.30 | 4.07 | 6.68 | 7.85 | 8.51 | 6.74 | 4.28 | 6.73 |
| Abril | 4.94 | 4.85 | 4.75 | 4.33 | 3.80 | 3.30 | 4.07 | 6.89 | 7.85 | 8.50 | 6.25 | 4.28 | 6.75 |
| Mayo | 4.94 | 4.85 | 4.76 | 4.30 | 3.79 | 3.30 | 4.10 | 7.15 | 7.86 | 8.51 | 5.74 | 4.29 | |
| Junio | 4.94 | 4.85 | 4.77 | 4.31 | 3.31 | 3.30 | 4.11 | 7.36 | 8.10 | 8.49 | 5.28 | 4.32 | |
| Julio | 4.92 | 4.82 | 4.78 | 4.32 | 3.31 | 3.31 | 4.59 | 7.38 | 8.11 | 8.47 | 5.19 | 4.52 | |
| Agosto | 4.90 | 4.81 | 4.79 | 4.30 | 3.30 | 3.33 | 4.60 | 7.38 | 8.10 | 8.26 | 4.76 | 4.65 | |
| Septiembre | 4.90 | 4.78 | 4.81 | 4.03 | 3.29 | 3.33 | 4.67 | 7.38 | 8.12 | 8.04 | 4.55 | 4.75 | |
| Octubre | 4.87 | 4.79 | 4.83 | 3.78 | 3.28 | 3.30 | 5.11 | 7.38 | 8.15 | 7.97 | 4.51 | 4.98 | |
| Noviembre | 4.87 | 4.80 | 4.85 | 3.80 | 3.31 | 3.32 | 5.57 | 7.39 | 8.34 | 7.78 | 4.48 | 5.13 | |
| Diciembre | 4.89 | 4.79 | 4.85 | 3.79 | 3.31 | 3.55 | 6.11 | 7.62 | 8.60 | 7.55 | 4.49 | 5.72 |
Source: Own elaboration (BANXICO, 2022). https://www.banxico.org.mx/SieInternet/consultarDirectorioInternetAction.do?sector=18&accion=consultarCuadro&idCuadro=CF101&locale=es

Source: Own elaboration (BANXICO, 2022). https://www.banxico.org.mx/SieInternet/consultarDirectorioInternetAction.do?sector=18&accion=consultarCuadro&idCuadro=CF101&locale=es
Graph 7 Equilibrium interbank interest rate, 2010- 2021 (at the end of each year)

Source: Own elaboration (BANXICO, 2022). https://www.banxico.org.mx/SieInternet/consultarDirectorioInternetAction.do?sector=18&accion=consultarCuadro&idCuadro=CF101&locale=es
Graph 8 Equilibrium interbank interest rate, January-April 2022 (28-day quote)
5.CETES RATE OF RETURN
Table 5 CETES rate of return (28-day)
| Periodo | 2010 | 2011 | 2012 | 2013 | 2014 | 2015 | 2016 | 2017 | 2018 | 2019 | 2020 | 2021 | 2022 |
| Enero | 4.49 | 4.14 | 4.27 | 4.15 | 3.14 | 2.67 | 3.08 | 5.83 | 7.25 | 7.95 | 7.04 | 4.22 | 5.50 |
| Febrero | 4.49 | 4.04 | 4.32 | 4.19 | 3.16 | 2.81 | 3.36 | 6.06 | 7.40 | 7.93 | 6.91 | 4.02 | 5.94 |
| Marzo | 4.45 | 4.27 | 4.24 | 3.98 | 3.17 | 3.04 | 3.80 | 6.32 | 7.47 | 8.02 | 6.59 | 4.08 | 6.52 |
| Abril | 4.44 | 4.28 | 4.29 | 3.82 | 3.23 | 2.97 | 3.74 | 6.50 | 7.46 | 7.78 | 5.84 | 4.06 | 6.68 |
| Mayo | 4.52 | 4.31 | 4.39 | 3.72 | 3.28 | 2.98 | 3.81 | 6.56 | 7.51 | 8.07 | 5.38 | 4.07 | |
| Junio | 4.59 | 4.37 | 4.34 | 3.78 | 3.02 | 2.96 | 3.81 | 6.82 | 7.64 | 8.18 | 4.85 | 4.03 | |
| Julio | 4.60 | 4.14 | 4.15 | 3.85 | 2.83 | 2.99 | 4.21 | 6.99 | 7.73 | 8.15 | 4.63 | 4.35 | |
| Agosto | 4.52 | 4.05 | 4.13 | 3.84 | 2.77 | 3.04 | 4.24 | 6.94 | 7.73 | 7.87 | 4.50 | 4.49 | |
| Septiembre | 4.43 | 4.23 | 4.17 | 3.64 | 2.83 | 3.10 | 4.28 | 6.99 | 7.69 | 7.61 | 4.25 | 4.69 | |
| Octubre | 4.03 | 4.36 | 4.21 | 3.39 | 2.90 | 3.02 | 4.69 | 7.03 | 7.69 | 7.62 | 4.22 | 4.93 | |
| Noviembre | 3.97 | 4.35 | 4.23 | 3.39 | 2.85 | 3.02 | 5.15 | 7.02 | 7.83 | 7.46 | 4.28 | 5.05 | |
| Diciembre | 4.30 | 4.34 | 4.05 | 3.29 | 2.81 | 3.14 | 5.61 | 7.17 | 8.02 | 7.25 | 4.24 | 5.49 |
Source: Own elaboration (BANXICO, 2022). https://www.banxico.org.mx/SieInternet/consultarDirectorioInternetAction.do?sector=22&accion=consultarCuadro&idCuadro=CF107&locale=es

Source: Own elaboration (BANXICO, 2022). https://www.banxico.org.mx/SieInternet/consultarDirectorioInternetAction.do?sector=22&accion=consultarCuadro&idCuadro=CF107&locale=es
Graph 9 CETES rate of return 2010- 2021 (at the end of each year)

Source: Own elaboration (BANXICO, 2022). https://www.banxico.org.mx/SieInternet/consultarDirectorioInternetAction.do?sector=22&accion=consultarCuadro&idCuadro=CF107&locale=es
Graph 10 CETES rate of return, January-April del 2022 (at the end of each month)
6.INVESTMENT UNITS (UDIS)
The UDI is a unit of account of constant real value to denominate credit titles. It does not apply to checks, commercial contracts, or other acts of commerce.
Table 6 Investment units (value concerning pesos)
| Periodo | 2010 | 2011 | 2012 | 2013 | 2014 | 2015 | 2016 | 2017 | 2018 | 2019 | 2020 | 2021 | 2022 |
| Enero | 4.37 | 4.56 | 4.73 | 4.89 | 5.10 | 5.29 | 5.41 | 5.62 | 5.97 | 6.25 | 6.44 | 6.64 | 7.12 |
| Febrero | 4.41 | 4.57 | 4.75 | 4.92 | 5.13 | 5.29 | 5.43 | 5.69 | 6.00 | 6.25 | 6.46 | 6.70 | 7.18 |
| Marzo | 4.44 | 4.59 | 4.75 | 4.94 | 5.15 | 5.30 | 5.44 | 5.71 | 6.02 | 6.26 | 6.49 | 6.75 | 7.24 |
| Abril | 4.46 | 4.59 | 4.75 | 4.97 | 5.15 | 5.32 | 5.45 | 5.75 | 6.03 | 6.28 | 6.43 | 6.79 | 7.31 |
| Mayo | 4.43 | 4.58 | 4.71 | 4.96 | 5.13 | 5.29 | 5.42 | 5.75 | 6.01 | 6.27 | 6.42 | 6.81 | |
| Junio | 4.41 | 4.55 | 4.74 | 4.95 | 5.13 | 5.28 | 5.42 | 5.75 | 6.01 | 6.26 | 6.44 | 6.83 | |
| Julio | 4.42 | 4.57 | 4.77 | 4.95 | 5.14 | 5.28 | 5.42 | 5.76 | 6.04 | 6.27 | 6.49 | 6.87 | |
| Agosto | 4.43 | 4.58 | 4.78 | 4.95 | 5.16 | 5.29 | 5.44 | 5.79 | 6.07 | 6.29 | 6.52 | 6.90 | |
| Septiembre | 4.44 | 4.59 | 4.80 | 4.97 | 5.18 | 5.31 | 5.45 | 5.82 | 6.11 | 6.29 | 6.55 | 6.92 | |
| Octubre | 4.47 | 4.61 | 4.83 | 4.99 | 5.20 | 5.33 | 5.49 | 5.84 | 6.13 | 6.31 | 6.57 | 6.97 | |
| Noviembre | 4.50 | 4.64 | 4.85 | 5.02 | 5.23 | 5.36 | 5.53 | 5.89 | 6.17 | 6.35 | 6.60 | 7.04 | |
| Diciembre | 4.53 | 4.69 | 4.87 | 5.06 | 5.27 | 5.38 | 5.56 | 5.93 | 6.23 | 6.39 | 6.61 | 7.11 |
Source: Own elaboration (BANXICO, 2022). https://www.banxico.org.mx/SieInternet/consultarDirectorioInternetAction.do?accion=consultarCuadro&idCuadro=CP150&locale=es

Source: Own elaboration (BANXICO, 2022). https://www.banxico.org.mx/SieInternet/consultarDirectorioInternetAction.do?accion=consultarCuadro&idCuadro=CP150&locale=es
Graph 11 Investment units 2010-2021 (At the end of the year)
Source: Own elaboration (BANXICO, 2022). https://www.banxico.org.mx/SieInternet/consultarDirectorioInternetAction.do?accion=consultarCuadro&idCuadro=CP150&locale=es
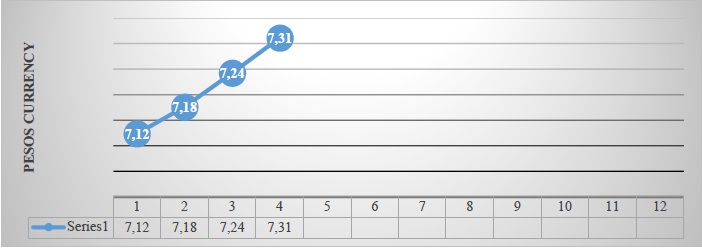
Graph 12 Investment units, January-April 2022
On April 1, 1995, the Decree establishing the obligations corresponding to the UDIS was published in the Official Gazette of the Federation. Since April 4, 1995, the Bank of Mexico publishes in the Official Gazette of the Federation the value in the national currency of the Investment Unit, for each day.
The financial ratios over time with the purpose of facilitating their application in the various sections of the organizations have been classified to measure liquidity, asset management, profitability, the market, etc.
The survival, growth and obtaining profits in organizations requires the use and interpretation of financial and economic indicators that allow deciphering the external and internal environments of organizations. At the beginning of the 20th century, the use of financial ratios became clear and, with the intention of facilitating their application, they have been standardized and classified with the intention of measuring liquidity, asset management, profitability, the market, etc. However, taking into consideration the many differences that exist in organizations, the current use of these ratios cannot or should not be standardized, since each company or entity has characteristics that identify it, being able to mention, among others, the sector to which it belongs, the productive activity or services that it develops, etc. Although the usefulness of financial ratios is recognized, finally, according to the study carried out by Alberto Ibarra Mares (2006), we can mention that the potential of this tool is only in an initial phase of conceptual and empirical development.

