


 nueva página del texto (beta)
 Inglés (pdf)
 Artículo en XML
 Referencias del artículo
 Enviar artículo por email
 Citado por SciELO
  Similares en
SciELO
Similares en
SciELO 
 Permalink
Introduction
Non-alcoholic fatty liver disease (NAFLD) is a clinical entity characterized by the presence of hepatic fatty infiltration, without significant alcohol consumption or other chronic liver diseases caused by steatogenic drugs consumption, hepatitis C virus infections, Wilson's disease, abetalipoproteinemia, parenteral nutrition, and starvation1. This disease includes a broad spectrum of liver injury, ranging from isolated steatosis to non-alcoholic steatohepatitis (NASH), fibrosis (FIB), and eventually cirrhosis2.
At present, it is a significant cause of chronic liver disease and is estimated that in some years, it will be the main reason for liver transplantation and death related to hepatic disease, especially in those with NASH3. Its prevalence increases with age and obesity and is strongly associated with the presence of metabolic syndrome and cardiovascular diseases. It is essential to underscore that NAFLD adverse outcomes are accelerated in certain ethnic groups. The Hispanic population has been associated with the higher prevalence and the higher progression rates to NASH and FIB4. Polymorphisms in genes such as PNPLA3 can determine the differences in the disease progression5.
NAFLD estimated that the prevalence in the general population is around 25%6 but is higher in patients with diabetes (22-43%) and obesity (51%-81%)7. In Mexico, a study in which patients attended a medical check-up, reports a hepatic steatosis prevalence diagnosed by ultrasound of 49.19%8, while another research shows that patients suffering from metabolic syndrome have a 82.9% prevalence9.
The difficulties that exist to assess NAFLD prevalence and diagnosis are due to the absence of signs and symptoms in the early stages, liver enzymes low sensitivity to designate the disease, and the need to resort to liver biopsy as a reference standard for the diagnosis despite its limitations.
Within the histopathological evaluation, two scales are mainly used to stage the findings of FIB or steatosis: The METAVIR scale and the Scheuer classification, which grade FIB in five stages: F0 (absence of FIB), F1 (portal FIB), F2 (periportal FIB), F3 (FIB bridges between portal spaces), and F4 (cirrhosis)10, and for steatosis classification a semiquantitative qualification system of four grades (from 0 to 3) is used, which takes into account only macrovesicular and microvesicular steatosis and evaluates the percentage of hepatocytes infiltrated by lipid vacuoles (S0, < 5%; S1, 5%-33%; S2, > 33%-66%; S3, > 66%)11,12.
Given that interventions such as liver biopsy have limitations, such as invasiveness and possible progression in steatosis severity, this process cannot be performed repeatedly, so it should be reserved only for selected patients, according to the NASH risk or more advanced stages, also patients with persistent increases in hepatic transaminase levels despite lifestyle interventions13. Furthermore, it can be associated with complications and impaired accuracy due to sampling variability because the tissue contained in a needle biopsy sample is only a small fraction of the liver, and the findings of the sample may not show what happens in the whole organ14,15.
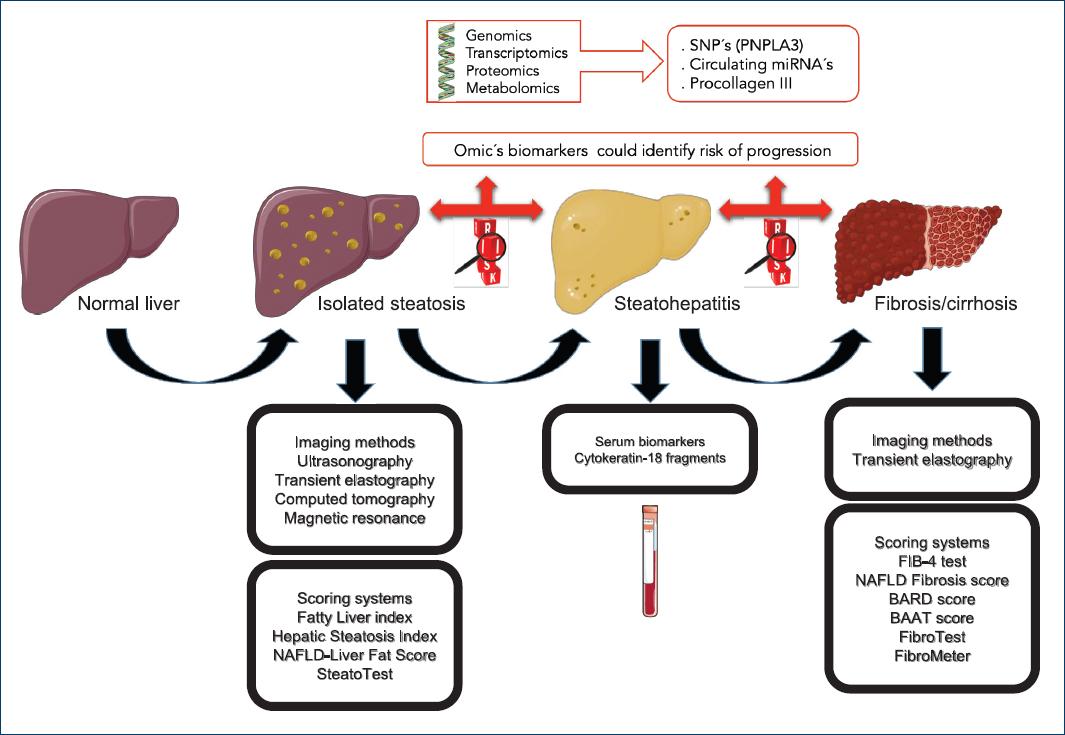
Non-invasive methods rely on different approaches, such as imaging techniques, including ultrasonography, transient elastography, computed tomography, and magnetic resonance, which can detect simple hepatic steatosis but cannot distinguish NASH16. In addition to different biomarkers that can diagnose and differentiate NAFLD from NASH and FIB, which include acute phase proteins, cytokines, apoptosis, and oxidative stress markers. Furthermore, a variety of miRNAs are expressed in NAFLD and could be used as blood biomarkers of progressive liver injury; for example, hepatic and serum levels of miRNA-122 have been associated with steatosis, NASH, and FIB17.
Laboratory studies
Non-invasive tests such as serum biomarkers could be used as screening tools to identify patients with liver steatosis (such as, the fatty liver index [FLI], hepatic steatosis index [HSI], and SteatoTest) for diagnosing or staging FIB (such as NAFLD FIB score [NFS], BAARD score, BAAT score, and FIB-4), and also for NASH diagnosis (for example, circulating keratin 18 fragments). This scoring system has several advantages, including its high applicability, reproducibility between laboratories, and its widespread availability for non-patented models, since these scores occupy routine laboratory tests (Table 1).
Table 1 Scores for the diagnosis of steatosis and liver fibrosis.
| SCORE | Components and Equation | Cut points | Se % | Sp% | PPV% | NPV% | AUC |
|---|---|---|---|---|---|---|---|
| Steatosis | BMI, PA, TG, GGT | <30 | 87 | 64 | 0.84 | ||
| FLI | FLI = (e 0.953*loge (triglycerides) + 0.139*IMC + 0.718*loge (GGT) +0.053* abdominal girth- 15.745) / (1 +e 0.953*loge (triglycerides) + 0.139*BMI + 0.718*loge (GGT) + 0.053* abdominal girth - 15.745) * 100 | ≥60 | 61 | 86 | |||
| AST/ALT, IMC, diabetes | <30 | 93 | 40 | 84 | 0.81 | ||
| HSI | HSI=8*ALT/AST + BMI (+2; if DM2; +2; if woman) | >36 | 46 | 92 | 86 | ||
| NAFLD-LFS | SM, DM2, fasting insulin level, fasting AST level and AST/ALT. NAFLD-LFS: -2.89+ 1.18 *MS (yes= 1/no= 0) + 0.45 * DM2 (yes= 2/no= 0) + 0.15 * fasting insulin (mU/L) +0.04 * fasting AST (U/L) - 0.94 * AST/ALT | >-0.640 | 85 | 70 | 0.87 | ||
| SteatoTest | ALT, BT, GGT, CT, TG, glucose, A2M, ApoA1, haptoglobin, age, BMI and gender. | ≥0.3 | 90 | 45 | 90 | 45 | 0.80 |
| ≥0.7 | 39 | 81 | 71 | 81 | |||
| Fibrosis | |||||||
| FIB-4 | AST, ALT, platelets and age. | <1.45 | 67 | 71 | 38 | 90 | 0.80 |
| FIB-4= Age (years) * AST [U/L]/ (Platelets [109/L]*(ALT [U/L])1/2) | >3.25 | 23 | 97 | 65 | 82 | ||
| NFS | AST/ALT, platelets, albumin, diabetes, age, BMI and gender. | <-1.455 | |||||
| NFS= -1.675 + 0.037 * Age (years) + 0.094 * IMC (kg/m2) + 1.13* GAA/diabetes (yes= 1, no= 0) + 0.99*AST/ALT - 0.013*platelets (109/L) -0.66* albumin (g/dl) | >0.676 | 72 | 70 | 56 | 93 | 0.88 | |
| 90 | 85 | 0.82 | |||||
| BAAT | BMI, aged, ALT and TG. | 0-1 | 100 | 47 | 45 | 100 | 0.71-0.86 |
| BMI (≥ 28 Kg / m2), age (50 years), ALT (≥ 2 normal) and serum triglycerides (≥ 150 mg/dL) | 4 | 14 | 100 | 100 | 73 | 0.81 | |
| BARD | BMI, AST/ALT, diabetes. (BMitalic> 28 = 1 point, AST/ALT > 0.8 = 2 points, DM = 1 point) | 2-4 | 76 | 61 | 27 | 96 | 0.81 |
| FibroTest | TB, GGT, A2M, ApoA1, haptoglobin, BMI, gender and age. | 0.30 | 81 | 56 | 71 | 98 | 0.88 |
| 0.70 | 97 | 89 | |||||
| Fibrometer | AST, ALT, platelets, ferritin, glucose, age, weight. | 0.71 | 79 | 61 | 0.94 |
ALT: alanine aminotransferase; AST: aspartate aminotransferase; ApoA1: apolipoprotein A-1; AUC: area under the curve; A2M: a2-macroglobulin; BMI: body mass index, FLI: fatty liver index; GGT: gamma-glutamyl transferase; HIS: hepatic steatosis index; MS: metabolic syndrome; NAFLD-LFS: NAFLD Liver Fat Score; NFS: NAFLD fibrosis score; NPV: negative predictive value; PPV: positive predictive value; Se: sensitivity; Sp: specificity; TB: total bilirubin; TC: total cholesterol; TG: triglycerides; WC: waist circumference.
Steatosis biomarkers
Many scores have been developed for steatosis detection, such as the FLI, the HS), the NAFLD liver fat score (NAFLD-LFS), and a patented algorithm, the SteatoTest®.
FLI includes four variables; body mass index (BMI), waist circumference, triglycerides, and gamma-glutamyl transferase (GGT), ranging from 0 to 100. Using ultrasound as a reference in 216 subjects with and 280 without suspected liver disease, this group demonstrates that a FLI < 30 rules out the presence of steatosis with a sensitivity of 87% while a FLI ≥ 60 rules in the presence of steatosis with a specificity of 86%. These scores were validated with liver ultrasound and nuclear magnetic resonance with spectroscopy18.
HSI was developed in a cross-sectional study with 10,724 health check-up subjects (5362 cases with NAFLD vs. age- and sex-matched controls), also using the ultrasound as a reference, and is composed of three variables; aspartate aminotransferase (AST)/alanine aminotransferase (ALT) ratio, BMI, and the presence of diabetes. HSI reported an area under the receiver operating curve (AUROC) of 0.81 and a sensitivity of 93% for diagnosing steatosis at a cutoff < 30 and a specificity of 92% for excluding steatosis at a cutoff > 36, validated by ultrasound19.
The NAFLD-LFS combines five variables; metabolic syndrome, type 2 diabetes, fasting insulin level, fasting AST levels, and the AST/ALT ratio. It has been proposed as a predictor of increased liver fat content, using proton magnetic resonance spectroscopy as a reference in 470 subjects. The score had an AUROC of 0.87 in the estimation and 0.86 in the validation group. The optimal cutoff point of −0.640 predicted the presence of liver steatosis with a sensitivity of 86% and specificity of 71%20.
SteatoTest® (BioPredictive, Paris, France) is a patented algorithm for liver steatosis diagnosis, and the only serum biomarker that used liver biopsy as reference. It has been developed in a cohort with various causes of chronic liver disease, chronic hepatitis C, chronic hepatitis B, and alcoholic liver disease. This algorithm range from 0 to 1, combines 12 parameters including age, gender, BMI, ALT, a2-macroglobulin, apolipoprotein A-1, haptoglobin, total bilirubin, GGT, total cholesterol, triglycerides, and glucose. In the initial study, the AUROC value for steatosis diagnosis was 0.80, with 90% sensitivity at a 0.3 cutoff and 88% specificity at a 0.7 cutoff21. This test has been validated with liver biopsy in 494 patients with severe obesity22.
NASH biomarkers
For NASH diagnosis, many serum biomarkers have been investigated, but cytokeratin 18 (CK-18), a physiological degradation marker is now validated. CK-18 fragments come from hepatocytes apoptosis mediated by the enzyme caspase 3 and can be measured in serum by immunoassay. Circulating serum levels of CK-18 to predict NASH in patients with NAFLD reported AUROC of 0.83, the sensitivity of 0.75, and specificity of 0.81 for a CK-18 value of about 250 U/L, in the initial study of validation23.
FIB biomarkers
In the evaluation of liver FIB, scoring systems have generally demonstrated more utility in advanced FIB detection than early stages. Patients with FIB require management to avoid or treat the complications of the disease (Fig. 1). The liver FIB scores that have been proposed for the detection and staging includes the FIB-4 test, NFS, BARD score, the BAAT score, and two patented algorithms, the FibroTest, and FibroMeter.
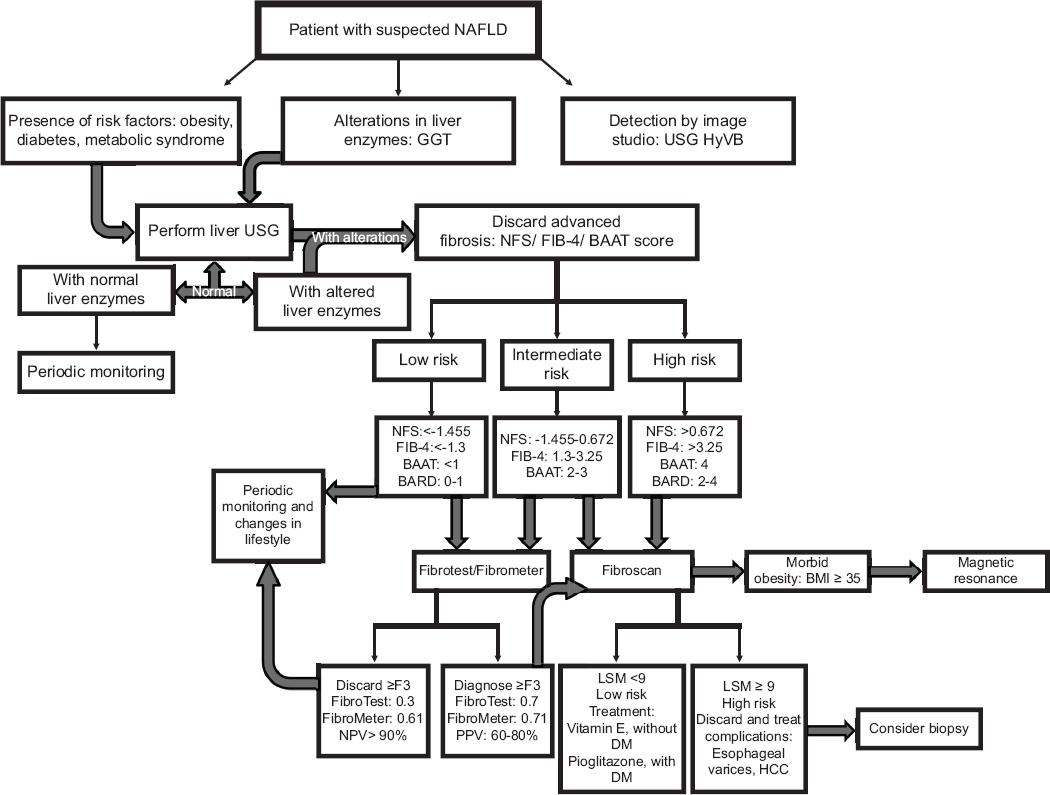
Figure 1 Algorithm suggested for the use of non-invasive tests in risk stratification of patients with suspected non-alcoholic fatty liver disease.
The FIB-4 test developed in patients with HIV/HCV coinfection combines platelet count, age, and ALT to asses FIB. At a cutoff of < 1.45 in the validation set, the negative predictive value to exclude advanced FIB was 90%, with a sensitivity of 70%. A cutoff of > 3.25 had a positive predictive value of 65% and a specificity of 97%24.
The NFS has been developed in a group of 733 patients with NAFLD, confirmed by liver biopsy, using six variables; age, hyperglycemia, BMI, platelet count, albumin, and AST/ALT ratio; which were significantly associated with severe FIB or cirrhosis in patients with HGNA confirmed by biopsy. This scoring system had an AUROC of 0.88 and 0.82 in the estimation and validation groups, respectively. Using the low cutoff score of −1.455, advanced FIB could be excluded with a negative predictive value of 93% and 88% in the estimation and validation groups, respectively. Applying the high cutoff score of 0.676, advanced FIB presence could be diagnosed with a positive predictive value of 90% and 82% in the estimation and validation groups, respectively25.
The BARD score, performed on patients diagnosed with proven liver biopsy of NAFLD, is an algorithm that combines three variables: BMI, AST/ALT ratio, and the presence of diabetes into a weighted sum (BMI > 28 = 1 point, AST/ALT ratio of > 0.8 = 2 points, diabetes = 1 point), to finally generate a score from 0 to 4. A score of 2-4 was associated with an OR for advanced FIB of 17 and a negative predictive value of 96%26.
The BAAT score was developed in a group of 93 patients with a BMI higher than 25 kg/m², using four variables, the presence of each variable gives 1 point in the combined score: age ≥ 50 years, BMI ≥ 28 kg/m2, and triglycerides ≥ 1.7 mmol/L. A total score of 0 or 1 had a 100% negative predictive value for septal FIB, the sensitivity of 100% for a specificity of 47%. In contrast, a score of 4, present in only four patients, all of whom with septal FIB, gave a sensitivity of 14% and a specificity of 100% and a positive predictive value of 100% for septal FIB detection27.
FibroTest® (BioPredictive, Paris, France) is a patented panel for the detection of FIB in NAFLD, combining five biochemical markers; haptoglobin, a2-macroglobulin, apolipoprotein A1, total bilirubin, and GGT, corrected for age and gender, a mean standardized AUROC of 0.84 for advanced FIB in patients with NAFLD was demonstrated28.
FibroMeter® (Echosens, Paris, France) is another commercial algorithm, which was initially developed for staging FIB in patients with viral hepatitis, the AUROC for stages F2-F4 was 0.883, compared with 0.808 for the FibroTest, and combines seven variables; age, weight, fasting glucose, AST, ALT, ferritin, and platelet count29.
A recent meta-analysis based on 64 studies in 13,046 NAFLD patients, comparing APRI, FIB-4, BARD score, NFS, FibroScan M probe, XL probe, SWE, and MRE for diagnosing advanced FIB reported summary AUROC's values of 0.77, 0.84, 0.76, 0.84, 0.88, 0.85, 0.95, and 0.96, respectively30.
Imaging techniques
Imaging is an essential tool when it comes to NAFLD diagnosis and is mainly requested when there is clinical doubt since the patient has obesity, type 2 diabetes mellitus or hyperlipidemia, also when the patient has abnormal liver function tests or when there are irregular findings in imaging studies done for other reasons (Table 2).
Table 2 Advantages and disadvantages of imaging techniques for fatty liver disease evaluation
| Diagnostic tool | Advantage | Disadvantages | Clinical application |
|---|---|---|---|
| Ultrasound | High availability and low cost | Operator dependent, does not distinguish between fibrosis and steatosis, not useful in mild degrees, in addition to having low specificity | First diagnostic tool |
| Transient elastography | Evaluate both steatosis and fibrosis at the same time, and is simple and fast (<5 min) | Not very accessible, the cut points are not very well defined | Useful to discard advanced fibrosis or early stages of steatosis |
| Computed tomography | It is not operator-dependent | Radiation exposure | Diagnosis of steatosis in the liver study for other causes |
| Magnetic resonance | High specificity | Low availability and high cost | Useful in clinical trials and in patients with morbid obesity |
Ultrasonography
Abdominal ultrasound is the most used imaging method for steatosis detection since it is widely available, well-tolerated, and cheap, but its diagnostic sensitivity is lower when there are mild degrees of liver fat infiltration. Typical ultrasonography features of fatty infiltration are based on visual assessment of the echogenicity intensity; where Grade 0 presents a normal echogenicity; Grade 1 a slight and diffuse increase in echogenicity in the hepatic parenchyma, with diaphragm and intrahepatic vessel borders standard visualization; Grade 2 a moderate and diffuse increase in fine echoes, with intrahepatic vessels impaired visualization; and Grade 3 a marked increase in echogenicity, with poor or no visualization of the intrahepatic vessel borders and diaphragm31.
The ultrasound has a high accuracy in fatty liver diagnosis when the total area of hepatic steatosis exceeds 20%, with a sensitivity of 96%, but decreases when there is a fat infiltration of 5% at a sensitivity of 82%32, in addition to the intraobserver and interobserver variability reported in several studies as a dependent operator tool33. Severe obesity may also limit the ability to reliably detect liver echogenicity due to thick layers of subcutaneous fat. In a study that evaluated NAFLD in obese patients with an average BMI of 34.1 kg/m2, it shows a low sensitivity of 63% was found, taking into account only the echogenicity of the hepatic parenchyma34. On the other hand, a meta-analysis that included 34 studies, with 2815 patients to which underwent an ultrasound, it is observed that around 20-30% have hepatic steatosis with a sensitivity of 84.38% and a specificity of 93.6%, taking liver biopsy as a reference35.
There are limited data available that support the use of ultrasound as a screening tool; however, the clinical criterion is essential to use it as a first-line diagnostic test, mainly in patients with risk factors and abnormal liver enzymes, especially GGT36. Nevertheless, due to its low cost, safety, and accessibility, ultrasound is probably the imaging technique of choice for fatty liver detection in clinical centers, as recommended by the European guidelines for the management of NAFLD in patients at risk37.
Transient elastography
Transient elastography was developed to quantify the liver rigidity by vibrations of low amplitude and low frequency that are transmitted by the transducer, which induce an elastic cutting wave that propagates through the hepatic tissue. Pulse-echo ultrasound acquisition is used to follow the propagation of the wave and to measure its velocity, which is directly related to tissue stiffness. The more rigid the tissue, the faster the shear wave propagates, allowing the degree of liver FIB to be determined, with results that are expressed in kilopascals (kPa), and range from 2.5 to 75 kPa with average values around 5 kPa, higher in patients with elevated BMI or metabolic syndrome38. At the same time, it evaluates the degree of steatosis determined by the controlled attenuation parameter (CAP) through an algorithm that calculates the ultrasound signal attenuation and is expressed in dB/m, with ranges of 100-400 dB/m, and a median for each degree of steatosis of: 205 (180-227) dB/m for S0; 245 (231-268) dB/m for S1; 299 (268-323) dB/m for S2; and 321 (301-346) dB/m for S3, according to one of the first cohorts for its validation, in patients with chronic liver disease due to various causes39. However, these values can be influenced by other factors such as BMI increase or other comorbidities such as diabetes, as reported by Karlas et al. in a meta-analysis that included 2735 patients, where it was observed that CAP values were influenced by an estimated change of 10 dB/m (3.5-16) for diabetics and 4.4 dB/m (3.8-5.0) per unit of BMI, in this study, the optimal cutoff points were 248 dB/m (237-261) and 268 dB/m (257-284) for those above S0 and S1, respectively40.
Transient elastography is performed with the patient in a supine position, with the right arm in maximal abduction, placed behind the head to facilitate access to the right hepatic lobe through an intercostal space, where the tip of the transducer is placed; then, the operator presses the probe button to start the measurements that quantify an approximate volume of 1 cm wide and 4 cm long, this area is at least 100 times bigger than a biopsy sample, and therefore, more representative of the hepatic parenchyma41. The depth of the measurement is between 25 and 65 mm with the M probe, and between 35 and 75 mm with the XLprobe, the probe will be chosen as suggested by the automatic device selection tool42. At least, ten successful acquisitions should be performed on each patient, only the results obtained with a success rate of at least 60% and an interquartile range (IQR) ≤ 30% of the mean liver stiffness measurement value (IQR/liver stiffness measurement ≤ 30%)43, and an IQR of the CAP ≤ 40 dB/m should be considered reliable44.
An accuracy variation for diagnosis and staging has also been reported through the use of the "XL" probe, developed for obese patients evaluation. In a study in which 210 patients were evaluated for FIB degree by transient elastography using the XL probe compared to biopsy, a discrepancy was observed in the staging of FIB in 11% (n = 24), not attributable to age, sex, and presence of diabetes or hepatitis B or C virus infection. In the presence of morbid obesity, a 4-5 times higher discordance was found regarding a BMI ≥ 40; however, it was less likely to follow the valid measurement criteria as described previously45. Furthermore, in a recent prospective multicenter study, which evaluated the accuracy to diagnose steatosis and liver stiffness through transient elastography, using biopsy as the standard of reference, showed that in 450 patients studied for suspected NAFLD, reported AUROC values that vary from 0.70 to 0.89. The CAP accuracy was highest at a stage of S1, with an AUROC of 0.87, a sensitivity of 0.80, and a specificity of 0.83 at a threshold of 302 dB/m selected by maximizing Youden's index. For the S2 stage, accuracy dropped to an area under the curve of 0.77 with the corresponding sensitivity of 0.70 and specificity of 0.76 with an AUROC of 0.70, while for stage S3 had a sensitivity of 0.72 and a specificity of 0.6346.
On the other hand, for liver stiffness, the accuracy was highest at the F4 threshold, with an AUROC of 0.89, a sensitivity of 0.85, and a specificity of 0.79 at a threshold of 13.6 kPa selected by maximizing Youden's index. The accuracy was lower at the lower FIB thresholds, dropping to an AUROC of 0.80 for F3 with a sensitivity of 0.71 and a specificity of 0.75 at a threshold of 9.7 kPa. For F2 there is an AUROC of 0.77, with a sensitivity of 0.71 and a specificity of 0.70 at a threshold of 8.2 kPa. The type of probe or the steatosis did not affect the liver stiffness; the only parameter that significantly affected the liver stiffness was the FIB stage. The cutoff values for CAP staging S1, S2, and S3 were 302 dB/m, 331 dB/m, and 337 dB/m, respectively. In the case of liver stiffness, the cutoff values for F2, F3, and F4 were 8.2 kPa, 9.7 kPa, and 13.6 kPa, respectively46.
Therefore, it can be observed that the ideal applicability of transient elastography would be in a patient without morbid obesity, with risk factors to detect initial degrees of fatty infiltration or in the follow-up of patients with chronic liver disease to rule out severe FIB or cirrhosis.
Acoustic radiation force impulse (ARFI)
It is an imaging method where tissue compression is not performed manually, but by an ARFI, which deforms the tissue, after the pressure pulse is applied, the displacement is measured. It consists on pulsed beams generation by means of long-lasting trains to create radiation forces that cause displacements located within the tissue to measure a quantitative shear-wave velocity (m/s). These displacements are recorded by ultrasound, generating a map of the tissue elasticity, without using an external force47.
This process is repeated for all the scan lines so that two images, pre- and post-compression, are obtained, which are processed using a cross-correlation algorithm, with which it will be possible to compute the tissue position differences in each point along the axial axes, between the states of relaxation and compression. The amount of displaced tissue reflects its elasticity and will be directly proportional to the magnitude of the force applied and inversely proportional to the stiffness of the tissue48.
Computed tomography
Computed tomography evaluates steatosis through the reduction in liver attenuation, which can be measured in Hounsfield units (HU) and appears as hypodense liver parenchyma. The attenuation value in a healthy liver is around 50-57 HU without contrast, which is reduced due to the lipid overload in the liver that facilitates the appropriate determination of the steatosis degree, reaching a specificity of 100% when the fat content is higher than 30%49. There are five criteria to diagnose steatosis for non-contrast computed tomography: hepatic attenuation ≤ 40 HU, liver attenuation less than spleen attenuation minus 10 HU, hepatic attenuation less than or equal to spleen attenuation, liver attenuation less than or equal to spleen attenuation plus 5 HU, and liver to spleen attenuation ratio ≤ 1.1. These vary in specificity and sensitivity, reaching higher values when the fat content is higher than 30%; however, there is a lack of histological correlation, without being able to exclude the coexistence of NASH or early cirrhosis. Furthermore, possibly an iron deposit could mask some cases of steatosis. Due to the above, in addition to the emitted radiation and high cost, it does not allow its frequent use50.
MRI
MRI is the most accurate method for the detection and quantification of hepatic fat content, the hepatic steatosis detection in MRI is based on the images of chemical change, the protons in water and fat may be in two modes, in-phase and out of phase. Fat liver content caused a decrease in hepatic signal intensity in the out of phase modality in comparison with the "in phase" images, being able to measure the degree of fat infiltration from this difference in intensity. MRI is not suitable as a screening method due to high costs and limited comparability between different MRI techniques51.
Conclusions
Today, there are several non-invasive methods to evaluate and diagnose fatty liver disease, which are very helpful for the attending physician, and they can be used according to the resources of the different care centers.
In the first instance, when there is a patient with suspected fatty liver, the first thing that is suggested is to look for associated comorbidities such as the presence of obesity, metabolic syndrome, diabetes, or abnormal liver function tests. In case of alterations, it is proposed to perform a liver ultrasound, being a cost-effective imaging technique in primary care, if it comes out with alterations it is advisable to prepare some biochemical test to rule out liver FIB. If this evaluation comes out with modifications, the next step would be to continue with an imaging technique, either transition elastography, which has the advantage of evaluating both steatosis and FIB degree at the same time or MRI that is the most accurate imaging method to quantify fatty liver disease, since it can differentiate between NASH and non-progressive NAFLD. Until now, the best marker in blood to detect NASH is CK-18, however to identify liver FIB there are several tests and algorithms that are quite useful. Finally, in case the physician still has uncertainty, he could request a liver biopsy (Figs. 1 and 2).
The suggested that algorithm for the use of non-invasive tests in patients with suspected NAFLD is mainly for first-contact physicians, since an early diagnosis of liver steatosis could slow the progression and therefore the prevalence of the disease, as well as minimize costs. The algorithm also offers multiple options for both biochemical and imaging tools that are affordable for all types of patients or health centers.
On the other hand, liver diseases genomics and transcriptomics have changed dramatically in the past decade, aided by the emergence of technologies such as microarrays and massive sequencing; however, studies on epigenetic factors expression and their functional effect on NAFLD development are still missing; therefore, it would be of great interest to identify and characterize the differential expression profile of epigenetic factors to look for a molecular signature or a biomarker that can predict the development and severity of the disease and help to make an early diagnosis. In addition, it is desired to know the physiological microenvironment that could favor the complications in the patient's health (Fig. 2).

