


 nova página do texto(beta)
 Inglês (pdf)
 Artigo em XML
 Referências do artigo
 Enviar este artigo por email
 Citado por SciELO
  Similares em
SciELO
Similares em
SciELO 
 Permalink
Introduction
The World Health Organization has recognized that, for the first time in the history of humanity, there will be 1.5 billion people ≥ 65 years old. Similarly, in Mexico, statistics show the population's rapid aging, by 2015, the aging index being 38.0 for every person of ≥ 60 years old among 100 children and young. Particularly, in Mexico City, the index was 71.7. A consequence of such epidemiologic transition, alongside aging itself, is a major risk for illness and prevalence of geriatric syndromes, manifesting a greater functional impairment, dependence, and mortality1,2.
Frailty syndrome is defined as a state of greater vulnerability secondary to an impaired resolution to homeostasis after a stressing event. It is a disorder that implies multiple intertwined physiological indexes, with a gradual diminution of the physiological reserve, as expected in the elderly, but in an accelerated fashion and with a rapid onset of failure of those homeostatic physiological mechanisms, which are determined by genetic and environmental factors, combined with epigenetic mechanisms that could be especially important in the aging process, thus conditioning an adverse prognosis3-6.
One of the main frailty study models is the phenotypic one proposed by Fried et al., who established five variables: unintentional loss of weight, self-reported exhaustion and/or fatigue, low level of physical activity, delay in walking speed, and a decrease in muscle strength. Those who scored three or more were considered frail; one or two, pre-frail and those with none of these variables were considered non-frail or robust. Follow-up evaluations included falls, mobility, functionality, hospitalizations, and death, with more adverse results in those persons categorized as frailty7.
Besides the one proposed by Fried, there are other study models for frailty syndrome. This lack of consensus about which model should be used for diagnosis sets limited and diverse data about the prevalence of frailty syndrome in the elderly. By performing studies of these geriatric syndrome allows us to know what are the long-term care necessities for the elderly and to assess the repercussions on health costs for the patients, their families, and the health systems. To know the prevalence and to prevent or treat, the frailty has become a priority in the world, with the intention to reduce the level of dependence, institutionalization, long-term assistance necessity and the medical and social costs that these clinical condition arises.
In worldwide population studies, the frailty prevalence varies from 4.9% to 27.3%4. In the population studied by Fried, 7% was classified as frailty, 47% as pre-frail, and 46% as non-frail (or robust)7. In Latin America, the prevalence of frailty syndrome ranges from 30% to 48% in women and 21% to 35% in men8,9. In Mexico, the prevalence has been estimated to be 39% in the general population, 45% in women, and 30% in men8. Other studies published in Mexico have found a prevalence of up to 87% for seniors of more than 65 years old in Family Medicine Units of the Mexican Institute of Social Security10. A cross-sectional study conducted in Mexico City that associated frailty with health-linked quality of life found a prevalence of 12.7% frailty, 38.9% pre-frail, and 48.4% non-frail11.
In the Hospital General de México "Dr. Eduardo Liceaga," two previous studies performed in 1998 and 2015 reported prevalences of 16.5% and 31.2%, respectively, with frailty syndrome in the elderly going to ambulatory consultation12,13. We propose to determine the current prevalence using the model proposed by Fried.
Materials and methods
A descriptive, cross-sectional, observational, and retrospective study was performed in the Hospital General de México "Dr. Eduardo Liceaga." Both male and female senior patients above 70 years old who attended to the ambulatory clinic and the Dayroom of the Geriatrics Department were enrolled. The size of the population was 109, based on previously reported prevalence in a pilot study performed in the same hospital14.
Seniors who agreed to participate signed an informed consent form. We included seniors above 70 years old who attended to ambulatory consultation and the Dayroom of Geriatrics Department at Hospital General de México "Dr. Eduardo Liceaga," from January 2014 to December 2015; we excluded those who were unable to walk independently or needed assistance as well as those who had a moderate or severe neurocognitive impairment diagnosis.
An integral geriatric assessment was performed in each participant; demographic, anthropometric, comorbidities, and functionality data were obtained. Modified Fried criteria were used for the initial classification in robust, pre-frail, and frailty (Table 1). We considered frailty those who met three or more criteria, pre-frail 1 or 2 criteria, and non-frail or robust those with no criteria at all.
Table 1 Modified Fried criteria for frailty syndrome
| Unintentional weight loss | Unintentional weight loss ≥ 3 Kg in the last year or BMI < 21 Kg/m2 |
| Decreased strength | Referred by the patient in response to the question of the CES-D depression questionnaire: in the last week, how often have you felt that everything you do requires an effort or that you cannot continue? |
| Decreased walking speed | Walking time/4 m. 20% slower (by gender and height)15 Men: Height ≤ 159 cm: time ≥ 4.9 s Height > 159 cm: time ≥ 6,5 s Women: height ≤ 153,7 cm: time ≥ 6,5 s height > 153,7 cm: time ≥ 7,0 s |
| Self-reported fatigue | Unable to get up from a chair without using the arms, in correlation to grasp strength |
| Decreased physical activity | Referred by the patient in response to the question: do you perform activities such as daily walking, gardening, or some sport once a week? |
Frailty: three or more criteria; pre-frail: 1 or 2 criteria; Robust: zero criteria; BMI: body mass index.
Age was registered in years old to the date of data collection. Gender was male or female, according to their phenotypic traits. Weight was measured in a calibrated medical scale, with the patient wearing only the hospital gown. Height was registered with stadiometer for adults, placing the patient in a standing position, with no shoes, head uncovered, the back against the stadiometer, head, shoulders, hips, and heels held together and the tips separated, forming a 45° angle. Arms are hanging loose and downward to both sides of the body: steady head, and eyes gazing to front. Height was measured in meters with decimals. Body mass index (BMI) was calculated according to the formula BMI = (weight in kilograms) ÷ (height in meters)2.
Katz index evaluated activities of daily living and was estimated qualitatively to the degree of level of independence of the patient. Six daily activities were studied. The Katz index ranges eight possible scores: (A) independent in all functions; (B) independent in all functions except one; (C) independent in all functions except bathing and any other; (D) independent in all functions except bathing, dressing and any other; (E) independent in all functions except bathing, dressing, toilet, and any other, (F) independent in all functions except bathing, dressing, toilet, mobility, and any other of the two remaining; (G) dependent in all functions, and (H) dependent in at least two functions but no classifiable as C, D, E, or F.
The instrumental activities of daily living were evaluated with the Lawton and Brody index. This index consists of eight items; each item has a number assigned. The total score is the sum of all responses and ranges from 0 (maximum dependence) to 8 (total independence). The considered activities are the capacity for using the telephone, transportation, medication, finances, shopping, cooking, household chores, and laundry. Five is considered a cutting point 5-8: independence and 0-4: dependence.
The presence of chronic diseases was registered, such as diabetes mellitus type 2, hypertension, ischemic cardiopathy, chronic lung disease, and osteoarthrosis, considering presence or absence of comorbidities. It was evaluated if the patient used some assistance tool for deambulation such as a cane or adult walker.
We used SPSS-24 software for statistical analysis. It was an investigation with minimal risk, according to the General Law of Health regarding Health Investigation, given that the data were obtained by means of common procedures: medical chart, physical examination, and geriatric clinical scales.
Results
A total of 112 patients were enrolled, all of them participated in the analysis. The study was descriptive and cross-sectional. The mean age was 80 years old, with a standard deviation (SD) of ± 5.63. The minimum age was 70 years old and maximum age was 94 years old. About 74.1% (83 patients) were female. Mean BMI was 26.7 with a SD of ± 4.01.
The presence of one or more comorbidities such as type 2 diabetes mellitus, hypertension, ischemic cardiopathy, chronic obstructive pulmonary disease, chronic cardiac insufficiency, or asteoarthrosis was registered in 86.6% of the population. The sociodemographic and clinical characteristics are described in table 2.
Table 2 Population's sociodemographic and clinical characteristics
| Variables | Values |
|---|---|
| Total | 112 (100%) |
| Age in years (mean ± SD) | 80 (± 5.63) |
| Female n (%) | 83 (74.11%) |
| BMI (mean ± SD) | 26.77 (± 4.01) |
| Comorbidities n (%) | 97 (86.6%) |
| Katz n (%) | |
| A | 104 (92.86%) |
| B | 6 (5.36%) |
| C | 2 (1.79%) |
| Lawton and Brody | |
| Independent | 97 (86.61%) |
| Dependent | 15 (13.39%) |
| Walking seconds (mean ± SD) | 6.12 (± 3.47) |
| Velocity m/s (mean ± SD) | 1.19 (± 1.03) |
| Assistance tool n (%) | 32 (28.57%) |
BMI: body mass index; SD: standard deviation.
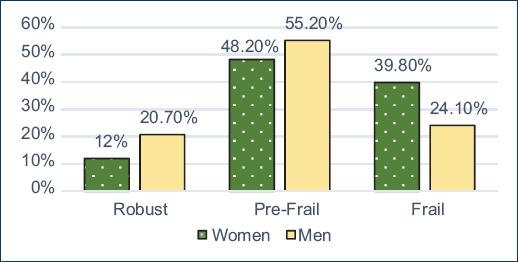
Out of the total population, 14.3% was classified as non-frail, 50% as pre-frail, and 35.7% as frailty. As for gender, 24.1% of men and 39.8% of women were classified as frailty (Fig. 1). BMI was 27 in the robust, 26.8 in pre-frail, and 26.5 in the frailty. Comorbidities were found in 14% of non-frail and 36.1% in frailty. The number of comorbidities was 1.69, 1.59, and 1.75, respectively, in the same groups.
In evaluating functionality, it was found that 14.4% of the robust, 51% of the pre-frail, and 34.6% of the frailty had a Katz A score. Katz B scores were found in 16.7%, 33.3%, and 50%, in the same order. Classification in the Lawton and Brody index resulted in independent for 16.5%, 52.6%, and 30.9% of the robust, pre-frail, and frailty, respectively. Regarding the 4 m walking test, the meantime for the robust was 4.85 s, 5.29 s for the pre-frail, and 7.79 s for the frailty. The calculated speed for each group was 1.2 m/s in the robust and pre-frail, and 1.1 m/s in the frailty (Fig. 2). Usage of an assistance tool for walking was 6.3% in the robust and 46.9% in the pre-frail and frailty.
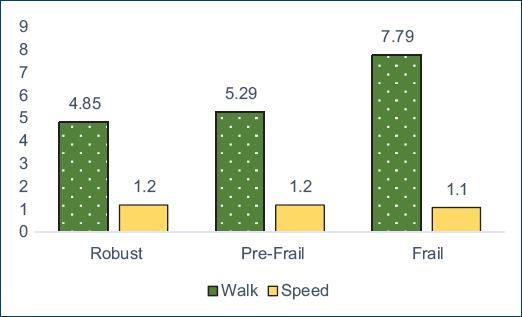
Figure 2 Average walk (time in seconds to travel 4 m) and speed (walk/4) according to the classification of frailty phenotypes.
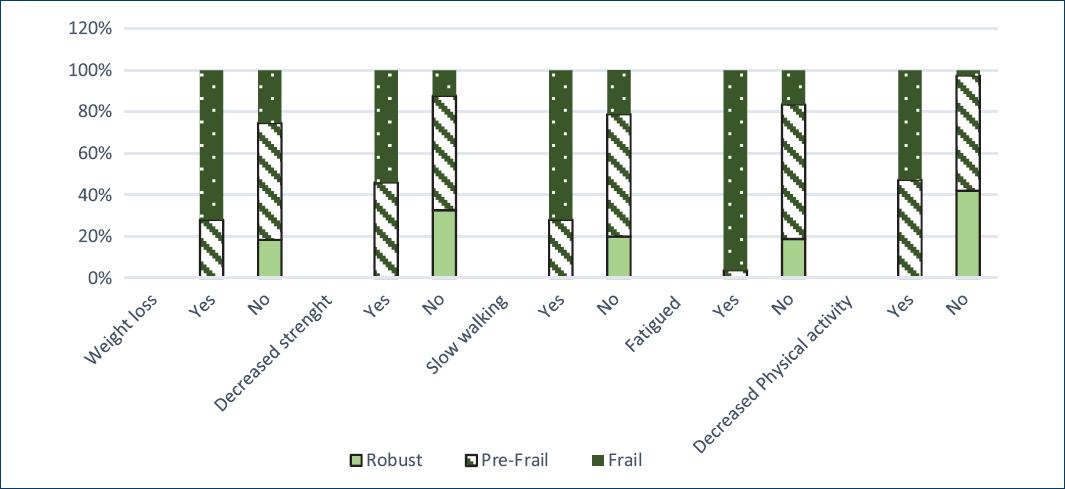
As for the variables comprising the frailty syndrome in the fragile group, the findings showed unintentional loss of weight in 72%, decreased strength in 54%, decreased walking speed in 71.9%, self-reported fatigue in 96.3%, and, finally, reduced physical activity in 52.7%. None of the robust met any criterion (Table 3).
Table 3 Comparison between sociodemographic and clinical characteristics according to frailty diagnosis
| Variables | Non-frail | Pre-frail | Frailty | p value |
|---|---|---|---|---|
| Total n (%) | 16 (14.3) | 56 (50) | 40 (35.7) | |
| Gender n (%) | 0.24a | |||
| Women | 10 (12) | 40 (48.2) | 33 (39.8) | |
| Men | 6 (20.7) | 16 (55.2) | 7 (24.1) | |
| Mean age (± SD) | 81 (± 4.5) | 80(± 5.8) | 80(± 5.7) | 0.81b |
| BMI | 27.0( ± 3.2) | 26.8(± 3.6) | 26.5(± 4.7) | 0.91b |
| Comorbidities | 0.96a | |||
| Yes (%) | 14 (14.4) | 48 (49.5) | 35 (36.1) | |
| No (%) | 2 (13.3) | 8 (53.3) | 5 (33.3) | |
| # of comorbidities | 1.69 (± 1.01) | 1.59(± 1.02) | 1.75(± 1.12) | 0.76b |
| Katz (%) | 0.88a | |||
| A | 15 (14.4) | 53 (51.0) | 36 (34.6) | |
| B | 1 (16.7) | 2 (33.3) | 3 (50) | |
| C | 0 (0) | 1 (50) | 1 (50) | |
| Lawton and Brody (%) | ||||
| Independent | 16 (16.5) | 51 (52.6) | 30 (30.9) | 0.018a |
| Dependent | 0 (0) | 5 (33.3) | 10 (66.7) | |
| Walking | 4.85 (± 0.74) | 5.29 (± 2.9) | 7.79 (± 4.1) | < 0.001b |
| Speed | 1.20 (± 0.19) | 1.20 (± 1.05) | 1.1 (± 1.2) | 0.98b |
| Assistance tool (%) | ||||
| Si | 2 (6.3) | 15 (46.9) | 15 (46.9) | 0.15a |
| No | 14 (17.5) | 41 (51.3) | 25 (31.3) | |
| Weight loss (%) | < 0.001a | |||
| Si | 0 (0) | 7 (28) | 18 (72) | |
| No | 16 (18.4) | 49 (56.3) | 22 (25.3) | |
| Decreased strength (%) | < 0.001a | |||
| Si | 0 (0) | 29 (46) | 34 (54) | |
| No | 16 (32.7) | 27 (55.1) | 6 (12.2) | |
| Decreased walking speed (%) | < 0.001a | |||
| Si | 0 (0) | 9 (28.1) | 23 (71.9) | |
| No | 16 (20) | 47 (58.8) | 17 (21.3) | |
| Self-reported fatigue (%) | < 0.001a | |||
| Si | 0 (0) | 1 (3.7) | 26 (96.3) | |
| No | 16 (18.8) | 55 (64.7) | 14 (16.5) | |
| Decreased physical activity (%) | < 0.001a | |||
| Si | 0 (0) | 35 (47.3) | 39 (52.7) | |
| No | 16 (42.1) | 21(55.3) | 1 (2.6) |
aChi-square distribution;
bANOVA.
Discussion
The prevalence of frailty in the total population of this study was 35.7%, almost 28.7% more than the prevalence reported by Fried7. Nonetheless, the prevalence is more similar to the one reported in Latin America, between 21% and 48%, being 8% more compared with the prevalence reported by Runzer-Colmenares et al.15, who used the modified Fried criteria, the same in this investigation. Set side by side with the prevalence in Mexico, the numbers are similar to the ones in this investigation, 39% versus 35%15-18.
In comparison with the previous studies conducted in the Hospital General de México, the results are 20% and 6% more than the investigations of 1998 and 2015, repectively12,13. However, none of them used the Fried nor the modified Fried criteria.
The wide variability in respect to international studies is related to social and even more economic differences. It is relevant to mention that this variability is also related to the tool used for this investigation, biomedical factors, and different to other criteria such as the one proposed by Rockwood that includes psychosocial and environmental factors4; also different is the SHARE-FI scale in Spanish primary care for non-institutional patients; other scales: FRAIL, Tilburg Frailty Indicator, or Groningen Frailty Indicator19,20.
In regard to gender, frailty prevalence was more frequent in women than in men, 39.8% versus 24.1%; this matches the Gale, Cooper, and Sayer study21 that used Fried criteria, in which prevalence was 16% in women and 12% in men. Similarly, frailty prevalence for Latin America ranged from 30% to 48% in women and 21% to 35% in men9. Finally, it goes together with the prevalence reports from Mexico with 45% in women and 30% in men8. In the present study, there was a nonsignificant p (0.24) for gender, thus showing no relationship between prevalence and gender. Garcia-Gonzalez et al.16 conducted a study in Mexican population in which frailty index was significantly higher in women in groups < 80 years old. It is relevant to emphasize that women represented 74.11% of the studied population, which could have been a factor that inclined for that higher index in women.
Association between BMI and frailty has been studied several times with different results; some suggest that pre-frail and frailty elderly have lower BMI values22. However, there have also been reported higher BMI values associated with frailty23. In this study, BMI was 26.5 ± 4.7 in the fragile, the patients being classified with overweight, and despite there was no statistical difference between the evaluated groups, there is correspondence with another findings reported in Latin population where higher BMI values are associated with a higher probability for frailty9,24. In this fashion, it is evident that the results with BMI are not the best way to evaluate the nutritional state of the patients and its relation with frailty. Nowadays, we can study the nutritional state by bioelectrical impedance, a more sensitive method to measure body composition that translates the nutritional state, more useful than BMI for frailty diagnosis25.
The presence of comorbidities was 36% in the frailty, and the average of comorbidity was 1.75 ± 1.12 in the same group. However, comorbidity presence was more frequent in the pre-frail group, with 49%. It is well known that the presence of multiple diseases is more frequent at advanced ages, according to the Survey of Health, Well-Being and Aging in Latin America and the Caribbean26, which showed that 34.1% of the elderly suffer from two or more chronic diseases. It has been described the relation of frailty with physiopathological mechanisms and epidemiological characteristics of diseases, especially the chronic ones27. In contrast to findings by Fried et al.7, which showed an association between moderate and severe comorbidity of the Charlson scale and the frailty phenotype, in the present study, we did not find the foretold association, probably due to the fact that comorbidity was categorized only as present or absent.
According to the Katz index applied in this population, just A, B, and C categories were found, and there was no significant statically association with frailty syndrome. In a study conducted by Sousa and dos Santos28, 11.4% was found to be frailty for daily activities. In our study, exclusion criteria were patients uncapable of walking independently or with the need of assistance, moderate, or severe dementia, which categorized our population in Katz A, B, and some C. Nonetheless, when considering the Lawton and Brody index, 30% of the fragile were classified as independent, whereas in the study by de Sousa and dos Santos it was 7.3%. In that sense, statistical significance was found (p = 0.018), suggesting that the inability to perform instrumental activities of daily living predicts frailty syndrome in the elderly. In Mexico, Sánchez-García et al.29 found that 45% and 47% of their population presented one or more inabilities in the basic and instrumental activities scales, respectively.
In the walking test, it was found that the frailty traveled 4 m with a meantime of 7.79 ± 4.1 s, showing a statistical significance (p < 0.001) in comparison with the other groups, the meantimes being 5.29 ± 2.9 and 4.85 ± 0.74 s for the pre-frail and non-frail, respectively. In the study by Sánchez-García et al.29, with Mexican population, walking speed was 6.6 ± 0.2 for women and 3.6 ± 0.2 for men. In the study by Runzer-Colmenares et al.15, the group classified as frailty had a walking velocity of 8.3 ± 6.1, also showing the statistical difference with the other groups within the population. However, in categorizing the patients calculating their velocity (walking/4) to obtain the meters/seconds traveled, this significance is lost. We can conclude that the walking test categorizes differences between individuals, whereas walking velocity, a standard measurement, translates the behavior as a group.
In our study, probably in association with the functional characteristics of the population, the usage or not usage of assistance tools for deambulation appears to be of little significance for frailty diagnosis, at least for the basic activities of daily life.
Finally, when evaluating the variables, we used to calculate the frailty phenotype according to the modified Fried criteria, each one of them resulted to be statistically significant for the classification of frailty in this population, being the expected result, for those were the variables directly involved for the diagnosis. In decreasing order, the most frequent variables for the frailty diagnosis were: self-reported fatigue 96.3%, unintentional loss of weight 72%, decreased walking speed 71%, decreased strength 54%, and decreased physical activity 52.7% (Fig. 3).
Conclusions
Frailty prevalence was 35.7% in the elderly ≥ 70 years old that attended to ambulatory consultation and to the Dayroom of Geriatrics Department at the Hospital General de México "Dr. Eduardo Liceaga," using the modified Fried criteria. In this same population and according to the phenotypic categorization of the frailty syndrome, the prevalence of patients classified as robust, pre-frail, and frailty was 14.3%, 50%, and 37.7%, respectively.
In comparison with fragility prevalence reported by other studies, it was 28% more than the one reported by Fried et al.7, being more similar to the one reported in Latin America, between 21 and 48%, and the ones in Mexico of 39%. Finally, 8% more than the one reported by Runzer-Colmenares et al.15, who used, specifically, the same criteria that we used for this study. Comparing with previous studies carried on in the Hospital General de México, they are 20% and 6% more than the investigations of 1998 and 2015, respectively, although in those studies, it was not used the Fried nor the modified Fried criteria for the classification.
Considering the high prevalence of this syndrome in the population of elderly and that it has been demonstrated the ability to recover from frailty to pre-frail by means of medication, nutrition, and physical exercise (and as preventive measures), its diagnosis and awareness of the current prevalences are tools to design, look for and project plans in benefit of quality of life and functionality of our patients.

