


 nova página do texto(beta)
 Inglês (pdf)
 Artigo em XML
 Referências do artigo
 Enviar este artigo por email
 Citado por SciELO
  Similares em
SciELO
Similares em
SciELO 
 Permalink
Introduction
The erythrocytes, commonly known as red blood cells (or RBCs), are the most numerous cells in the blood, and their main function is to transport oxygen to the different tissues in the human body and collect CO2 to be discarded. RBCs are composed by a thin semi-permeable membrane and are extremely flexible since it is continually forced to slide through blood vessels of different diameters, even smaller than the diameter of an average erythrocyte1. This mechanical stress is well tolerated under normal conditions by most of the RBC. The external membrane is permeable to different substances: water, oxygen, carbon dioxide, etc., but is impermeable to the hemoglobin which is one of its main internal constituents. Under isotonic conditions (0.9% solution of NaCl), this membrane is in osmotic equilibrium with the aqueous solution in which they are suspended (plasma) and regulate the balanced exchange of substances between the erythrocyte and the plasma, allowing volumes of nutrients enter and leave the cell without significant changes in the volume or physical properties. The erythrocytes are physically biconcave disc-shaped structures containing no nucleus; they have a diameter of approximately 7.5 µm, a thickness of approximately 2 µm and an expected lifetime of 100-120 days2.
As mentioned above, an erythrocyte in its daily function is under different types of stress; however, this flexibility can be affected by a great variety of factors, such as the presence of some hemolytic pathologies or the effect of some drugs. Consequently, the membrane may become more fragile, and the erythrocytes' integrity may be compromised. The capacity of erythrocytes to resist the rupture of their membranes that produce the expulsion of the intracellular material to the plasma is called the membrane's osmotic fragility (OF)3.
The OF test is one of the oldest methods to study the physical state of erythrocyte4, among other factors, gives us information about their health status. Its use to determine the resistance of erythrocytes was initially described by Parpart and Lorenz in 19475. The test's procedure seeks to quantify the percentage of erythrocytes' lysis in a blood sample under osmotic stress conditions by means of mixing it with NaCl solutions of decreasing concentration, ranging from 0.9% to 0% (hypotonic solutions). The hemolysis quantification in percentage plotted versus NaCl concentration is called the OF curve. Any shift of the OF curve to low or high concentrations of NaCl with respect to healthy RBC may indicate the presence of any alteration or a pathology4,6,7. In the standard method, the percentage of hemolyzed erythrocytes in a suspension is determined by measuring the absorption coefficient of the medium surrounding the erythrocytes. It is required to remove all cells from suspension, whether their membrane is ruptured or not, and then measure the extinction coefficient of light passing the remaining homogeneous liquid6. The procedure is time consuming, and measurements of the extinction coefficient are prone to many errors, thus require skilled personnel to perform accurate readings.
In this work, we present an easy-to-implement method to quantify the degree of hemolysis of a blood sample by measuring the refractive index (RI) of whole blood dilutions using an Abbe refractometer. Depending on the saline concentration of the solution used to dilute the blood, a percentage of erythrocytes will swell, and burst, releasing its content into the plasma (being the hemoglobin the main component) and changing the sample's RI directly proportional to the percentage of hemolysis.
The RI describes how light propagates through a medium and is defined as the ratio of the speed with which a light beam propagates in an unknown medium (vm) to that in a vacuum (v0), that is, n = vm/v0. Optical refractometry is a basic tool for pharmaceutical, food, chemical, and oil industries, as well as in many research laboratories8-12. The Abbe refractometer is a well-established optical device that measures directly and instantly the RI of transparent or translucent liquids. It is a robust instrument that can be used outside the laboratory and has a relatively low cost. It does not require expensive maintenance.
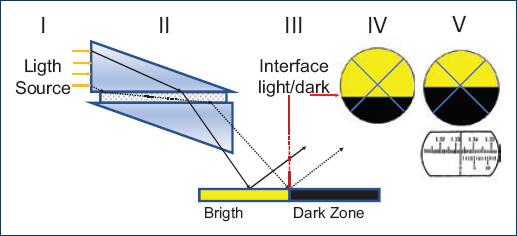
The Abbe refractometer consists of two prisms, the upper prism is a diffuser and the lower prism has a higher RI (n ≈ 1.7). The sample to be analyzed is placed between the two prisms forming a uniform film of approximately 100 microns wide (II in Fig. 1). When illuminated with a light source (I in Fig. 1), the diffuser prism scatter light in all directions. The scattered rays travel the full width of the sample. All scattered rays reaching the lower prism refract inside the lower prism at angles of refraction up to the critical angle defined by the RI of the lower prism and the sample. The rays refracted at the critical angle correspond to rays traveling parallel to the prisms' interfaces. No light can be refracted at angles of refraction higher than the critical angle. Hence, a sharp light/dark angular border is formed at the critical angle when viewing the lower-prism/sample interface (III in Fig. 1). This angular border can be directly observed by an operator using suitable optics, and its location in an appropriate angular scale gives the RI if the sample (IV-V in Fig. 1). A common uncertainty in RI measurements in inexpensive Abbe refractometers is ± 0.0002.
Materials and methods
We first prepared ten hypotonic samples (HS) by diluting a saline solution of 0.9% w/v of NaCl with tri-distilled water, decreasing in approximately 10% the concentration of NaCl with each dilution. The resulting samples (including isotonic sample) are shaken gently to make the mixture homogeneous. Then, we measured the RI of each sample using the Abbe refractometer. Table 1 shows RI values measured from tri-distilled water (M0) to the isotonic serum (M10) (Table 1).
Table 1 Refractive index (calculated and measured with Abbe refractometer) of NaCl and tri-distilled water solutions at different concentrations
| Sample | Nacl (%) | RI (calculated) | RI Abbe (± 0.0002) |
|---|---|---|---|
| M0 | 0 | 1.3327 | 1.3329 |
| M1 | 0.09 | 1.3328 | 1.3332 |
| M2 | 0.18 | 1.3330 | 1.3334 |
| M3 | 0.27 | 1.3332 | 1.3335 |
| M4 | 0.36 | 1.3334 | 1.3337 |
| M5 | 0.45 | 1.3336 | 1.3338 |
| M6 | 0.54 | 1.3337 | 1.3348 |
| M7 | 0.63 | 1.3339 | 1.3342 |
| M8 | 0.72 | 1.3341 | 1.3340 |
| M9 | 0.81 | 1.3343 | 1.3344 |
| M10 | 0.9 | 1.3345 | 1.3345 |
RI: refractive index.
The theoretical RI values of HS were calculated by the volume-weighted rule formula for the RI of miscible mixtures, that is,
n = fv · 1.3327 + (1 - fv) · 1.3345 (1)
Where fv is the volume fraction of tri-distilled water, 1 - fv is the saline solution volume fraction and 1.3327, 1.3345 the RI of tri-distilled water, and the 0.9% w/V NaCl/water solution, respectively, measured with the Abbe refractometer. In figure 2, the bars (gray line) represent the error associated with the measurements made with the Abbe (± 0.0002) (Fig. 2).
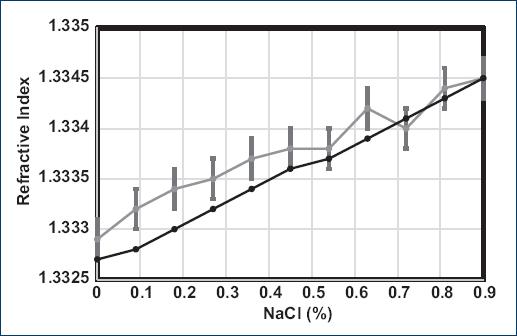
Figure 2 Graph of refractive index (RI) of M0-M10 samples measured with an Abbe refractometer (gray line), and the RI calculated by 1 (black line).
Peripheral blood samples obtained by venipuncture of nonhospitalized and healthy volunteers were obtained through the standard procedure of blood extraction and stored in a heparinized vacutainer tube. To obtain the curve of the RI of blood dilutions versus the NaCl concentration, we mixed a volume of 0.2 ml of whole blood and 0.8 ml of one of the hypotonic solutions, at this volume ratio (20-80%, respectively). The changes in RI due to the release of hemoglobin by the hemolysis in the samples are large enough to be measured by the Abbe refractometer. The values for the tri-distilled water (M0) and the isotonic serum (M10) are taken as the reference values for 100% and the 0% hemolysis, respectively. The whole blood is added to the HS and mixed homogeneously by reabsorbing the sample gently 2 times with a micropipette and then leave the sample to rest for 6 min. Finalizing this time, we measure the RI with an Abbe refractometer 2WAJ (at λ = 589 nm). This process is repeated for all HS, including the isotonic solution.
Results
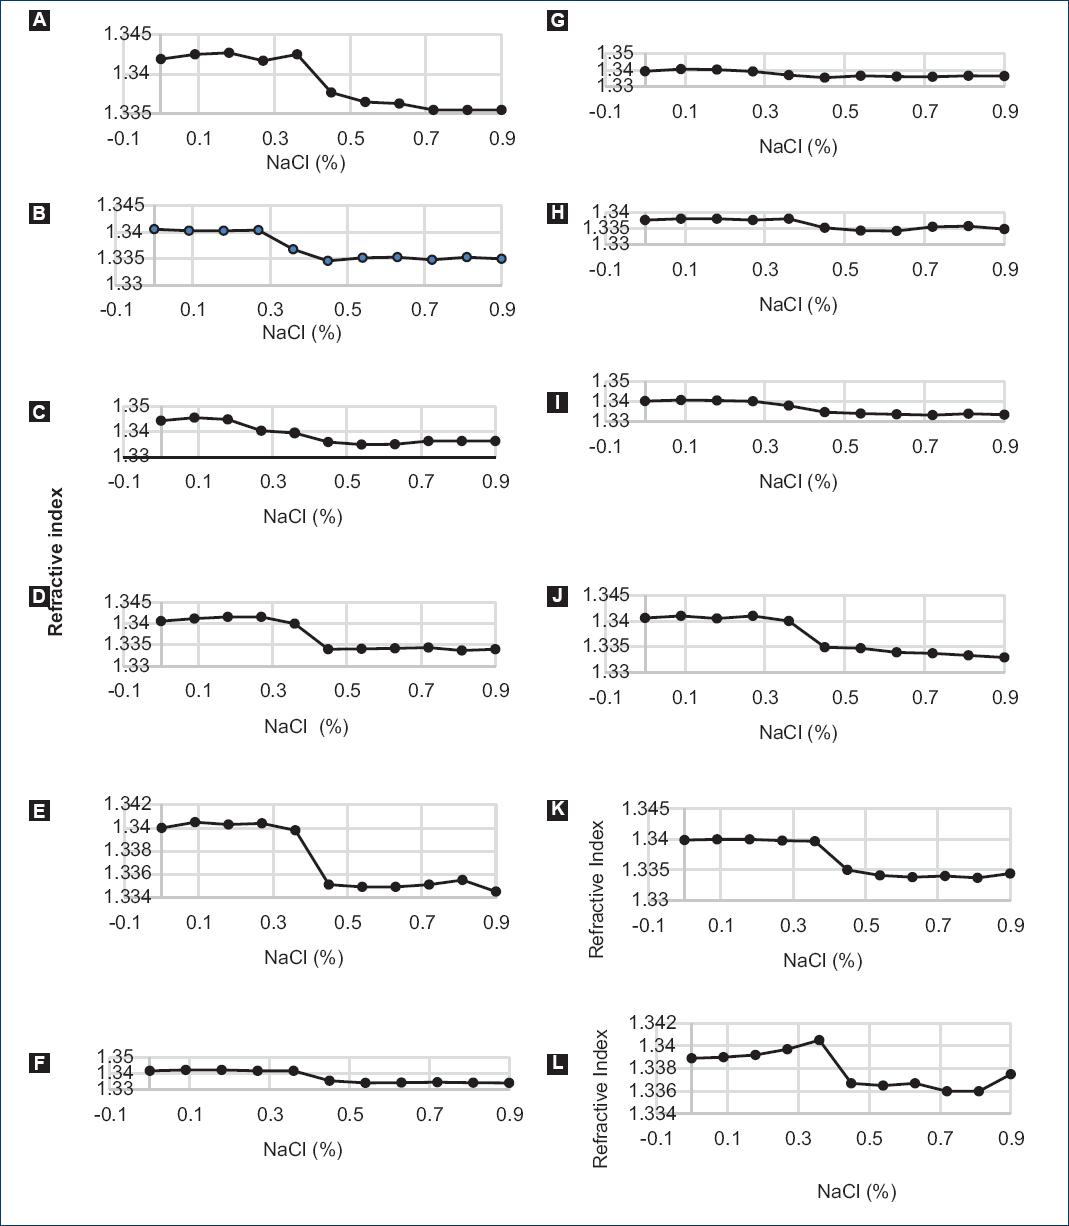
In figure 3A-L, we show the RI of the blood dilutions as a function of the NaCl concentration from the 12 volunteers. The variations in the curves for healthy volunteers can be explained due to the age, sex, and genetic diversity of the donors' population. These factors modulate the characteristics of RBCs that result in a difference in the process of recovery of erythrocytes under different stress conditions and shows a different hemolysis process13. A more detailed analysis of these differences is left for later work (Fig. 3).
In figure 4A (black line), we plot the RI average curve from the blood samples as a function of the salt concentration, the bars represent the standard deviation from the experimental data. For comparison, in figure 4B, the OF curve (gray line) is expressed in percentage of hemolysis from experimental data obtained from five healthy volunteers six using the standard procedure: measuring the absorbance (at 540 nm wavelength) of blood dilutions in hypotonic media after removing the remaining erythrocytes, and then calculating the percentage of lysis14 (Fig. 4).
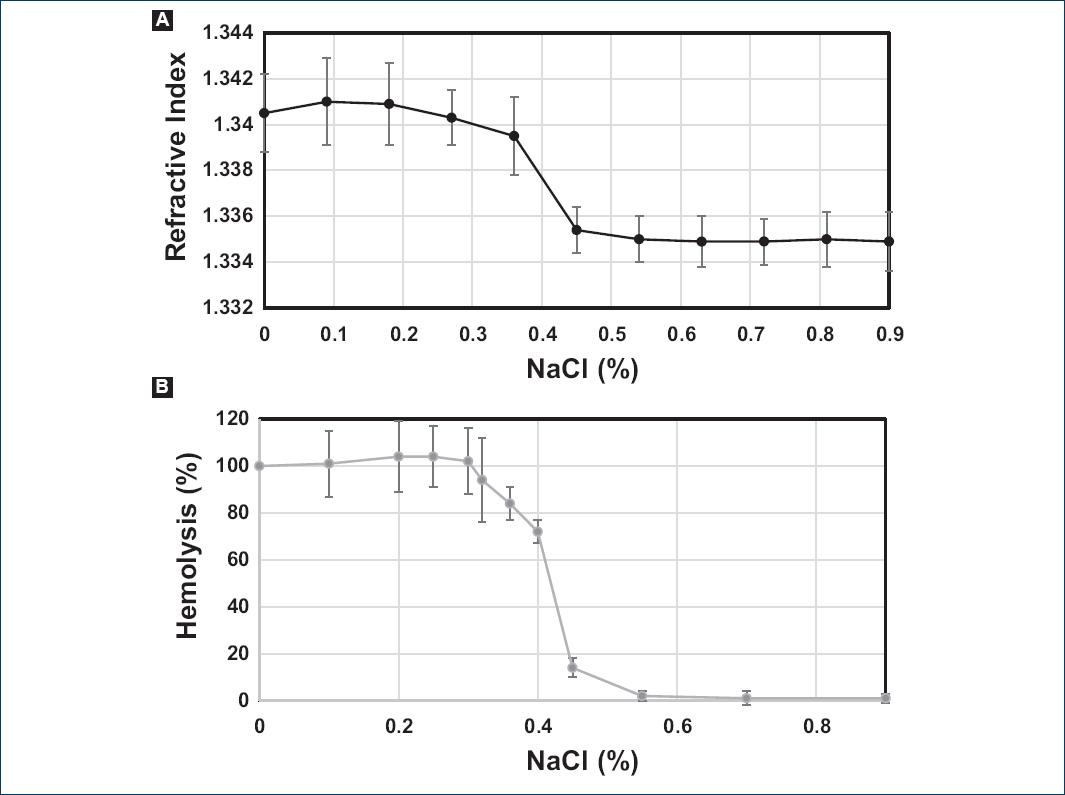
Figure 4 Comparison between the curves of the refractive index. A: percentage of hemolyzed blood. B: at different hypotonic NaCl concentrations. A: the bars in the average curve show the standard deviation (SD) that was obtained were obtained from the 12 experimental data. B: its respective SD was reported in reference6.
In figure 4A, we can appreciate that from 0.0% to 0.36% w/V concentration of NaCl, the RI average value obtained in this work is about 1.3403 ± 3.0 × 10⁻³. For these salt concentrations, hemolysis is complete, and most of the hemoglobin of the erythrocytes is dissolved in the plasma. In these cases, the borderline that serves to determine the value of the RI in the Abbe refractometer (Fig. 5A) is very sharp and easy to read. This behavior changes to concentrations of 0.36 and higher, where the value of RI falls for all samples. This can be understood from the fact that the percentage of ruptured erythrocytes is lower because the concentration of NaCl is approaching the isotonic solution. Then, the number of erythrocytes that remain complete increases and tends to settle on the refractometer lower prism. These full erythrocytes scatter light and the borderline that serves as a reference in the Abbe becomes diffuse as time passes (Fig. 5B), so measurements should be done immediately after depositing the sample to be able to appreciate a borderline as sharp as possible and record the correct RI's value, for this reason, the measurements were repeated two times for concentrations of 0.45 NaCl and higher. After each measurement, we used tri-distilled water to avoid contamination and prepare the refractometer for the next measurement (Fig. 5).
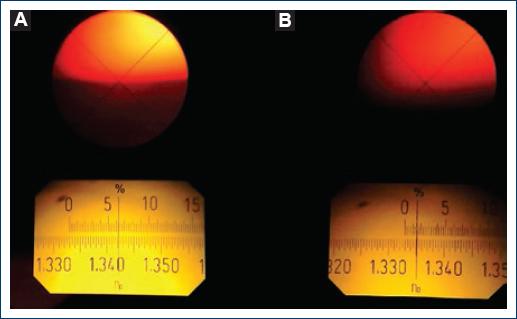
Figure 5 A: borderline, as seen in the Abbe refractometer for high hemolyzed blood samples. B: borderline for samples with a low percentage of hemolysis (diffuse).
We can appreciate in figure 4 that both experimental curves for the RI and the percentage of hemolysis obtained by the standard procedure are qualitatively very similar in their behavior4,6. It shows clearly that for high levels of hemolysis in the suspension, the RI is maximum and as the percentage of lysis decreases, the RI is lower.
Discussion and conclusions
We found that despite the optical absorption and scattering of light in whole blood dilutions in hypotonic solutions, it is possible to measure the RI of the dilutions using a standard Abbe refractometer. The ratio of 20-80% of whole blood HS dilutions was found to be the optimal concentration for measurements in our Abbe refractometer to measure the change in the samples' RI due to the hemoglobin released in the plasma.
We obtained experimental measurements of the RI of whole blood dilutions in hypotonic solutions from 12 healthy volunteers using a commercial Abbe refractometer (2WAJ). From the data obtained, we present curves for each volunteer, and the average curve is compared with the experimental results for OF curve presented in Alonso-Geli et al.6 Both average curves show similar behavior and coincide to determine that hemolysis for healthy volunteers starts at 0.45-0.36 of NaCl. We found from these measurements that the mean value of the infrared of high hemolyzed blood samples is 1.3403 ± 3.0 × −3 and non-hemolyzed blood is 1.3350 ± 0.001.
In summary, we illustrate in this work the viability of simple and rapid procedure to determine the standard OF curve of blood samples and provides information related to the integrity of the erythrocyte membrane, which can be an indicator of the health status of people associated with different pathologies such as: thalassemia15,16, macro or micro spherocytosis17,18, and paroxysmal nocturnal hemoglobinuria19,20, among others21. One of its main advantages over other techniques such as flow cytometry is that it is a rapid and economical test so that it does not require large material resources and can open the way to develop new robust instruments for the early detection of different blood pathologies.

