


 nova página do texto(beta)
 Inglês (pdf)
 Artigo em XML
 Referências do artigo
 Enviar este artigo por email
 Citado por SciELO
  Similares em
SciELO
Similares em
SciELO 
 Permalink
Introduction
Metabolic syndrome (MS) is a clinical condition that includes multiple risk factors for cardiovascular diseases such as obesity, high blood pressure or hypertension, dyslipidemia, and abnormal glucose metabolism, which directly increase the risk of coronary heart disease, atherosclerotic cardiovascular disease, and type 2 diabetes mellitus1,2. MS is associated with the presence of overweightness and obesity3. It has been observed that individuals diagnosed with abdominal obesity are more prone to the development of MS and metabolic alterations than those diagnosed with peripheral obesity4. In Mexico, health and nutrition surveys have determined that seven out of ten adults have some degree of overweightness or/and obesity5.
Several international institutions describe the diagnostic criteria or components of the MS6. In 2010, the Asociación Latinoamericana de Diabetes (Latin American Diabetes Association - ALAD) determined the diagnostic criteria for specific MS in Latin American7.
MS prevalence in developing countries ranges from 20% to 50% in obese Mexican adults8, children, and adolescents with a 62% MS prevalence rate9. In addition, studies with US adolescents have shown that the presence of MS generates a decrease in cognitive abilities and skills10 that leads to the urgent need to seek predictors and risk factors that are associated with metabolic alterations11 and to a more practical detection of MS12.
Different anthropometric indexes such as body mass index (BMI) and waist-hip ratio are related to changes in metabolism11. Conversely, waist circumference (WC) is a simple and non-invasive measurement that has been shown as a useful parameter to evaluate the distribution of body fat and cardiovascular risk, as well as mortality stemming from these events13,14.
The waist-to-height ratio (WHtR) is an indicator of central obesity and a good predictor of cardiovascular risk15, taking into account the cutoff at 0.516-19. It has been shown that it is a tool with high potential to predict the presence of central obesity, cardiovascular risk, and MS in children12,20,21. However, its utility should be evidenced regarding MS risk and diagnosis in the population of young adults.
The objective of this study is to evaluate the WHtR as a parameter for risk assessment and diagnosis of MS in a population of apparently healthy young adults.
Materials and methods
Study design and participants
This study was approved by the ethics and research committee of the College of Medicine of (Benemérita Universidad Autónoma de Puebla, with number 279. A cross-sectional study was conducted at the Department of Biochemistry of the College of Medicine (Benemérita Universidad Autónoma de Puebla). The research consisted of 1000 individuals, as this number is formed by new students from 2 years, 2015 and 2016. To obtain the sample size, a formula for calculating sample sizes was used for diagnostic test studies22, by taking into account a similar population12. The result of the minimum sample size was 107 subjects.
During the years 2015 and 2016, new students of the College of Medicine were included in the study, aged between 18 and 22 years (men: 18.7 ± 1.79 and women: 18.5 ± 0.8), who were provided with informed consent, without adjacent pathologies and without any inherited family medical history or cardiometabolic alterations. This information was collected by self-report during the medical history assessment of each subject. Subjects who had not undergone blood sampling or anthropometric measurements were excluded from the trial, as well as those who decided to withdraw thereof. Those subjects who presented hemolyzed or lipemic serum samples were also excluded from the trial.
Anthropometric analysis
Anthropometric measurements were taken under the standard conditions and instruments certified by the Ministry of Health of the United Mexican States, the Instituto Nacional de Salud Pública (National Institute of Public Health)23 (INSP) and the International Society for the Advancement of Kinanthropometry (ISAK) using a standardized portable scale for measuring body weight. A Lufkin N215 tape measure was used for measuring height, and a Lufkin W606PM tape measure was used for measuring WC. Both tapes have an accuracy ratio of 0.5 cm.
All subjects were measured for height by maximum traction, in upright, frontal position, with arms parallel to the body. The measurement was made by ensuring that the subject's head, back, calves, heels, and buttocks were in contact with the wall and arms positioned in longitudinal axis of the body. Their heads were placed in straight position according to the Frankfort plane.
The measurement of body mass (weight) was performed with the least amount of clothing possible without undermining relevant bioethical considerations. The subjects were placed in an upright, frontal position with their arms positioned in longitudinal axis of the body.
The WC was measured midway between the last rib and the outer edge of the iliac crest.
An anthropometrist certified by the INSP collected the anthropometrical data. These data and techniques were reviewed by a level 1 kinanthropometrist certified by ISAK. WHtR and BMI calculations were performed, where the latter was categorized for the Mexican population24.
Biochemical analysis
For the biochemical profile of the students included in the study, a sample of venous blood was collected by an ulnar puncture after 12 h of fasting. Blood collection was done between 07:00 and 09:00 AM at the Biochemistry Laboratory of the College of Medicine (of Benemérita Universidad Autónoma de Puebla), for better control of pre-analytical variables. The sample was set aside for settling for 5 min and then centrifuged. Once the serum was obtained, the following metabolites were analyzed: serum glucose, triglyceride, cholesterol, cholesterol high-density lipoprotein (cHDL), cholesterol low-density lipoprotein-(cLDL), cholesterol very LDL (cVLDL), and uric acid (UA) levels, in a Johnson & Johnson VITROS DT60 analyzer. The variables classification measurements were those proposed by ATP III25 for biochemical parameters.
Blood pressure
Blood pressure measurement was performed using a mercury sphygmomanometer following the technique and procedures recommended by the American Heart Association, as per the clinical standards of this technique. A medical-grade digital monitor (Omrom HEM-907 XL) was used. Adults were deemed hypertensive if they presented the following values: systolic blood pressure (SBP) ≥ 140 mmHg or diastolic blood pressure (DBP) ≥ 90 mmHg.
MS
The presence of MS for the purpose of this study and comparison was determined according to the ATP III criteria, which proposes the presence of MS when ≥ three risk factors out of the following five components are present in the same subject:
- WC > 102 cm (> 40 in) in men and > 88 cm (> 35 in) in women
- Serum triglycerides ≥ 150 mg/dL (≥ 1.7 mmol/L)
- Blood pressure > 130/85 mm Hg
- HDL cholesterol ≤ 40 mg/dL (≤ 1.0 mmol/L) in men and ≤ 50 mg/dL (≤ 1.3 mmol/L) in women
-Fasting blood sugar level ≥ 100 mg/dL (≥ 5.6 mmol/L).
Considering that WC should be evaluated according to the region26, the parameter proposed by ALAD for Latin America is the one elected for our study7.
Statistical analysis
Different stratifications were performed for data analysis: nutritional (BMI), chronometric (age), by comorbidity (without adjacent pathologies), by inheritance (inherited family medical history denied), and by previous management (total fasting > 12 h).
For the statistical mathematical processing of the results and analysis of the results, the statistical software GraphPad Prism V.6 for Windows was used. A normality test was applied to each of the variables, by means of the Kolmogórov-Smirnov test. A Mann-Whitney U-test was also used. Quartiles were created with the WHtR results from the total subjects included in the study. WHtR values above quartile three were taken as a specific cutoff point for this type of population (young adults). From this cutoff point, risk analyzes and diagnostic analyzes were performed.
The risk analyses were carried out by odds ratio (OR), testing their statistical significance with Mantel-Haenszel Chi-square. Subsequently, multivariate logistic regression was applied to analyze MS risk for a high WHtR, being adjusted for other risk variables such as gender, age, UA, total cholesterol, and BMI. Epidemiological impact measures were obtained, such as the attributable fraction for the population and the etiological fraction thereof.
A likelihood analysis was performed to obtain the WHtR diagnostic evidence. Sensitivity, specificity, positive (+LR), and negative (−LR) likelihood ratios, Youden's J statistic (J), positive predictive values (PPV), and negative predictive values (NPV) were calculated. Graphs (Receiver operating characteristic [ROC] curves) were carried out to calculate the probability of MS diagnosis and each of the components by means of WHtR by the areas under the curve (AUC), in men and women to validate the cutoff point found in the WHtR diagnosis in men and women.
Results
A sample of 370 subjects, who were potentially eligible, was recruited. Among those subjects who met all the inclusion criteria, 337 subjects were included in the study, to increase the study scope and strength. Forty-two subjects were excluded from the study because of a lack of data for the analysis, and one subject was excluded, from the potentially eligible group, for not wanting to continue with the study.
Normality tests showed that none of the analyzed variables presented a normal distribution. Thus, it was decided that non-parametric tests (Mann-Whitney U-test) would be used for comparisons.
Comparisons of the population features show that there is no difference by sex in age, BMI, WHtR, and cholesterol. Statistically significant differences were found in mass (weight), height, waist, glucose, triglycerides, cHDL, cLDL, cVLDL, UA, and systolic and DBP. All these values were higher in men than in women, although these values were not above the cutoff points that would indicate a metabolic disorder. Only HDL was lower in men than in women, and this value, on average, was below the cutoff point (Table 1).
Table 1 Characteristics of the study population, grouped by gender, comparing anthropometric, biochemical, and clinical data
| Total | Men | Women | p value | |
|---|---|---|---|---|
| 337 | 141 (42%) | 196 (58%) | ||
| Age (years) | 18.6 ± 1 | 18.7 ± 1.79 | 18.5 ± 0.8 | 0.2 |
| Mass (kg) | 63 ± 13 | 70.4 ± 13.5 | 58.4 ± 10 | < 0.0001 |
| Height (cm) | 165 ± 8 | 173 ± 6 | 160 ± 5 | < 0.0001 |
| BMI | 23 ± 3.6 | 23.4 ± 3.9 | 22.7 ± 3.5 | 0.15 |
| Waist (cm) | 81.8 ± 10.5 | 86.4 ± 11 | 78.8 ± 9.2 | < 0.0001 |
| Waist/Height ratio | 0.49 ± 0.05 | 0.49 ± 0.07 | 0.49 ± 0.05 | 0.7 |
| Glucose (mg/dL) | 88 ± 17 | 89.2 ± 9 | 87.6 ± 20.6 | 0.005 |
| Triglycerides (mg/dL) | 116 ± 52.3 | 124.1 ± 55.3 | 110.2 ± 49.1 | 0.01 |
| Cholesterol (mg/dL) | 165 ± 30 | 168 ± 30.2 | 162.2 ± 29.6 | 0.16 |
| cHDL (mg/dL) | 50 ± 14.1 | 47.3 ± 10.1 | 52 ± 16.2 | 0.01 |
| cLDL (mg/dL) | 91.5 ± 25.1 | 95 ± 24.8 | 89 ± 25.3 | 0.02 |
| cVLDL (mg/dL) | 23.3 ± 10.6 | 24.9 ± 11.2 | 22 ± 9.8 | 0.007 |
| Uric acid (mg/dL) | 5.5 ± 1.5 | 6.6 ± 1.3 | 4.8 ± 1.1 | < 0.0001 |
| SBP (mmHg) | 112 ± 9.1 | 115 ± 8.5 | 110 ± 9 | < 0.0001 |
| DBP (mmHg) | 74.5 ± 6.8 | 76 ± 6.9 | 73.6 ± 6.7 | 0.003 |
BMI: body mass index; cHDL: cholesterol high-density lipoproteins; cLDL: cholesterol low-density lipoproteins; VLDL: cholesterol very-low-density lipoproteins; SBP: systolic blood pressure; DBP: diastolic blood pressure; Data compared by Mann-Whitney U-test.
Among the 369 subjects, the mean WHtR was 0.49 ± 0.05. The WHtR value was 0.46 in the first quartile, 0.49 in the second quartile, and 0.53 in the third quartile. The latter value was used as a cutoff point for subsequent risk analysis and diagnosis.
When the values of each MS component were compared in the two groups of WHtR-categorized subjects, greater than 0.53 (above the third quartile) and < 0.53 (below the third quartile), it was observed that triglycerides, cHDL, SBP, DBP, and BMI values are higher in those subjects who have WHtR greater than 0.53. However, when comparing patients who had a metabolic disorder, only hyperglycemia, hypertriglyceridemia, and high-density hypolipoproteinemia were associated with high WHtR. WHtR greater than 0.53 increases the risk of hyperglycemia (OR = 3.3, Confidence interval (CI): 1.2-9.9, p = 0.03), hypertriglyceridemia (OR = 3.7, CI: 2.1-6.5, p < 0.0001) and decreased cHDL (OR = 3, CI: 1.8-5, p < 0.0001). Regarding MS, 19 (5.6%) subjects, among the 337 subjects, presented MS, of these, 18 of them (95%) had WHtR > 0.53 (OR = 71.4, CI: 9.4-545.2, p < 0.0001) (Table 2).
Table 2 Characteristics of the study population, grouped by waist-to-height ratio, comparing anthropometric, biochemical, and clinical data
| WHtR > 0.53 | WHtR < 0.53 | p value | |
|---|---|---|---|
| n | 82 | 254 | |
| Age (years) | 18.78 ± 1.38 | 18.48 ± 0.9 | 0.06 |
| Mass (kg) | 74.96 ± 15.05 | 59.7 ± 9.8 | < 0.0001 |
| Height (cm) | 165 ± 0.09 | 166 ± 0.08 | 0.3 |
| Hyperglycemia (> 100 mg/dL) | |||
| Patients | 8 (9.8%) | 8 (3.1%) | 0.03 |
| Mean glucose (mg/dL) | 89.15 ± 10.6 | 87.54 ± 18.3 | 0.1 |
| Hypertriglyceridemia (> 150 mg/dL) | |||
| Patients | 31 (37.8%) | 36 (14.1%) | < 0.0001 |
| Mean triglycerides (mg/dL) | 150 ± 71.3 | 105 ± 38.5 | < 0.0001 |
| Low cHDL(Men < 50mg/dL, women < 40mg/dL) | |||
| Patients | 47 (57.3%) | 79 (31%) | < 0.0001 |
| Mean cHDL (mg/dL) | 43.7 ± 10.4 | 52 ± 15 | < 0.0001 |
| High systolic blood pressure (SBP) (> 130 mmHg) | |||
| Patients | 5 (6.1%) | 9 (3.5%) | 0.3 |
| Mean SBP | 115 ± 8 | 111 ± 9 | 0.001 |
| High diastolic blood pressure (DBP) (> 85 mmHg) | |||
| Patients | 8 (9.8%) | 13 (5.1%) | 0.2 |
| Mean DBP | 76 ± 7.3 | 74 ± 1.3 | 0.02 |
| Overweightness and obesity (BMI > 24.9) | |||
| Patients | 66 (80.5%) | 27 (10.6%) | < 0.0001 |
| Mean BMI (Kg/m2) | 27.2 ± 3.3 | 21.6 ± 2.6 | < 0.0001 |
| Metabolic syndrome | |||
| Patients | 18 (95%) | 1 (5.3%) | < 0.0001 |
p values were calculated using Mann-Whitney U-test for continuous variables or Chi-square or Fisher's exact test for categorical variables. WHtR: waist-to-height ratio; BMI: body mass index; cHDL: cholesterol high-density lipoprotein.
To improve the risk assessment based on WHtR, different risk models of MS were created, where variables that could be viewed as confounding were added, regarding such risk. In the first model, only WHtR was considered, which showed statistical significance (Beta Coefficient (B) = 4.3, Standard Error (SE) = 1.04, OR = 71.4, 95% CI: 9.4-545.2, p ≤ 0.0001). In the second model, WHtR was adjusted for gender, with WHtR being the only significant ratio (B = 4.3, SE = 1.04, OR = 75, CI: 9.8-578, p ≤ 0.0001). In the third model, WHtR was adjusted for gender and age, with WHtR being significant again (B = 4.2, SE = 1.04, OR = 72, CI: 9.3-552.2, p ≤ 0.0001). In the fourth model for MS risk, WHtR was adjusted for gender, age and BMI, with WHtR being the only variable in the model that predicts the risk of MS (B = 3.4, SE = 1.2, OR = 32.3, CI: 3.1 -333.9, p = 0.004). During the fifth model, hypercholesterolemia was included in the previous variables. In this case, both WHtR (B = 3.5, SE = 1.2, OR = 34.5, CI: 3-397.4, p = 0.005) and hypercholesterolemia (B = 1.4, SE = 0.6, OR = 4.1, CI: 1.2-13.3, p = 0.02) were significant. As for the sixth model that was created, WHtR was adjusted for gender, age, hypercholesterolemia, and low-density hyperlipoproteinemia. In this model, only WHtR (B = 3.5, SE = 1.2, OR = 34.4, CI: 3-394, p = 0.004) was considered as risk variable for MS. In the seventh model, very low-density hyperlipoproteinemia (LDL ≥ 110 mg/dL) was added as a confounding factor in the latter model, in addition to WHtR (B = 2.9, SE = 1.2, OR = 18.6, CI: 1.7-208, p = 0.02) and high VLDL (VLDL ≥ 30 mg/dL) (B = 3.2, SE = 0.84, OR = 25.2, CI: 5-130.5). In the last model, WHtR was adjusted for gender, age, hyperuricemia, hypercholesterolemia, low-density hyperlipoproteinemia, and very low-density hyperlipoproteinemia. In the latter model, WHtR and VLDL were again the variables that were associated with MS risk in the population of young adults (Table 3).
Table 3 OR (95% CI) adjusted for metabolic syndrome
| Coefficientb | Standard error | OR (CI 95%) | p value | |
|---|---|---|---|---|
| Waist-to-height ratio | 2.9 | 1.2 | 18.62 (1.7-208) | 0.02 |
| Gender | −0.04 | 0.8 | 0.96 (0.2-4.4) | 0.96 |
| Age | 0.19 | 0.23 | 1.2 (0.8-1.9) | 0.42 |
| Overweightness or obesity | 0.97 | 1.02 | 2.6 (0.35-19.7) | 0.35 |
| Total cholesterol | 0.7 | 1.15 | 1.9 (0.2-19) | 0.6 |
| LDL | −0.7 | 1.2 | 0.5 (0.45-5.6) | 0.6 |
| VLDL | 3.2 | 0.8 | 25 (5-133) | <0.0001 |
| Uric acid | 0.15 | 0.87 | 1.2 (0.2-6.4) | 0.9 |
Multivariate logistic regression. Analysis adjusted for gender, age, uric acid, total cholesterol, and very-low-density lipoproteins. OR: odd ratio; CI: confidence interval; LDL: low-density lipoproteins; VLDL: very low-density lipoproteins.
The following results of the epidemiological impact measures were obtained regarding the attributable fraction for the population: about 35% for hyperglycemia, 34% for hypertriglyceridemia, 25% for decreased cHDL, and 93% for MS. The etiological fractions were 70% for hyperglycemia, 73% for hypertriglyceridemia, 67% for decreased cHDL, and 99% for MS.
The likelihood analysis results showed a high WHtR sensitivity and specificity (sensitivity = 100%, 95% CI = 89-110, specificity = 82%, 95% CI = 79.5-84.5, +LR = 5.5, −LR = 0, in men and sensitivity = 89%, 95% CI = 79.3-98.7, specificity = 77%, 95% CI = 74.6-79.4, +LR = 3.9, −LR = 0.14, in women) for the diagnosis of MS. In other MS components, WHtR has low sensitivity and specificity. AUC-ROC curves were 99% for the diagnosis of MS (p < 0.0001) in men and 84% (p = 0.001) in women (Fig. 1). The only MS components that can be diagnosed with WHtR are hypertriglyceridemia (p = 0.001) and low cHDL (p = 0.006) (Table 4). Predictive values for MS were PPV = 22% and NPV = 99%.
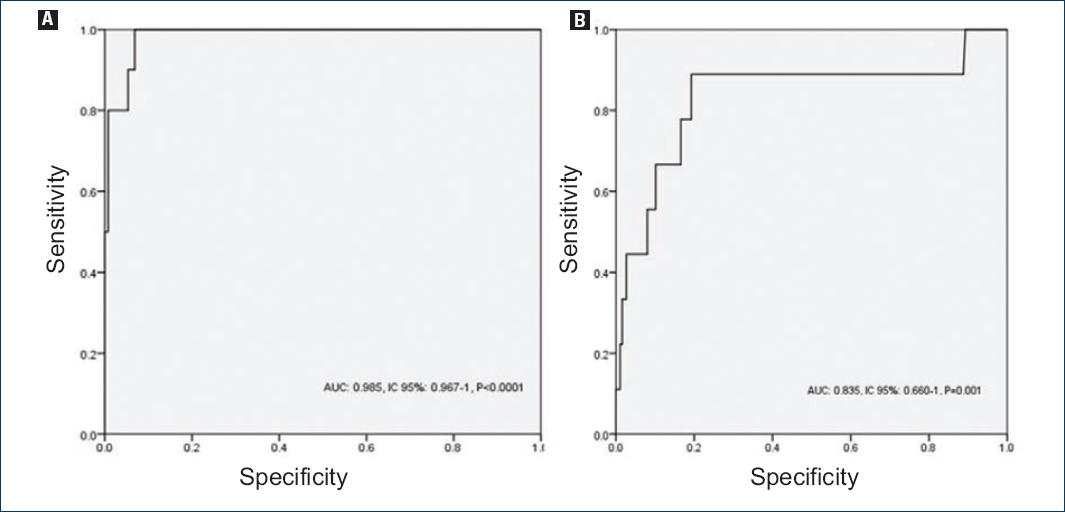
Figure 1 Receiver operating characteristic curve for the prediction of metabolic syndrome; A: in men; B: and women.
Table 4 Diagnostic efficacy of the waist-to-height ratio for metabolic syndrome and its components
| AUC | CI 95% | p value | SN | SP | J | |
|---|---|---|---|---|---|---|
| Men | ||||||
| MS | 0.985 | 0.967-1 | < 0.0001 | 1 | 0.824 | 0.824 |
| Hyperglycemia | 0.703 | 0.463-0.943 | 0.05 | 0.625 | 0.789 | 0.414 |
| Hypertriglyceridemia | 0.696 | 0.594-0.799 | 0.001 | 0.441 | 0.832 | 0.273 |
| Low cHDL | 0.665 | 0.576-0.753 | 0.001 | 0.333 | 0.926 | 0.259 |
| High SBP | 0.636 | 0.513-0.759 | 0.06 | 0.300 | 0.771 | 0.071 |
| High DBP | 0.458 | 0.266-0.650 | 0.631 | 0.250 | 0.767 | 0.017 |
| Women | ||||||
| MS | 0.835 | 0.660-1 | 0.001 | 0.889 | 0.765 | 0.654 |
| Hyperglycemia | 0.540 | 0.323-0.757 | 0.7 | 0.375 | 0.739 | 0.114 |
| Hypertriglyceridemia | 0.651 | 0.542-0.759 | 0.006 | 0.485 | 0.779 | 0.264 |
| Low cHDL | 0.613 | 0.499-0.728 | 0.03 | 0.487 | 0.790 | 0.277 |
| High SBP | 0.629 | 0.332-0.926 | 0.4 | 0.500 | 0.740 | 0.24 |
| High DBP | 0.671 | 0.490-0.851 | 0.98 | 0.556 | 0.754 | 0.31 |
AUC: area under the curve; 95% CI: 95% confidence interval; SN: sensitivity; SP: specificity; J: Youden's index; MS: metabolic syndrome; cHDL: cholesterol high-density lipoprotein; SBP: systolic blood pressure; DBP: diastolic blood pressure.
Discussion
A broad description of the guidelines and standards used for the collection of anthropometric data was necessary for the reproducibility of the study, as well as the veracity of the data, to make relevant comparisons and the association between clinical and biochemical variables with anthropometric variables.
The average age of the subjects was 18.7 and 18.5 years, in men and women, indicating that the population studied consisted of young adults. As for the analysis of anthropometric parameters, it was evidenced that all parameters are below the cutoff points. This suggests that the population did not have any alterations in their body composition or in the distribution of body fat. In a similar fashion, the descriptive results of the study show that all biochemical and clinical profile values of the study population are below the cutoff points, suggesting that this is a population of apparently healthy young adults.
The MS components were increased when there was an elevation of the WHtR; this is similar to other studies conducted in the Mexican population27. Likewise, other anthropometric parameters such as BMI, BMI adjusted for height, WC, and hip circumference are associated with some MS components28. The previous association was carried out in a fairly dispersed adult population since the age ranges were 35-89 years.
Most MS studies, whether for risk or in search of anthropometric markers, have been conducted in two major populations, children, and adults29-34. Research in young adults is very scarce.
The evidence regarding the MS risk from WHtR is similar to the results recently published by Yang et al. where they found that the risk of MS increases 5 times more when there is a high WHtR presence19. During the logistic regression analysis in our study, it was shown that WHtR is a ratio that allows predicting the risk of MS even during adjustment for gender, age, hyperuricemia, hypercholesterolemia, and very-low-density hyperlipoproteinemia. It is also worth highlighting that other disorders such as hypercholesterolemia and very-low-density hyperlipoproteinemia are clinical entities present in subjects with MS, which suggests that they can be taken into account as unconventional factors for MS.
Potential impact measures suggest that 35% of hyperglycemia, 33% of hypertriglyceridemia, 25% of high-density hypolipoproteinemia, and 94% of MS cases are attributed to WHtR > 0.53 in the general young adult population. This ratio is considered as abdominal obesity adjusted for height; therefore, if this factor was controlled, hyperglycemia could be reduced by up to 35%, 33% for hypertriglyceridemia, 25% for high-density hypolipoproteinemia, and 94% of new MS cases in the population of young adults. As for the etiologic fraction, the results suggest that 70% of hyperglycemia, 73% of hypertriglyceridemia, 67% of decreased cHDL, and 99% of MS cases in the group of subjects with WHtR > 0.53 are attributed to this anthropometric alteration. This means that up to 99% of MS cases in subjects with WHtR> 0.53 could be prevented if this anthropometric alteration was excluded from the study.
The diagnostic utility of WHtR for MS is very significant, AUC for men and women are very high, as is sensitivity and specificity. Although predictive values suggest that only 22% of patients who have WHtR> 0.53 presented MS, and 99% of subjects with WHtR < 0.53 did not present MS, making WHtR an excellent marker to rule out the presence of MS. As for the diagnostic utility of MS components, only WHtR was significant for hypertriglyceridemia and high-density hypolipoproteinemia, in men as well as in women. However, when Youden's index was calculated, the only WHtR shows significant results for MS, as its values are the closest to one, which indicates a high proportion of positive results for MS when WHtR values are altered (WHtR > 0.5)
The results obtained in other studies seem to maintain the superiority trend of WHtR compared to other anthropometric indices. In 2008, Koch et al.35 obtained the diagnostic value of WHtR for MS components, such as hypertension, dyslipidemia, and diabetes. This occurred in sick adult populations and yielded quite significant AUC values, > 0.80 regarding the probability of diagnosis of the aforementioned metabolic disorders. Rodea-Montero et al.36 analyzed different anthropometric parameters for prediction of MS and found WHtR as the best prediction index for MS (AUC = 0.74), though the population evaluated was different from ours.
Other studies were conducted in populations of young adults. The first37 was developed in young adults with intellectual disabilities (aged between 13 and 30 years). In such study, a correlation of height-adjusted WC with MS was found. Ferreira-Hermosillo et al. found evidence on the prediction of MS from WHtR (AUC = 0.71) in patients with type 1 DM38 (aged between 26 and 42 years). Another study Yang et al.19 conducted in the Asian population, whose height parameters are different from those of Caucasian origin and similar to the Latin population, demonstrated that WHtR (AUC = 0.86) is significantly more effective in diagnosing MS than BMI (AUC = 0.81) or WC (AUC = 0.85).
It is worth noting that no study was found in our country, in similar populations, on the diagnostic utility of WHtR for the diagnosis of MS. Therefore, the present study is a pioneer in this line of research and in the group of studied subjects.
The results of this study show that the WHtR is useful and accurate for the diagnosis of MS in apparently healthy young adults.

