


 nueva página del texto (beta)
 Inglés (pdf)
 Artículo en XML
 Referencias del artículo
 Enviar artículo por email
 Citado por SciELO
  Similares en
SciELO
Similares en
SciELO 
 Permalink
Introduction
Historically, ample literature has maintained the need for a structural change to revitalize productivity levels as a prerequisite for economic growth and development. Both the orthodox perspective and various heterodox approaches have promoted the practicality of directing available resources towards more efficient uses through transformations in the sectoral composition of the economy. From one point of view, neoclassical axioms defend the capacity of the market to efficiently allocate resources to different uses and understand global economic liberalization as an opportunity to relocate productive factors and inputs to more profitable uses (Bhagwati, 1988).
Grossman and Helpman (1991) specifically emphasize the relevance of innovation, the deliberate result of investment in industrial research and development, as a growth factor, and ascertain that countries specialized in high-technology activities achieve higher productivity growth rates. Lucas (1988) goes even further in this argument, suggesting that public policy measures are essential in fostering structural changes to transform the productive specialization pattern in favor of technology-intensive sectors with better expectations for the terms of international exchange.
Likewise, the structuralist approaches, such as the Economic Commission for Latin America and the Caribbean (ECLAC) point of view, underline the importance of generating spillover effects, pecuniary and technological externalities and backward and forward linkages resulting from the structural change (Cimoli, 2005A). In the tradition of structural change models with an unlimited supply of labor, such as models by Lewis (1955), Jorgenson (1961) and Fei and Ranis (1961), Furtado (1963), also related to this school of thought, professes the need to transfer workers from more backward sectors, such as agriculture, to modern sectors (read: industry), as a first step to invigorate demand. This line of argument incorporates Keynesian principles, because the increase in productivity resulting from the change in employment composition leads to wage raises that diversify consumption and in turn transform the productive structure to become more efficient.
At the level of the industrial sector, a version of these reflections is related to the proposal to scale the productive specialization pattern towards activities with higher technology content, which would imply developing new industries with the consequent transfer of workers and capital to these industries. The basis for this type of analysis is varied, but in works by Hoffmann (1958) and Chenery, Robinson and Syrquin (1986), this process consists of the displacement of light industries by heavy industries that are more technology-intensive and have higher labor productivity. The categories in articles by Chenery and Taylor (1968) and Syrquin (1988) are divided into early, middle and late industries, the latter of which are the most sophisticated and efficient. As Timmer and Szirmai (2000) summarized, this evolution is related to technological upgrading that produces a bonus for overall industrial labor productivity growth, as more advanced activities have a greater capacity to accumulate capital than traditional activities.
More recently, in the Nelson and Pack (1999) model, the aggregate increase in productivity was also driven by a structural change consisting of the expansion of the modern sector using more efficient technologies and with higher profits, as compared to traditional activities. It is worth noticing, however, that in this evolutionary perspective, the existence of a superior technology does not automatically imply that it spreads to the rest of the structure (David, 1985; Arthur, 1989). Neo-Schumpeterian principles also maintain that the introduction of a new technology paradigm (Dosi, 1982) causes leadership in productive development to shift from industries tied to older technologies towards more dynamic industries that exploit the new paradigm, which stimulates overall economic growth.
Silva and Teixeira (2011) reached a similar conclusion by demonstrating the association between successful experiences of rapid growth and structural change in 21 countries (20 OECD countries plus Taiwan) in the time period 1979-2003, calculating the Nickell and Lilien indices, based on data from the Groningen Growth and Development Center Industry Database, among other sources, for 56 branches under ISIC (International Standard Industrial Classification) Rev. 3. After estimating regressions using the panel data methodology, these authors found that countries with the fastest structural change benefited the most from a greater increase in the relative weight of human capital-intensive and innovation-intensive industries. Their results also indicated that these knowledge-based industries had a positive and significant impact on the increase in aggregate productivity, concluding that sectors associated with the production (but not consumption) of information and communication technologies are strategic for economic growth.
In the SES (Schumpeterian, evolutionary and structuralist) synthesis currently promoted by ECLAC, in the context of the growth or creation of specific new activities, innovation leads structural change, thereby giving rise to a virtuous growth cycle. From that perspective, the characteristics of knowledge intensive activities, their dynamism in international markets and the potential to increase productivity levels are the criteria to identify sectors that foster structural change (Peres and Primi, 2009). Rising employment and labor productivity are intimately tied to economic diversification, especially to the greater weight of high-technology activities in the manufacturing structure (Cimoli and Porcile, 2009). In fact, these authors measured structural change as the variation of the share of sectors involved in the "diffusion of knowledge" in the total value added of manufacturing and maintain that structural articulation, both at the micro and mesoeconomic level, is produced through the absorption of products and the improvement of productive processes with higher technology content (Cimoli, Porcile, Primi and Vergara, 2005).
In this regard, the work compiled by Cimoli (2005B) draws on various studies to relate the persistence of within and between-sector industrial structural heterogeinity, and the low articulation of export activities with the rest of the productive system, with the absence of structural change processes that would bolster technology use in Latin America. Cimoli et al. (2005) calculated the variation of the participation of various knowledge-diffusing sectors in the total aggregate manufacturing value for the period 1970-2000 in a group of 17 economies (seven in Latin America), using information from the ECLAC PADI database and the OECD Industrial Structural Analysis database. Their results indicate that the increase in this participation was hardly significant, rising from 21.2% to 28.3% for Latin American countries on average, while the coefficient fell for Argentina, Colombia, Peru and Uruguay. Broadly speaking, these authors document the absence of structural change in favor of these knowledge-diffusing sectors in the manufacturing apparatus in the region and the widening of the technology gap with respect to the United States and other emerging Asian economies, such as Korea, Malaysia, Singapore and Taiwan.
Based on a correlation matrix in which technology variables had relatively low coefficients with growth as compared to structural change, it is suggested that these variables act indirectly by transforming the productive structure. The article then cites findings from Holland and Porcile (2005), who used a shift-share technique and calculated the null contribution of structural change, referring to the transfer of employment towards more productive purposes (static effect) or increasingly productive purposes (dynamic effect) to the evolution of the industrial labor indicator in Argentina, Brazil, Chile, Colombia, Mexico and Uruguay between 1970 and 2002, looking at data for 28 sectors. In fact, in this Latin American study, the total increase in labor productivity for the unweighted average of the six countries had a negative relationship (-0.5%) with the rate of industrial employment increase, while the efficiency indicator fell due to the dynamic transfer effect, from 0.6% in the 1970s to -4.7% in the 1990s.
Along this line of thinking, Ocampo's vision (Ocampo, 2005 & 2011) seeks to integrate structuralist analysis with reflections on technological upgrading, in a balanced fashion. After indicating that various productive branches have different capacities to increase productivity, the author proposes the existence of two essential phenomena in productive development: "innovation" and "complementarities"1. The main externalities arise from their interaction. Despite maintaining the idea that an export pattern based on technology content is central, in keeping with other authors in this ECLAC school of thought, the author significantly recognizes that ‘when value chains disintegrate, the link between the technological content of export products and production activities may be broken, especially in the case of maquila. In these cases, and in export industries that use large volumes of imported inputs, the complementarities may also be very limited’ Ocampo (2011).
In this regard, the elevated participation of sectors classified as high-technology in the total added value of industry alone and without the consequent development of the necessary complementarities may not contribute to a structural change that would drive aggregate efficiency levels. Furthermore, the literature acknowledges that various branches have different capacities to increase productivity, basically due to the varying capital-labor ratios in each activity (Baumol, 1967). This implies that high-technology industries have a lower capacity to create jobs in proportion to their growth and, in the long term, the relative weight of these companies in the overall labor composition tends to be reduced, producing negative consequences, because there are no significant carry-over effects to the sectoral degrees of aggregate productivity. In this sense, Rada and von Armim (2012) point out that for the overall productive apparatus, the relative weight of the labor factor falls as compared to capital, brought on by the process of technological modernization.
Based on that idea, Peneder (2003) hypothesized that there is a "structural burden," stating that the shift of workers from dynamic sectors to others with lower growth could negatively impact productivity. In fact, Peneder (2003) looked at data from 98 manufacturing categories for 16 European countries in the time period 1985-1998 using the Eurostat New Cronos database and confirmed that at the aggregate level, the effects of structural reallocation have a lower impact on the evolution of sectoral labor productivity. The study also analyzed data from the United States, Japan and Canada and found evidence of a "structural burden," specifically by observing the expulsion of productive factors from dynamic industries with high growth in this indicator, a phenomenon robustly confirmed at a more disaggregated level for all European nations considered in the exercise, except Finland, Denmark and Great Britain.
One significant finding was that after classifying the industries into taxonomies, capital-intensive branches composed of high-technology industries, with more skilled jobs and/or jobs requiring services based on knowledge that traditionally produce stronger productivity growth, showed signs of negative structural effects. In fact, in these cases, it was confirmed that the relative weight of labor was reduced with the consequent expulsion of employment towards other activities, simultaneous to the growth of production and productivity. The article also highlighted the pronounced and systematic differences between the sectors, derived from technology gaps that have a negative impact on potential positive externalities, an aspect that Holland and Porcile (2005) pointed out as part of the phenomenon of growing within-sector heterogeneity in Latin America.
With regards to previously published literature, the main contribution of this work consists first of addressing the topic of structural change within manufacturing and on the most disaggregated level possible (four digits of the ISIC Rev. 3 classification for 150 activities) in a significant sample of countries with varying levels of development and geographic locations. Secondly, by decomposing the evolution of labor productivity with a shift-share technique that is rather more complete than those generally used in this type of study, this work contemplates the issue from the perspective of the technology content of each activity, aiming to dispute the popular sentiment that the most modern industries are capable of driving structural transformation with considerable carry-over effects for the rest of the manufacturing apparatus. In this regard, the results found in this work point in the direction of the relevance of investigating the weight of national complementarities and degrees of modernization, and systemic efficiency of the economy in determining the aggregate levels of sectoral productivity. Likewise, other germane aspects, such as the correlation between the degree of diversification, the density of the productive structure, and efficiency indicators merit an in-depth study that can only be addressed making use of more complex econometric techniques.
This work, therefore, aims first to confirm Peneder´s hypothesis in a group of 28 countries with varying levels of development and geographic locations, and then, analyze the contribution of technology-intensive industries to sectoral efficiency, dividing 150 activities into four groups based on their technology content (High (H), Medium-High (MH), Medium-Low (ML) and Low (L)), pursuant to the OECD classification (OECD, 2005).
Do higher-technology activities contribute significantly to the growth of industrial labor productivity? If they do, is this contribution associated with a structural change (understood as the shift of workers from low-productivity uses to high-productivity uses)?
After describing the theoretical principles involved in this work and reviewing the most relevant findings of prior empirical studies related to industrial structural change in various countries by way of introduction, the second section summarizes the methodologies used, as well as the source and periodicity of the data for each of the various exercises. The third section presents the data and studies the various labor productivity trends as a function of the technology content of activities in 28 countries. Finally, the fourth section reveals the results obtained from applying the shift-share technique to the contribution of the four groups of activities to the evolution of aggregate labor productivity and structural change in the sector, while the last section debates the theoretical considerations presented in the introduction.
1. Methodology and Data
For the methodology to decompose the evolution of labor productivity, we follow Roncolato and Kucera (2014) who borrowed their mathematics from prior works conducted by other authors. Aggregate labor productivity of the industrial sector was calculated by dividing total value added by the total number of employees, or q=X/L. For each of the industries i (or group of industries) that make up the sector, the indicator was then calculated as q i =x i /l i and total aggregate labor productivity as:
By taking into account first-order differences with respect to time (t=0), it turns out that the evolution of labor productivity can be expressed as:
The derivation of equation (2) is thus:
We find that:
The evolution of labor productivity can now be decomposed into an intrinsic effect in contrast with the structural effects of labor reallocation.
The intrinsic effect is the first term on the right side of equation (2), that is:
This intrinsic effect is the difference between growth in value added and the growth in employment weighted by the share of industry in the total value added for the sector. It reflects the increases in labor productivity associated with changing efficiencies within each of the activities and can be associated with the phenomenon of technological and organizational progress.
The interaction effect found here is represented by the quotient q 1 /q 0 and translates into the difference between the growth in labor productivity and the sum of the intrinsic and structural effects of labor reallocation.
Finally, the structural effect is part of the second term on the right side of equation (2), that is:
This factorial reallocation effect is the difference between the participation of value added and employment in the sectoral totals multiplied by the growth of employment in the industry in question. It reflects the contribution of the shift of workers towards industries with above-average productivity to the evolution of the aggregate labor productivity of the sector, in other words, the contribution of structural change to the behavior of the efficiency indicator.
Broadly speaking, the contribution of each industry (or group of industries) to the variation in the aggregate labor productivity of the sector is the sum of the growth of labor productivity weighted by its share in the total value added (intrinsic effect) plus the increase in employment levels weighted by relative labor productivity (structural effect). Needless to say, the effects can be negative when factors shift towards less productive activities (structural effect); or when labor productivity decreases, due to technological obsolescence or regressive transformations in the organization, within different industries (intrinsic effect).
In this article, labor productivity at the level of categories grouped by technology intensity was calculated using the sum of the values added of the various activities that make them up, divided by the sum of the number of employees in the activities, values that correspond to the four-digit activities in ISIC Rev. 3 with consistently available information. For the groups studied here, the effects and their relative contributions were determined by adding the previously calculated effects of the activities belonging to each group. Similarly, and to prevent inconsistencies, the effects for the sector total were equal to the sum of the effects of each group considered.
It is notable that, as Roncolato and Kucera (2014) wrote, ‘…the larger the difference in labor productivity among sectors, the larger the potential increases in aggregate labor productivity through reallocation effects, provided employment shifts from less to more productive sectors.’ In this sense, we could expect that a high degree of structural heterogeneity, normally associated with rather less mature productive apparatuses, would have a positive correlation, particularly in developing countries, with the processes of structural change buoyed by the growing weight of technology-intensive industries.
In terms of information sources, after reviewing available resources, the choice was made to use the Industrial Statistics Database (INDSTAT) 4 2012 database under the ISIC Revision 3 classification created by the United Nations Industrial Development Organization (UNIDO), as it is the only source that standardizes the data obtained from various national industrial surveys for a significant number of countries (135) and activities (151). However, one issue with this source is that it does not have homogeneous time series for the entire set of activities and nations, so there are many gaps and inconsistencies. To resolve this problem for the exercises in this study, countries, time periods and activities were chosen based on the ability to obtain the most complete and consistent data series without producing any specific bias.
With that said, countries with the most information available on the most disaggregated level possible were selected (four digits in the ISIC Rev. 3 classification), aiming to achieve a relatively balanced geographic distribution and levels of development. Time periods were selected in each case by looking for the years with the most number of data entries, without any specific bias, using the average of each series as a reference. The data was then deflated to 2005 United States dollars, as this is a relatively stable international economic unit. The series used was the producer price index for all manufacturing industries published by the Bureau of Labor Statistics of the United States Department of Labor (BLS, 2014).
The only activities eliminated were those with no data for the first or last year of the period or those with very inconsistent behavior over time. As such, the time periods, number of years and activities considered in the exercise vary for each country, which in turn explains the presentation of some of the results in terms of the arithmetic rates of average annual growth in real prices, aiming to prevent imbalanced comparisons between cases. It should be noted, however, that the first and last years of the exercise were chosen for similar periods (between 1994 and 1998 for the first year and between 2005 and 2009 for the last year), except for Morocco (2000-2009), due to the lack of information.
Finally, the activities were regrouped based on their technology intensity into four categories (high, medium-high, medium-low and low), following the taxonomy created by the OECD (2005).
2. Labor Productivity by Groups of Technology Intensity in Selected Countries
Before presenting the statistical information, it is necessary to offer a few additional clarifications as to the limitations of the methodology used. First, as various classic authors have pointed out (Baumol, 1967; Scherer, 1982), technology flows among different activities and investment in R+D can explain some of the evolution of aggregate sectoral productivity. Scherer (1982) asserted the relevance of R+D directed towards creating or improving products used as inputs in determining the growth of productivity in sectors that manufacture final goods. According to him: “This tendency is likely to be mirrored in the distribution of measured productivity growth as price deflators systematically underestimate the hedonic value of new products and hence undervalue the inputs used by an innovating industry´s customers” (Scherer, 1982: 627).
Second, the regrouping of the activities into four categories of technology intensity pursuant to the OECD classification (and any other existing up to the present) does not allow us to distinguish the differences in capital intensity among the tasks effectively carried out in certain locations. In all sectors, tasks are carried out with differing factorial content and as a result, have different productivity levels. In the context of marked productive specialization patterns, the most efficient activities are generally associated with transnational companies inserted in global value chains that relocate productive segments based on their factorial content, so the contribution to aggregate sectoral productivity of a single activity may differ significantly from one country to another. Likewise, we note the importance of the degree of modernization of a country's physical infrastructure as an additional explanation for the differences in efficiency detected among countries. In this way, in some cases, labor productivity may be higher in low technology intensity sectors.
In this sense, and as a final clarification, the objective of this paper is not to question the relevance of R+D and innovation processes in general in determining productivity levels of aggregate sectoral productivity, but rather, on the contrary, to challenge the contribution, per se, sustained by abundant literature, of technology-intensive activities. As demonstrated by the results presented below, it will be necessary to conduct a detailed diagnosis of the contribution of the various industries in each specific national context in connection with their levels and forms of articulation, both domestically and within global value chains. Although the methodological limitations do not permit a comprehensive approach to the topic of the role of the most "modern" industries in a potential structural change that would boost efficiency levels in the framework of developing the organization of international manufacturing, this is not considered to be a major obstacle in terms of the objectives set forth here.
Tables 1 and 2 present the participations of the four categories of activities grouped by technology intensity in the value added and total number of employees in the industrial sector for the 28 countries selected in the year 2005. The data indicate that on average, high-technology industries represent 11% of the sectoral value added, while the sum of the averages of the H and MH groups was 37%. On the country level, one initial observation is related to the apparent lack of a specific pattern for cases with a greater weight of activities of the first group in the total value added. In fact, nations where industries that are highly technology-intensive had a greater participation (Korea, Hungary and Finland), were of varied levels of development and different geographic locations.
Even so, when looking at the sum of the contributions of the first two groups (H and MH), the traditional production powerhouses are at the top of the list (Germany, 56% and Japan, 53%), which might suggest that medium-high technology activities generate both monetary benefits and benefits in terms of productive development equivalent to or even greater than high-intensity activities. In the other hand, Latvia stood out among countries with productive structures that are very concentrated on low-technology industries, as nearly 70% of the value added considered was generated by these activities, while in Ecuador, the sum of the H and MH groups represented only 8% of the total and in Iran, activities with higher technology content only represented a very low 3%.
Table 1 Participation of Groups of Activities by Technology Intensity in the Total Value Added of the Sector in Selected Countries, 2005 (Percentages)
| Country | H | MH | H+MH | ML | L | Total |
|---|---|---|---|---|---|---|
| Germany | 13.17 | 42.58 | 55.75 | 23.07 | 21.18 | 100 |
| Austria | 12.48 | 29.79 | 42.27 | 28.80 | 28.94 | 100 |
| Belgium | 14.95 | 27.89 | 42.84 | 28.14 | 29.02 | 100 |
| Korea | 24.30 | 30.44 | 54.74 | 27.07 | 18.18 | 100 |
| Denmark | 21.20 | 22.20 | 43.39 | 23.48 | 33.13 | 100 |
| Ecuador | 1.30 | 7.18 | 8.48 | 50.84 | 40.68 | 100 |
| Slovakia | 6.97 | 26.39 | 33.36 | 40.77 | 25.87 | 100 |
| Spain | 5.93 | 26.23 | 32.16 | 32.33 | 35.51 | 100 |
| United States | 21.34 | 26.74 | 48.08 | 23.33 | 28.59 | 100 |
| Finland | 23.82 | 22.96 | 46.78 | 20.28 | 32.94 | 100 |
| France | 16.70 | 28.33 | 45.03 | 25.67 | 29.30 | 100 |
| Netherlands | 7.95 | 24.03 | 31.98 | 31.30 | 36.72 | 100 |
| Hungary | 23.73 | 36.57 | 60.30 | 15.25 | 24.45 | 100 |
| India | 8.35 | 31.06 | 39.41 | 37.75 | 22.84 | 100 |
| Indonesia | 7.47 | 27.43 | 34.90 | 12.99 | 52.11 | 100 |
| Iran | 3.38 | 36.26 | 39.63 | 44.06 | 16.31 | 100 |
| Italy | 9.16 | 27.39 | 36.55 | 30.81 | 32.64 | 100 |
| Japan | 16.56 | 36.92 | 53.48 | 23.80 | 22.72 | 100 |
| Jordan | 7.62 | 16.53 | 24.14 | 37.19 | 38.67 | 100 |
| Latvia | 5.80 | 9.28 | 15.08 | 16.04 | 68.88 | 100 |
| Lebanon | 1.12 | 18.67 | 19.79 | 27.41 | 52.80 | 100 |
| Morocco | 5.90 | 18.31 | 24.20 | 26.90 | 48.90 | 100 |
| Mexico | 7.29 | 32.23 | 39.52 | 26.19 | 34.29 | 100 |
| Norway | 8.94 | 19.33 | 28.27 | 32.16 | 39.57 | 100 |
| Poland | 5.92 | 21.20 | 27.13 | 33.76 | 39.12 | 100 |
| United Kingdom | 18.84 | 23.55 | 42.38 | 22.50 | 35.12 | 100 |
| Sweden | 16.35 | 32.73 | 49.08 | 23.53 | 27.38 | 100 |
| Turkey | 3.08 | 25.98 | 29.06 | 29.98 | 40.96 | 100 |
| Simple Average | 11.41 | 26.01 | 37.42 | 28.41 | 34.17 | 100 |
| Standard deviation | 7.15 | 7.95 | 12.59 | 8.49 | 11.53 | 0.00 |
| Coefficient of variation | 62.64 | 30.57 | 33.64 | 29.89 | 33.74 | 0.00 |
Source: Prepared by the author based on UNIDO (2012) data.
Table 2 Participation of Groups of Activities by Technology Intensity in the Total Employment of the Sector in Selected Countries, 2005 (Percentages)
| Country | H | MH | H+MH | ML | L | Total |
|---|---|---|---|---|---|---|
| Germany | 10.31 | 38.45 | 48.76 | 24.24 | 27.00 | 100 |
| Austria | 9.43 | 26.71 | 36.14 | 27.54 | 36.32 | 100 |
| Belgium | 9.21 | 25.25 | 34.46 | 27.86 | 37.68 | 100 |
| Korea | 17.94 | 29.27 | 47.21 | 26.64 | 26.15 | 100 |
| Denmark | 13.14 | 25.00 | 38.14 | 24.76 | 37.11 | 100 |
| Ecuador | 2.05 | 9.67 | 11.72 | 15.91 | 72.37 | 100 |
| Slovakia | 6.68 | 29.66 | 36.34 | 27.71 | 35.95 | 100 |
| Spain | 4.72 | 22.23 | 26.95 | 31.20 | 41.85 | 100 |
| United States | 14.27 | 24.16 | 38.43 | 26.23 | 35.34 | 100 |
| Finland | 13.95 | 24.21 | 38.16 | 22.67 | 39.17 | 100 |
| France | 12.59 | 25.74 | 38.33 | 26.51 | 35.16 | 100 |
| Netherlands | 5.31 | 23.45 | 28.76 | 28.97 | 42.27 | 100 |
| Hungary | 13.49 | 26.91 | 40.40 | 18.77 | 40.83 | 100 |
| India | 5.74 | 20.59 | 26.32 | 22.91 | 50.76 | 100 |
| Indonesia | 5.51 | 10.47 | 15.99 | 13.18 | 70.84 | 100 |
| Iran | 4.37 | 29.27 | 33.64 | 33.91 | 32.45 | 100 |
| Italy | 7.35 | 25.85 | 33.20 | 29.72 | 37.07 | 100 |
| Japan | 12.19 | 31.15 | 43.35 | 23.36 | 33.29 | 100 |
| Jordan | 4.67 | 11.70 | 16.37 | 28.46 | 55.18 | 100 |
| Latvia | 3.06 | 9.46 | 12.52 | 13.50 | 73.97 | 100 |
| Lebanon | 0.98 | 11.71 | 12.69 | 29.41 | 57.90 | 100 |
| Morocco | 2.85 | 12.72 | 15.57 | 15.84 | 68.60 | 100 |
| Mexico | 5.30 | 27.18 | 32.48 | 18.63 | 48.89 | 100 |
| Norway | 6.78 | 16.97 | 23.74 | 30.16 | 46.09 | 100 |
| Poland | 5.23 | 20.34 | 25.58 | 25.70 | 48.72 | 100 |
| United Kingdom | 12.92 | 23.45 | 36.37 | 25.10 | 38.53 | 100 |
| Sweden | 8.91 | 32.57 | 41.48 | 24.16 | 34.35 | 100 |
| Turkey | 1.96 | 17.99 | 19.95 | 24.76 | 55.29 | 100 |
| Simple Average | 7.89 | 22.58 | 30.47 | 24.56 | 44.97 | 100 |
| Standard deviation | 4.50 | 7.56 | 10.91 | 5.34 | 13.58 | 0.00 |
| Coefficient of variation | 57.03 | 33.48 | 35.82 | 21.74 | 30.19 | 0.00 |
Source: Prepared by the author based on UNIDO (2012) data.
In terms of the participation of the H and MH groups in the number of sector employees, the lower capacity of these activities to create jobs with respect to their productive capacity due to a higher capital-labor ratio was confirmed, as their average weight in the structure was only 8% and 23%, respectively. Once again, Korea saw the highest contribution of the first group to employment and in Germany, the sum of H and MH accounted for nearly half of sectoral job positions. Another factor relatively unrelated to this article that may influence the behavior of the contributions of these groups to overall job creation and economic growth is the distribution of the activity income among benefits and wages and, consequently, on how rigid the labor legislation in each country is. In the Table 2 data, the role of low-technology activities in creating jobs in many developing countries which tend to be characterized by high levels of unemployment, such as Ecuador, Indonesia, Latvia and Morocco, was also worth noticing.
Table 3 presents labor productivity levels by activity group in selected countries for 2005, and the results were significant. As expected, because technology-intensive activities are more modernized and technified, they had higher labor productivity. However, the difference between the averages of the countries for the various groups was not as significant as might be believed. Specifically, the efficiency indicator for the MH group was only 3.3% higher than the figure for medium-low industries.
It was also corroborated that cases with the highest labor productivity in the group H were in turn those with the highest levels of total aggregate productivity (United States, Japan, Korea and Belgium, with the exception of Finland). In parallel fashion, nations with the lowest total aggregate indicators (India, Indonesia, Latvia, Slovakia, Morocco and Jordan) had the lowest levels of this indicator in nearly all groups defined, which underlines the importance of how modern the physical infrastructure is and the existence of complementarities in determining the efficiency of the various activities, especially, in the overall productive sector.
Table 3.Labor Productivity by Groups of Technology Intensity in Selected Countries, 2005 (Current US Dollars)
| Country | H | MH | H+MH | ML | L | Total |
|---|---|---|---|---|---|---|
| Germany | 94,724 | 82,179 | 84,833 | 70,627 | 58,189 | 74,195 |
| Austria | 112,317 | 94,631 | 99,245 | 88,746 | 67,614 | 84,865 |
| Belgium | 167,738 | 114,103 | 128,434 | 104,329 | 79,571 | 103,307 |
| Korea | 155,796 | 119,538 | 133,313 | 116,836 | 79,959 | 114,972 |
| Denmark | 127,664 | 70,249 | 90,025 | 75,039 | 70,631 | 79,118 |
| Ecuador | 19,853 | 23,228 | 22,638 | 100,024 | 17,592 | 31,295 |
| Slovakia | 13,245 | 11,300 | 11,658 | 18,684 | 9,136 | 12,698 |
| Spain | 74,341 | 69,745 | 70,549 | 61,238 | 50,152 | 59,107 |
| United States | 250,175 | 185,252 | 209,364 | 148,880 | 135,424 | 167,372 |
| Finland | 157,271 | 87,360 | 112,917 | 82,407 | 77,461 | 92,113 |
| France | 96,112 | 79,737 | 85,114 | 70,158 | 60,360 | 72,445 |
| Netherlands | 125,767 | 85,965 | 93,310 | 90,633 | 72,866 | 83,892 |
| Hungary | 44,140 | 34,089 | 37,445 | 20,383 | 15,018 | 25,085 |
| India | 13,444 | 13,952 | 13,841 | 15,233 | 4,161 | 9,246 |
| Indonesia | 12,910 | 24,945 | 20,796 | 9,392 | 7,008 | 9,527 |
| Iran | 17,089 | 27,430 | 26,086 | 28,766 | 11,126 | 22,141 |
| Italy | 84,227 | 71,637 | 74,425 | 70,088 | 59,538 | 67,617 |
| Japan | 168,815 | 147,283 | 153,341 | 126,611 | 84,819 | 124,283 |
| Jordan | 24,814 | 21,510 | 22,453 | 19,891 | 10,667 | 15,221 |
| Latvia | 20,480 | 10,600 | 13,015 | 12,845 | 10,068 | 10,812 |
| Lebanon | 29,599 | 41,031 | 40,152 | 23,994 | 23,469 | 25,740 |
| Morocco | 27,806 | 19,372 | 20,918 | 22,858 | 9,593 | 13,457 |
| Mexico | 89,673 | 77,208 | 79,241 | 91,549 | 45,682 | 65,127 |
| Norway | 127,938 | 110,468 | 115,453 | 103,381 | 83,231 | 96,959 |
| Poland | 29,309 | 26,978 | 27,455 | 33,997 | 20,779 | 25,883 |
| United Kingdom | 115,781 | 79,760 | 92,558 | 71,185 | 72,403 | 79,427 |
| Sweden | 152,240 | 83,379 | 98,175 | 80,812 | 66,142 | 82,975 |
| Turkey | 29,343 | 27,019 | 27,248 | 22,652 | 13,857 | 18,706 |
| Simple Average | 85,093 | 65,712 | 71,571 | 63,616 | 47,018 | 59,557 |
| Standard deviation | 63,712 | 44,472 | 50,163 | 39,634 | 34,015 | 41,865 |
| Coefficient of variation | 75 | 68 | 70 | 62 | 72 | 70 |
Source: Prepared by the author based on UNIDO (2012) data.
As such, another relevant observation was the apparent positive correlation between sectoral levels of aggregate productivity and the weight of technology-intensive industries in the structure. In fact, countries with a higher overall labor indicator (United States, Japan and Korea) only partially match cases with a higher share of high-technology activities (Korea, Hungary and Finland), as well as those with the highest weight of the sum of the H and MH groups in the structure (Germany, Korea and Japan). In this regard, Figures 1 and 2 show these associations, respectively, for the 28 countries analyzed. This first approximation confirms, although hardly in a robust fashion, what the previously reviewed literature indicates, that is, a positive correlation between the labor efficiency indicator and the weight of technology-intensive industries in the industrial structure, especially when considering only the group of high-technology activities (Figure 1).
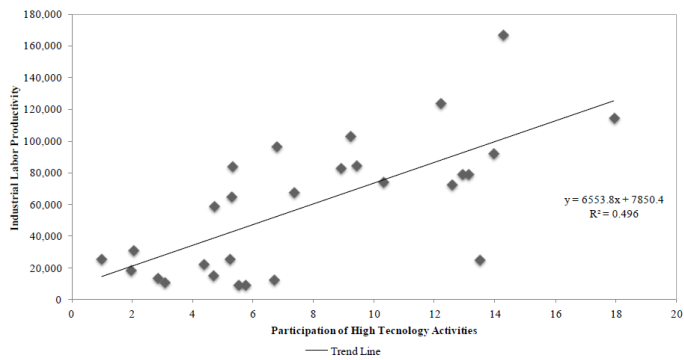
Source: Prepared by the author based on UNIDO (2012) data.
Figure 1 Industrial Labor Productivity and the Participation of High Technology Activities in the Structure of the Sector, 2005 (Current US Dollars and Percentages)
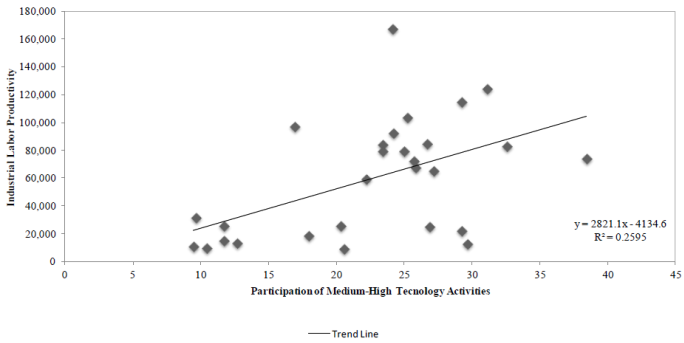
Source: Prepared by the author based on UNIDO (2012) data.
Figure 2 Industrial Labor Productivity and the Participation of High and Medium-High Technology Activities in the Structure of the Sector, 2005 (Current US Dollars and Percentages)
Table 4 displays the annual average growth rates of labor productivity in real terms by groups of technology intensity for the countries selected. Once again, the H group is the most dynamic, with an average increase of 7.1%. However, the ML group had a rate (6.3%) higher than the two other groups (MH (5.4%) and L (4%)). At first glance, it appears there is no correlation between the dynamism of the indicator and the technology content of the activities in this case. It is also notable that the cases with the strongest increases in aggregate labor productivity were all developing countries with high growth rate indicators in the set of groups (Indonesia, Slovakia, Hungary, Latvia and India). This is once again evidence for the systemic nature of the behavior of labor productivity in the industrial sector on the global level, as well as the greater potential for capital accumulation in developing countries.
Table 4 Real Annual Average Growth Rates of Industrial Labor Productivity by Groups of Technology Intensity in Selected Countries (Percentages)
| Country | H | MH | H+MH | ML | L | Total |
|---|---|---|---|---|---|---|
| Germany | 3.68 | 3.03 | 3.19 | 1.91 | -0.14 | 2.08 |
| Austria | 0.49 | 2.33 | 1.81 | 0.51 | 0.37 | 1.14 |
| Belgium | 6.19 | 2.11 | 3.45 | 2.94 | 2.73 | 3.17 |
| Korea | 7.12 | 6.50 | 6.91 | 3.79 | 4.90 | 6.26 |
| Denmark | 4.24 | 3.30 | 3.71 | 3.07 | 2.57 | 3.42 |
| Ecuador | 15.90 | 2.14 | 3.95 | 7.69 | 8.70 | 7.35 |
| Slovakia | 21.11 | 15.07 | 16.10 | 15.51 | 11.74 | 15.08 |
| Spain | 1.91 | 3.34 | 3.06 | 4.67 | 4.81 | 4.32 |
| United States | 3.36 | 1.93 | 2.50 | 3.79 | 2.63 | 2.83 |
| Finland | 11.47 | 1.33 | 5.10 | 1.95 | -0.88 | 1.91 |
| France | 2.96 | 2.42 | 2.61 | 2.81 | 3.70 | 3.09 |
| Netherlands | -2.18 | 1.69 | 0.81 | -0.52 | -0.76 | -0.21 |
| Hungary | 7.29 | 14.97 | 12.15 | 10.82 | 13.26 | 14.17 |
| India | 7.58 | 7.92 | 7.84 | 20.67 | 5.58 | 11.41 |
| Indonesia | 17.88 | 24.42 | 23.21 | 25.95 | 19.67 | 22.41 |
| Iran | 0.42 | 0.98 | 1.01 | 4.20 | -0.80 | 2.72 |
| Italy | 2.08 | 1.22 | 1.42 | 1.04 | 1.24 | 1.30 |
| Japan | 2.33 | 0.89 | 1.29 | 0.25 | -0.62 | 0.70 |
| Jordan | 13.16 | 8.02 | 9.53 | 7.32 | 5.31 | 6.36 |
| Latvia | 39.65 | 23.17 | 27.36 | 24.54 | 8.27 | 12.60 |
| Lebanon | -3.03 | -0.77 | -0.87 | -2.14 | -0.11 | -0.36 |
| Morocco | 11.47 | -1.51 | 0.45 | 9.85 | 4.28 | 5.20 |
| Mexico | 4.63 | 4.48 | 4.51 | 9.01 | 3.63 | 5.15 |
| Norway | 4.74 | 5.19 | 5.13 | 4.97 | 3.67 | 4.54 |
| Poland | 7.29 | 12.83 | 11.52 | 9.06 | 6.96 | 9.00 |
| United Kingdom | 5.12 | 3.58 | 4.33 | 4.35 | 3.94 | 4.21 |
| Sweden | 5.83 | 2.05 | 3.16 | 1.48 | 1.00 | 2.15 |
| Turkey | -3.91 | -2.42 | -2.64 | -1.92 | -3.06 | -2.48 |
| Simple Average | 7.10 | 5.36 | 5.81 | 6.34 | 4.02 | 5.34 |
| Standard deviation | 8.75 | 6.80 | 6.87 | 7.37 | 4.93 | 5.50 |
| Coefficient of variation | 123.24 | 126.75 | 118.28 | 116.16 | 122.64 | 102.92 |
Source: Prepared by the author based on UNIDO (2012) data.
3. Results: Structural Change and Technology Intensity
This section summarizes the results obtained from applying the methodology to decompose the evolution of labor productivity (total effect) into two components: an intrinsic effect associated with technological and organizational changes within each activity or activity group, and a structural change, understood as the contribution of the shift of workers between industries with different levels of efficiency (see methodology section). Table 5 presents the contribution in percentage terms of the four groups of activities to the evolution of total aggregate productivity in industrial labor for the 28 countries.
Table 5. Contribution to the Evolution of Industrial Labor Productivity by Groups of Technology Intensity in Selected Countries (Percentages)
| Country | H | MH | H+MH | ML | L | Total |
|---|---|---|---|---|---|---|
| Germany | 22.61 | 65.99 | 88.60 | 19.88 | -8.49 | 100 |
| Austria | 3.81 | 59.98 | 63.80 | 12.75 | 23.45 | 100 |
| Belgium | 22.71 | 19.91 | 42.62 | 25.40 | 31.98 | 100 |
| Korea | 22.47 | 28.47 | 50.94 | 16.38 | 32.68 | 100 |
| Denmark | 19.37 | 21.49 | 40.86 | 20.25 | 38.89 | 100 |
| Ecuador | 3.80 | -1.62 | 2.18 | 73.80 | 24.02 | 100 |
| Slovakia | 11.14 | 18.54 | 29.68 | 35.20 | 35.12 | 100 |
| Spain | 3.56 | 23.02 | 26.58 | 31.10 | 42.32 | 100 |
| United States | 18.28 | 17.23 | 35.50 | 29.15 | 35.35 | 100 |
| Finland | 91.41 | 14.51 | 105.92 | 7.24 | -13.16 | 100 |
| France | 14.06 | 21.58 | 35.65 | 22.03 | 42.33 | 100 |
| Netherlands | 68.20 | -180.78 | -112.58 | 69.62 | 142.96 | 100 |
| Hungary | 12.52 | 37.95 | 50.47 | 11.00 | 38.53 | 100 |
| India | 6.72 | 26.21 | 32.94 | 66.38 | 0.68 | 100 |
| Indonesia | 5.73 | 31.76 | 37.50 | 13.94 | 48.56 | 100 |
| Iran | -1.03 | 31.28 | 30.25 | 77.19 | -7.44 | 100 |
| Italy | 13.73 | 26.54 | 40.27 | 22.69 | 37.04 | 100 |
| Japan | 32.48 | 32.74 | 65.22 | 9.42 | 25.36 | 100 |
| Jordan | 22.94 | 29.61 | 52.54 | 59.17 | -11.71 | 100 |
| Latvia | 12.08 | 20.24 | 32.33 | 20.42 | 47.26 | 100 |
| Lebanon | 12.44 | -99.83 | -87.39 | 190.16 | -2.78 | 100 |
| Morocco | 9.85 | -5.15 | 4.70 | 43.25 | 52.04 | 100 |
| Mexico | 5.95 | 27.33 | 33.28 | 35.44 | 31.28 | 100 |
| Norway | 8.31 | 20.10 | 28.41 | 32.39 | 39.20 | 100 |
| Poland | 5.38 | 30.51 | 35.88 | 31.34 | 32.78 | 100 |
| United Kingdom | 16.59 | 21.11 | 37.69 | 26.42 | 35.88 | 100 |
| Sweden | 45.40 | 29.02 | 74.42 | 11.38 | 14.20 | 100 |
| Turkey | 4.78 | -4.73 | 0.05 | -11.66 | 111.60 | 100 |
| Simple Average | 18.40 | 12.96 | 31.37 | 35.78 | 32.86 | 100 |
Source: Prepared by the author based on UNIDO (2012) data.
The data overwhelmingly reveal that groups with low technology-intensive activities (ML and L) had a higher contribution to the sectoral efficiency indicator, as the average contribution of the ML group (35.8%) and the L group (32.9%) was much higher than the contribution of the H (18.4%) and MH (13%) groups. In fact, in both developing countries with the highest rates of increasing aggregate labor productivity, with the exception of Hungary, (Indonesia, Slovakia, Latvia and India), as well as in the United States, a nation whose indicator was the highest in the sample, the contribution of low technology-intensive groups was higher than that of high and medium-high groups. The few cases in which the contribution of the H and MH groups was higher than that of the ML and L groups were generally characterized by high levels of productive development. However, this group is still rather heterogeneous, including countries such as Hungary and Jordan.
We are now able to answer the first of the questions proposed in the introduction; technology-intensive activities do not significantly contribute to the increase in the aggregate labor productivity of the sector. Broadly speaking, contrary to what the majority of works reviewed claim (Timmer and Szirmai, 2000; Silva and Teixeira, 2011), this result does not question the greater capacity of technology-intensive industries to accumulate capital and achieve higher levels of efficiency, but rather the degree of their contribution based on their theoretical importance to the aggregate industrial performance. This finding can be explained by the reduced weight of modern activities in the structure, both in terms of value added (Cimoli et al., 2005) and employment (Rada and von Armim, 2012), but as the result is verified although to varying degrees for countries with different levels of development. The hypothesis to prove in terms of the principal determinant of this result would then seem to be the scarce and unequal development of existing complementarities (Ocampo, 2011).
On this order of ideas, Table 6 shows the contribution in percentage terms of the intrinsic, structural and interaction effects to the evolution of the labor productivity of the sector. Negative data means that the labor indicator fell in the period indicated as a result of the aforementioned concepts. Similarly, because the sum of the three effects adds up to 100%, data above this amount implies a contribution of more than the entire increase in aggregate labor productivity whose value exceeds 100%, logically compensated by the negative contribution of the sum of the remaining two effects. Once again, the results were rather conclusive. On average, the structural and interaction effects were negative, while the intrinsic component explained more than the entirety of the increase observed in the efficiency indicator (114.5%).
Table 6. Determinants of the Evolution of Industrial Labor Productivity in Selected Countries (Percentages)
| Country | Intrinsic Effect | Structural Effect | Interaction Effect | Total |
|---|---|---|---|---|
| Germany | 125.22 | -12.79 | -12.43 | 100 |
| Austria | 86.77 | 13.63 | -0.39 | 100 |
| Belgium | 83.90 | 7.60 | 8.50 | 100 |
| Korea | 91.31 | 6.20 | 2.49 | 100 |
| Denmark | 77.16 | 11.05 | 11.80 | 100 |
| Ecuador | 129.54 | 18.48 | -48.02 | 100 |
| Slovakia | 109.62 | -1.38 | -8.24 | 100 |
| Spain | 103.49 | 3.36 | -6.85 | 100 |
| United States | 76.07 | 3.83 | 20.09 | 100 |
| Finland | 119.03 | -12.23 | -6.80 | 100 |
| France | 79.31 | 2.84 | 17.85 | 100 |
| Netherlands | 105.71 | -9.32 | 3.61 | 100 |
| Hungary | 92.50 | 9.90 | -2.39 | 100 |
| India | 126.87 | 0.51 | -27.38 | 100 |
| Indonesia | 106.26 | 6.38 | -12.64 | 100 |
| Iran | 84.45 | 52.23 | -36.68 | 100 |
| Italy | 90.83 | 5.87 | 3.29 | 100 |
| Japan | 54.25 | 26.51 | 19.24 | 100 |
| Jordan | 254.46 | -48.34 | -106.12 | 100 |
| Latvia | 107.03 | 1.19 | -8.22 | 100 |
| Lebanon | 347.76 | -248.16 | 0.40 | 100 |
| Morocco | 107.84 | -5.81 | -2.02 | 100 |
| Mexico | 90.51 | 0.52 | 8.97 | 100 |
| Norway | 91.10 | 2.72 | 6.18 | 100 |
| Poland | 108.59 | -5.70 | -2.89 | 100 |
| United Kingdom | 68.81 | 4.72 | 26.48 | 100 |
| Sweden | 120.33 | -3.03 | -17.31 | 100 |
| Turkey | 167.01 | 109.09 | -176.10 | 100 |
| Simple Average | 114.49 | -2.15 | -12.34 | 100 |
Source: Prepared by the author based on UNIDO (2012) data.
In general terms, structural change, defined as the shift of workers between various activities, not only does not contribute to the increase of the indicator but also has a moderately negative impact on the behavior of aggregate labor productivity. Upon examining the data, we find that in nine cases the structural effect was negative, while it was only positive and greater than 10% in six countries with extremely diverse levels of development (Denmark, Austria, Ecuador, Japan, Iran and Turkey). Lebanon (-248.2%) and Jordan (-48.3%) were also notable cases, where the sectoral recomposition of employment significantly hurt industrial performance. The above results therefore bring us to one of this work’s objectives, by corroborating what other studies have concluded regarding the insignificant contribution of structural change to industrial efficiency on the global level (Timmer and Szirmai, 2000; Peneder, 2003; Holland and Porcile, 2005).
Table 7 expresses, in percentages, the contribution of the structural effect to the evolution of the labor productivity of the sector by activity group. The data confirm the low contribution of the worker shift to the performance of the aggregate indicator in all countries and for all groups. In only four cases did any of the groups have a share of more than 15% of the increase of the labor productivity of the sector due to this effect: Holland, where medium-high and medium-low technology activities contributed 24.8% and 17.6%, respectively, to aggregate evolution, Iran, where MH contributed 37%, and Japan and Turkey, where the L group participated with 45.2% and 100.4%, respectively. On average, no group of activities had a structural effect that represented more than 1% of the increase in the labor efficiency indicator, although the figure was on average positive for the H and MH groups and negative for the L and ML groups. What held true in both cases was that neither of the values was significant.
Table 7 Contribution of the Structural Effect to the Evolution of Industrial Labor Productivity by Groups of Technology Intensity in Selected Countries (Percentages)
| Country | H | MH | H+MH | ML | L | Total |
|---|---|---|---|---|---|---|
| Germany | -0.75 | -0.71 | -1.46 | -4.23 | -7.10 | -13 |
| Austria | -2.38 | 4.70 | 2.32 | -0.71 | 12.02 | 14 |
| Belgium | 3.06 | -0.65 | 2.42 | -0.17 | 5.36 | 8 |
| Korea | 4.75 | -2.47 | 2.28 | -1.73 | 5.65 | 6 |
| Denmark | 6.15 | 0.17 | 6.33 | -0.34 | 5.06 | 11 |
| Ecuador | -0.06 | 10.88 | 10.82 | 9.45 | -1.79 | 18 |
| Slovakia | -0.58 | -0.78 | -1.35 | -0.66 | 0.64 | -1 |
| Spain | -0.20 | 0.27 | 0.07 | -2.24 | 5.53 | 3 |
| United States | -4.35 | -2.77 | -7.12 | 1.98 | 8.97 | 4 |
| Finland | 7.91 | 1.40 | 9.31 | -8.59 | -12.94 | -12 |
| France | -0.72 | -1.71 | -2.43 | -0.65 | 5.93 | 3 |
| Netherlands | -11.93 | 24.77 | 12.84 | 17.63 | -39.79 | -9 |
| Hungary | 4.36 | 2.16 | 6.53 | -0.92 | 4.30 | 10 |
| India | 1.25 | 0.93 | 2.18 | 1.35 | -3.02 | 1 |
| Indonesia | 0.07 | 5.04 | 5.11 | -0.23 | 1.50 | 6 |
| Iran | 1.93 | 37.02 | 38.96 | 2.69 | 10.59 | 52 |
| Italy | -0.26 | -2.41 | -2.68 | -3.38 | 11.93 | 6 |
| Japan | -0.40 | -13.95 | -14.35 | -4.33 | 45.19 | 27 |
| Jordan | 1.73 | -0.54 | 1.19 | -17.21 | -32.32 | -48 |
| Latvia | 1.44 | 1.05 | 2.49 | 0.34 | -1.64 | 1 |
| Lebanon | -0.07 | -60.02 | -60.08 | -29.31 | -158.78 | -248 |
| Morocco | 2.71 | -3.36 | -0.65 | -3.24 | -1.93 | -6 |
| Mexico | 0.21 | -1.45 | -1.24 | -0.74 | 2.50 | 1 |
| Norway | 0.29 | 1.32 | 1.61 | -0.57 | 1.69 | 3 |
| Poland | 0.35 | -0.29 | 0.06 | -2.86 | -2.91 | -6 |
| United Kingdom | -1.33 | -0.23 | -1.57 | 0.44 | 5.85 | 5 |
| Sweden | 5.10 | -0.24 | 4.87 | -5.02 | -2.88 | -3 |
| Turkey | 2.99 | 4.26 | 7.24 | 1.43 | 100.41 | 109 |
| Simple Average | 0.76 | 0.09 | 0.85 | -1.85 | -1.14 | -2 |
Source: Prepared by the author based on UNIDO (2012) data.
In that sense, because there was no structural change that drove labor productivity in industry, in general terms, it could be said that the aforementioned low contribution of technology-intensive activities to the behavior of the aggregate indicator is neither associated with nor transmitted through a structural transformation that bolsters efficiency levels, regardless of the degree of productive development and the weight of the H and MH groups in the sector. As such, even though in countries with a greater share of high technology-intensive activities (Korea, Hungary and Finland) the contribution of the structural effect associated with these activities is slightly higher (although still not significant), in traditional production powerhouses with a considerable weight for the first two groups (H and MH) (Germany, Japan and the United States), the structural effect associated with these groups is even negative.
In summary, a greater share of technology-intensive activities in the industrial structure does not seem to be associated with either significant sectoral gains in labor productivity or with the shift of the labor factor towards more efficient uses. These results contradict findings by Cimoli and Porcile (2009) and Silva and Teixeira (2011) in terms of the positive and significant impact of modern industries on the increase of employment and aggregate labor productivity through a process of structural change. However, by contrast, they seem to confirm what Peneder (2003) found regarding the negative structural effects in his study (insignificant in ours) of capital-intensive branches composed of high-technology industries, with highly skilled jobs and/or requiring knowledge-based services.
It remains then to define whether, in line with Cimoli et al. (2005), the low contribution of H and MH activities to aggregate labor productivity is explained by the absence of structural change, because technological variables act indirectly through transformations to the productive structure, or whether, on the contrary, what we observed can be explained by the very incapacity of these capital-intensive industries, when they grow, to generate the externalities necessary for this transformation. As mentioned already, this paper defends a hypothesis that maintains that the simultaneous development of complementarities is essential to drive the carry-over effects necessary to achieve an authentic process of structural change.
Conclusions
A variety of theoretical perspectives have defended the relevance of structural change that allocates manufacturing factors to higher productivity uses in an environment of growing productive specialization. This intuitively correct argument has been transferred to the industrial realm, specifically pointing to the example of the success of emerging Southeast Asian economies. However, the few works dedicated to analyzing structural change within industry have found, despite their multiple methodological limitations, scarce evidence of the significant contribution of the shift of productive factors to the increase in aggregate sectoral productivity in the current context of economic globalization.
Likewise, the literature, in addition to indicating that high-technology activities have higher levels of efficiency, has generally maintained the suitability of industrial upgrading towards a specialization pattern concentrated on capital-intensive activities. The strategic role of modern sectors in promoting structural change has thus been supported, arguing, among other things, that the articulated transformation of the manufacturing apparatus occurs automatically through the absorption of products and improved processes with higher technological content (Cimoli et al., 2005). As a result, various theoretical approaches have pushed for State support of high-technology sectors inserted in global chains and usually dedicated to exporting products.
However, few studies have consistently proved these assumptions. In this regard, the findings of this paper, which used an accounting technique to decompose the evolution of labor productivity, indicate that higher-technology activities do not contribute significantly to aggregate industrial labor productivity, regardless of the level of economic and productive development of the countries analyzed. In fact, the results overwhelmingly demonstrate that groups that are less technology-intensive had, on average, a higher contribution to the increase in the sectoral efficiency indicator.
The exercises conducted here also corroborate, at a high level of disaggregation and with a sufficient number of cases, the absence of a structural change in industry that would drive levels of aggregate sectoral labor productivity. Consequently, there does not seem to be an association between the degree of participation of high-technology activities in the structure and the performance of the aggregate efficiency indicator or the potential shift of workers towards more profitable uses. This could be explained by the low capacity of capital-intensive activities to create jobs and generate the externalities and carry-over effects necessary for structural transformation. Another explanation may be related to what some authors have accepted as the challenges in disseminating innovations made at the core of industry to the rest of the manufacturing apparatus (David, 1985; Arthur, 1989).
Even so, a comprehensive view of productive development would have to emphasize the advance of national complementarities, considering a global context in which value chains are built and led by major transnational companies based on the phenomena of international segmentation and the dislocation of the various manufacturing activities. These global orders could, in and of themselves, explain the recent lack of development of the national complementarities necessary to produce carry-over effects and the other pecuniary externalities inherent to substantial structural change that would boost aggregate labor productivity. In summary, as Ocampo (2011) ascertained, there is currently a detachment between the technology content of products (especially export products) and the activities carried out by the various countries, where maquila processes are the extreme, as regardless of the technology intensity of the product, the tasks performed are strictly assembly and are of low domestic added value.
A worldwide context in which the governance of global value chains determines the national features of specialization based on tasks and not on activities with diverse technology content could then explain why developing countries, which have a greater capacity to accumulate capital, have higher labor productivity growth rates, but without a significant contribution of the structural component, as we might expect, according to Roncolato and Kucera (2014). In this regard, the results of this work start to provide a more comprehensive overview of what determines aggregate efficiency levels, that is, the role of the degree of modernization and systemic efficiency of the economy; an idea that should be taken into account to avoid drafting public policy measures that support highly technological industries divorced from the rest of the manufacturing structure.
With that said, some aspects of the theoretical reflections that have received less attention are still worthy of notice. For example, Cimoli and Porcile (2009) maintain that structural transformation and the consequent increase of aggregate labor productivity led by highly technological industries go hand in hand with productive diversification. In that sense, and in opposition to the current orthodox trend towards over-specialization, the density of the manufacturing apparatus is especially important, not only in the development of productive complementarities. Because all activities, regardless of their intrinsic characteristics, tend to play a rather significant systemic role, one final reflection is therefore linked to the criteria to analyze and determine relevant public policy, keeping in mind that the ultimate objective of productive development should be to promote the welfare of populations.

