


 nueva página del texto (beta)
 Inglés (pdf)
 Artículo en XML
 Referencias del artículo
 Enviar artículo por email
 Citado por SciELO
  Similares en
SciELO
Similares en
SciELO 
 Permalink
Study contribution
The estrus detection rate is a relevant variable in dairy farms since it affects the pregnancy rate and all reproductive efficiency. The farms spend and invest to increase the EED, ranging from increased labor to installing expensive precision farming systems. For these measures to be cost efficient, it is necessary to know the economic benefits derived from the improvement in estrus detection. In this work, based on the Monte Carlo simulation model, it was determined the economic benefit derived from an increase of one point in the estrus detection rate has a quadratic behavior in the interval that goes from 15 to 30 % and that this ranges from USD 40.46 to USD 6.88. These values provide a guide to compare the cost of measures implemented to increase the EED, so that they are profitable.
Introduction
The reproductive efficiency of dairy herds significantly influences the profitability of dairy farms.1,2 The pregnancy rate (PR) reveals the proportion of pregnant cows out of the total eligible to be inseminated during a period equivalent to an estrous cycle (21 days). The PR estimate is made by multiplying the proportion of cows inseminated out of the total expected to be inseminated in a period of 21 days by the proportion of cows that remain pregnant (conception rate). This reproductive parameter is comprehensive as it shows the efficiency of estrus detection (EED) and the proportion of cows that remain pregnant out of the total inseminated.3,4) The PR rate of dairy herds in Mexico ranges from 12 to 15 %,5 which is similar to that observed in the USA.1,4
It is difficult to improve PR through strategies aimed at increasing conception rate (CR) as these strategies do not provide consistent results.6-8) Hence, the most effective alternative for improving PR is through improving heat detection and thus, increasing the number of inseminated cows (submission rate).3,9) For this purpose, the farmer has different resources, such as estrus synchronization, estrus synchronization and fix-timed insemination (FTI) and assistance to increase the EED, such as mount detector patches, telemetry and pedometers. Deciding which technology will be used depends on their effectiveness and costs.10,11
Mathematical analysis tools, such as simulation models, are widely used in livestock production settings since they produce relevant information to support decision-making in the farm.12 These models can be deterministic and probabilistic, depending on the variable under study and the target model. Methods for simulation processes are diverse; however, Monte Carlo is considered the most efficient for estimating real system parameters.12 The Monte Carlo simulation consists of a mathematical representation of the model under study. For that purpose, it is a pre-requisite to identify the variables that determine the model’s overall performance, as well as to establish their relationships and the consequences of their interactions. In this way, different scenarios are computer-generated, which have defined repetition numbers that modified the values of selected variables. After performing the repetitions, behavior system observations are obtained. These simulated observations are useful for understanding system operation in a real context, without investing or taking any risk involved in experimentation. The higher the number of repetitions, the higher the accuracy of the analysis.13,14
The Monte Carlo methodology has been used for different purposes in animal production, such as quantifying the economic losses associated with livestock diseases and the benefits of control programs.15 Moreover, it has helped assess the feasibility of alternative production systems,16 the effect of variations in critical variables on dairy farm profitability,17 the equilibrium point for a robotic milking system;18 and the economic evaluation of different livestock diets,19 among others.
Several studies have used the Montecarlo and other similar methodologies to assess the economic impact of different reproductive management programs of dairy cows.4,10,20 However, no studies have been conducted under Mexico’s conditions. While intensive milk production systems in North America are similar and use the same inputs, the costs are different. For that reason, the main goal of this study was to determine the economic impact of changes in pregnancy rates in dairy cows under intensive management, using a simulation model generated through the Monte Carlo methodology.
Materials and methods
A simulation model was developed through the Monte Carlo method (MOSEPLE), using an electronic spreadsheet that simulates the behavior of a dairy herd and estimates the usefulness of different pregnancy rates with a 30 % of fixed conception rate and modifying the efficiency of estrus detection. To feed this model, we used the processed record information of a dairy farm, which had 966 Holstein cows on the central plateau of Mexico.
For the study 2 532 lactation records were obtained and classified as follows: 966 from the first lactation (38 %), 835 from the second lactation (33 %), 464 from the third lactation (18 %), 209 from the fourth lactation (8 %), and 58 from the ≥fifth lactation (2 %). From these records, a stratified sampling was conducted, where the stratum (n= 5) corresponded to the birth number. The following equation was used:
Where:
n: |
number of elements in the sample. |
N: |
population (2 532) |
Z: |
95 % confidence level (1.96) |
p: |
expected proportion (0.5) |
q: |
1-p |
d: |
accuracy (0.05) |
Based on the above equation, we obtained a sample of 334 lactation periods divided by birth number. Samples were selected randomly using the random number function of Microsoft Excel ©.
Simulation model design
To design the simulation model, we first established the different outstanding events that occur during the productive life of a dairy cow. Moreover, we included the reproductive and productive management of the analyzed company, as well as their occurrence probabilities (Figure 1).
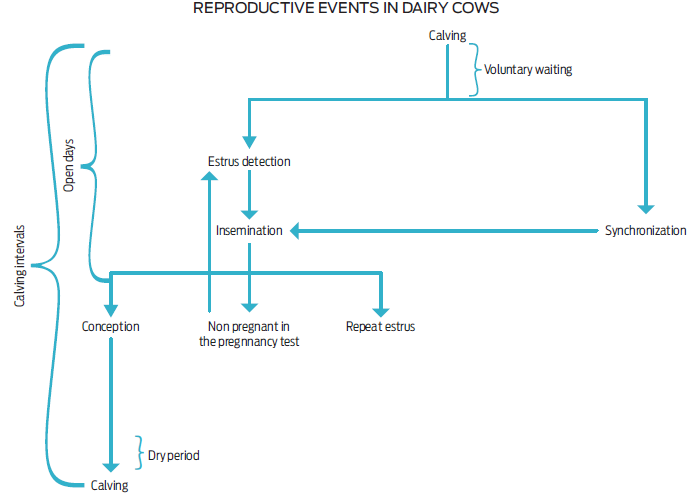
Figure 1 Different reproductive events that occur during the productive life of a cow starting from calving.
The reproductive, productive and economic variables considered for developing the model are shown in Table 1.
Table 1 Variables included in the model
| Reproduction | Production | Economics |
| Voluntary waiting (days) | Lactation length (days) | Feed costs |
| Estrus detection (probability) | Lactation number | Reproductive costs |
| Conception (probability) | Total milk production (kg/lactation) | Cow amortization |
| Non-pregnant in the pregnancy test (probability) | Number of born male calves | Other costs |
| Synchronization (binary variable) | Number of born female calves | Total costs |
| Open days (days) | Offspring sales revenue | |
| Gestation (days) | Selling milk incomes | |
| Calving intervals (days) | Total incomes | |
| Dry period (days) | Partial utility | |
| Services per conception (number) | Adjusted utility | |
| Abortions (probability) Insemination (binary variable) |
Once the variables were identified, we proceeded to obtain the reproductive, productive and financial records of the dairy farm. To achieve this goal, we reviewed databases and removed inconsistent or incomplete data. The information was processed to obtain the necessary parameters that fed the simulation model. Although some variables are presented as percentages, they were introduced as probabilities. Data on reproductive performance traits are shown in Table 2.
Table 2 Means and standard deviations of reproductive performance traits (n= 334?)
| Trait | Mean | Standard deviation |
| Voluntary waiting period (d) | 60 | 11 |
| Insemination period (d)1 | 48 | 3 |
| Gestation (d) | 278 | 5 |
| Dry period (d) | 74 | 27 |
| Number of abortions | 15 |
1Number of days from diagnostic test to gestation
In the milk production section, the lactation curve was based on the equation of Wood or incomplete Gama:21
Where:
Y: |
Milk production in kilograms |
a: |
Initial production |
t: |
Lactancy day |
b: |
Growth rate |
e: |
Constant |
c: |
Decrease rate |
The parameters a, b, and c of the equation were obtained from a sample of 334 lactation periods with the aid of SAS statistical software.
As part of the farm reproductive management, sexed semen is used in the first three artificial insemination events. If more insemination events are required, conventional semen is applied. The calving probability of a cow inseminated with sexed semen is 0.9, and 0.5 with conventional semen. In this way, the offspring sex of each cow is probabilistically known, which is essential to calculate the number of born males and females and therefore, the income associated with the offspring sale.
We conducted the economic analysis considering the identification and appraisal of costs and benefits. It included costs related to food, insemination, synchronization, and cow amortization. We also considered another category named “other costs” that included labor, medical and biological, healing material, other inputs, diesel, electricity, milking parlor and machinery services, laboratory analysis, landline and mobile phones, gasoline and stationery.
The benefits considered by the model are obtained from calve and milk sales. To calculate the total feed costs, the model includes four diets according to the different productive and physiological stages of the cow. Actual costs provided by the company participating in the study are shown in Table 3. For the “other costs” category, the monthly costs and the cost per cow per day are reported in Table 4.
Table 3 Actual costs of the provided diets according to milk production of the cows in the company participating in the study
| Diet1 | Cost (USD/day) |
| High production | 5.24 |
| Medium production | 4.83 |
| Low production | 3.08 |
| Dry cows | 1.18 |
1 The variation in the cost of diets is mainly determined by the amount of dry matter offered, the energy content (Mcal/kg of dry matter), the percentage of crude protein and for the quality of the forage fiber.
Table 4 Actual monthly costs and the derived cost per cow per day of items included in the “other costs” category in the company participating in the study
| Item | Cost (USD/month) |
| Labor | 905.08 |
| Medical and biological | 158.22 |
| Healing material | 64.09 |
| Supplies | 243.2 |
| Diesel | 139.19 |
| Electricity | 327.81 |
| Milking parlor and machinery services | 30.80 |
| Laboratory analysis | 35.25 |
| Landline and mobile phones | 55.53 |
| Gasoline | 34.87 |
| Stationery | 43.60 |
| Monthly total | 2,037.64 |
| Total per cow per day | 2.11 |
The costs per semen dose and synchronization protocol are included in the reproductive costs, including labor. The farm uses different semen prices, so we proceeded to obtain a weighted average using the reproductive records (Table 5). By inserting the value into the model, the insemination number that each cow required to get pregnant was calculated and then multiplied by the calculated average price.
Table 5 Actual costs per semen dose and its calculated weighted average in the company participating in the study
| Semen dose | Cost (USD) |
| Semen dose 1 | 17.67 |
| Semen dose 2 | 13.51 |
| Semen dose 3 | 10.31 |
| Semen dose 4 | 7.38 |
| Weighted average | 14.38 |
Similarly, the weighted average cost was calculated for the synchronization protocol. The model identified the number of synchronizations per cow and multiplied them by the weighted cost, which was USD 94.69. Finally, the costs for insemination and synchronization were added to get the total cost in terms of reproductive management.
We also estimated the benefits associated with increasing EED. For this farm, selling milk is their main income source; however, it is necessary to consider the income from the offspring sale. Although young females are not commercialized since they are used as replacement of culled cows, they were awarded a monetary value based on their opportunity cost. Revenues from the sale of culled cows are included as a variable in the formula for cow amortization.
Once we identified and quantified the revenue-generating activities in the company, their sale prices were investigated, to evaluate and determine the benefits in a given period (Table 6).
Table 6 Sale prices in the company participating in the study
| Item | Price (USD) |
| Milk (L) | 0.31 |
| Male calves (Head) | 18.92 |
| Female calves (Head) | 108.11 |
Cow attrition was introduced into the model calculating the amortization, using the following formula:
Where:
$ Replacement: |
918.91 |
$ Cull cows: |
421.62 |
Useful life: |
3.5 births |
Interval between calving: |
381 días |
Open days: |
Variable value according to each cow |
Gestation: |
Variable value according to each cow |
Since a cow’s useful life is accounted for calving number, this variable was inserted in the denominator of the above formula. The resulting ratio refers to the cow attrition per calving. However, the model required that this value was per day. Hence, cow attrition per calving was divided by the calving interval (381 days). The result corresponded to the cow attrition per day calculation.
When performing the simulations, each cow had a different calving interval according to the efficiency of estrus detection of the simulated scenario. Finally, the cow attrition value per day was multiplied by the interval between calving (open days plus the duration of gestation).
The price of cull cows, replacements and the number of calving during the productive cow life was based on the records.
Considering the overall costs and benefits, the model calculates the partial utility (defined as the difference between the earned incomes and costs associated only with changes in reproductive efficiency) and subsequently the adjusted utility (defined as the ratio of the partial p and interval calving duration in days, which is multiplied by 381 days that corresponds to the interval between births). The latter was inserted into the model due to differences in the reproductive cycle duration of cattle when amending the EED.
Results
As explained in the methods section, simulation was performed using a fixed percentage of 30 % conception. Thus, increasing the PR depends only on the increased efficiency in estrus detection. Under these conditions, utilities per cow per year with a PR of 15 % were USD166.01. When PR increases by five percentage points and up to 20 %, the profit increases USD 202.30 or up to a total of USD 368.31. Moreover, when PR increases from 20 to 25 %, the profit increases USD 105.01. Likewise, when PR was raised from 25 to 30 %, profit increased USD 34.44 (Table 7). In all scenarios, we observed a diminishing marginal cow per year utility. This trend suggests that the segment between 50 and 100 % of estrus detection, and the value obtained for each additional percentage point, is lower than that obtained from the previously increased percentage point. The EED that will generate the maximum economic benefit is the one in which the costs are equal to those obtained for the EED with economic benefit (i. e. the level at which the marginal cost equals marginal revenue).
Table 7 Cow utility per year in a dairy herd with different pregnancy rates
| Efficiency in estrus detection (%) |
Conception rate (%) |
Pregnancy rate (%) |
Cow utilitiy (USD/year) |
Differences in cow utility (USD/year) |
Marginal utility per percentage point (USD/year) |
| 50 | 30 | 15 | 166.01 | - | - |
| 65 | 30 | 20 | 368.31 | 202.30 | 40.46 |
| 83 | 30 | 25 | 473.32 | 105.01 | 21.00 |
| 100 | 30 | 30 | 507.76 | 34.44 | 6.88 |
Discussion
Estimated PR in Mexico is about 15 % (50 % efficiency in estrus detection and 30 % of conception).5 Therefore, if dairy farmers increase their efficiency in estrus detection about 15 percentage points, which can be achieved with trained staff and more time spent on this activity, they could duplicate their income per cow per year. Furthermore, increased efficiency in estrus detection can also be achieved by implementing estrus synchronization programs using F2α prostaglandin (PGF2α). In that sense, the use of FTI programs (i. e. ovsynch) would be equivalent to having efficient estrus detection of almost 100 %.22 In such a scenario, these programs would have a positive impact on the profitability of the dairy herd. However, the final decision of which program can be applied in the herd will depend on the costs associated with each program and will differ depending on the PR in which the dairy farm was originally located. Thus, in a dairy farm with a PR of 15 %, each percentage point increase in this variable (up to 20 %) could generate an additional income of USD 40.46 per cow. In this way, the proposed program should not cost more than this amount per cow and percentage point increase of PR. Conversely, a dairy farm with a PR of 21 %, could obtain a cow benefit of USD 21.00 for each percentage point increase in PR, until reaching 25 %, while it would be of USD 6.88 when PR increases from 25 to 30 %. Thus, the dairy farm must choose a breeding program that does not have costs higher than the expected benefits to avoid diminishing its usefulness.
Currently, the literature lacks enough specific data on the economic impact of the non-estrus detection and therefore, of PR in dairy herds. Consequently, the simulation model performed here, which accounted for several variables and had 1000 repetitions, is more precise and provides useful elements to facilitate decision-making of dairy farmers and their advisors, as well as the scientific community.
Conclusions
In contrast to what is usually assumed, this study demonstrated that the increase in EED should be limited to avoid decreasing marginal returns. Hence, to make the best decision, farmers should estimate the costs associated with the increase in the planned EED, which will be specific to each company and EED.
In the case of high-producing cows, the effect of improving the EED will not be the same as that observed here. For these production settings, lengthening the days in milk will cause a significant increase in the income from milk sales. Consequently, it is not wise to invest in technologies and management practices to improve EED.
Data availability
All relevant data are within the manuscript and its supporting information files.
Acknowledgments
Doctor Roberto Ruíz Díaz Doctor Héctor Raymundo Vera Ávila
Funding statement
There was not funding from any institution.
Conflicts of interest
The authors have no conflict of interest to declare in regard to this publication.
Author contributions
Conceptualization: JA Rios, CA López, J Hernández, R Trueta.
Data curation: JA Rios, CA López, J Hernández, R Trueta.
Formal analysis: JA Rios, CA López.
Investigation: JA Rios, CA López.
Methodology: JA Rios, CA López.
Validation: JA Rios, CA López.
Writing - original draft: JA Rios.
Writing- review and editing: JA Rios, CA López, J Hernández, R Trueta.

