


 nueva página del texto (beta)
 Inglés (pdf)
 Artículo en XML
 Referencias del artículo
 Enviar artículo por email
 Citado por SciELO
  Similares en
SciELO
Similares en
SciELO 
 Permalink
Introduction
Intensive livestock production systems have implemented new and efficient methods to increase productivity while reducing costs, by practices such as lowering feed production expenses, increasing housing density, reducing grazing, the use of performance-enhancing feed additives, and mass farm animal transport and slaughter.1 The reduction of prices in products of animal origin, as well as global trade, and enhanced advertisement and marketing, have increased animal protein consumption.2 However, the image of the animal industry has also been adversely affected by food-related disease crises (such as bovine spongiform encephalopathy, salmonellosis, etc.), which negatively impact consumer confidence in modern agricultural technologies.1,3Thus, consumers have either adopted an utilitarian (considering health and quality) or an ethical approach (contemplating animal and environmentally friendly production) to increasingly believe that food produced with natural methods is healthier.2,4Indeed, several studies report that the rate of consumers who pay attention to high animal welfare standards when purchasing red meat,5,6 eggs, poultry meat7,8 and milk9 is rising in Europe. Moreover, Queiroz et al.13 reported that a significant number of consumers do not have enough knowledge of animal welfare issues but believe that natural breeding methods will lead to improvement in product quality.
Consumer preference when buying animal food products is influenced by many factors.10,11 Products presented as healthy, tasty or environmentally friendly may have an increased appeal.4,5,10 Regarding production practices with high animal welfare standards, Kendall et al.12 have determined that: urban and rural life experience, social structural features (such as socio-economic class and family status) and personal characteristics (such as gender, age and education) are structural determinants of ensuing consumer attitudes. Furthermore, Te-Velde et al.5 and Vanhonacker et al.14 reported that the attitude of consumers towards goods produced with high animal welfare standards is influenced by other people opinions, norms, knowledge and interests (economic, social and moral interests). It has also been reported that purchasing higher standard animal welfare products means changing habits for the majority of consumers.7
The consumer segment that cares about high animal welfare standards creates marketing opportunities, when coupled to communication strategies that enhance consumer confidence, and allow the introduction of acceptably-produced animal goods.7,14,15 However, attitudes of this consumer target group need to be well examined, in order to overcome the potential challenges related to its preferences.16 In fact, sociology and marketing studies related to the standards of animal welfare on consumer attitudes have been limited, and not sufficiently explained. There is also a need to study the combination between public-oriented policies and consumer-oriented approaches.14 Information on the behavior of consumers that have or lack an interest in animal welfare needs to be characterized to appraise the introduction of goods produced by high animal welfare standards, as well as to develop effective communication strategies.7
To determine consumers’ perceptions and attitudes about any issue, questionnaires are frequently used. These should include valid and reliable scales, which can be developed through the Delphi technique established by Dalkey and Helmer17. The aim of this technique is to create reliable scales by obtaining an expert group consensus through a series of in depth opinion polls, interspersed with controlled opinion feedback. In short, the Delphi technique is used to take common views of a group of independent experts, unaware of each other, with a rational and written approach, so that program planning, policy development, events and trends can be predicted, and standards can be developed. In this study, a bespoke animal welfare attitude scale (AWAS) was designed to examine the cognitive, affective and behavioral dimensions of consumers’ attitudes in terms of animal welfare in Turkey. The AWAS further allowed allocation of consumers in three groups according to their overall attitudes towards animal welfare as impassive, moderate or sensitive. A previous lack of such a comprehensive scale in the literature stresses the importance of this study.
Materials and methods
Data collection and sample size
A questionnaire, constructed by the Delphi technique,17 was applied to determine a Turkish consumer attitude scale toward animal welfare. Permission to conduct the study was granted by the Scientific Research and Publication Ethics Committee of the Afyon Kocatepe University. Participants willingly contributed their answers when informed that the survey aimed to collect data for scientific purposes. There are numerous definitions of the concept of attitude, one of which comprises feelings, thoughts and behaviors towards something.18,19 Since in social psychology the attitude consists of cognitive, affective and behavioral dimensions, it was decided a priori -after a comprehensive literature review- that pertinent items of the scale would be placed under these three dimensions.18-19 In addition, for statistical validity, an exploratory factor analysis (EFA) and a confirmatory factor analysis (CFA) were performed to establish which items belonged to each dimension.
The Delphi technique was used when developing the questionnaire because a common animal welfare attitude scale was not encountered in the literature. The followed steps for the process were:
Problem definition: The questionnaire aimed to determine the consumer attitudes regarding animal welfare in terms of cognitive, affective and behavioral dimensions.
Election of panel members: Panelists were selected among scientists who could, through their knowledge, research and experience, contribute an educated perspective for question suggestion and placement. Fifteen experts were selected and contacted, from which 11 agreed to participate in the study.
First Delphi survey (round I): the problem of the study and the determined dimensions (cognitive, affective, behavioral) were sent to the panelists, whom were asked to write “items that can measure the consumer’s attitude towards animal welfare” and that could be placed under the established dimensions, to create an item pool. At the end of round I, 58 items were established by combining similar items in the pool.
Second Delphi survey (round II): The 58 items which were placed under the three dimensions were sent to the panel members to determine their level of agreement according to the 5-point Likert Type rating (1 = Strongly Disagree, 2 = Disagree, 3 = Neutral, 4 = Agree, 5 = Strongly Agree). Likert-type scales use fixed choice response formats that are designed to measure attitudes or opinions.21 This ordinal scale measures levels of agreement/disagreement. The acquired data were analyzed to generate median, quartile and range (q3-q1) statistics.
Third Delphi survey (round III): calculated medians, quartiles and ranges for the item pool and dimension placement were sent to the panelists, whom were again asked to give a score from 1 to 5, in order to reach a consensus of which items should be included in the questionnaire, to adequately establish an attitude scale. At this third round, 42 items were selected, and the AWAS was set. Some similar items were purposely used within the scale to check whether the participant’s answers to similar questions were analogous.
The study population included consumers over 18 years of age, living in all seven regions of Turkey. Due to time, cost and distance constraints, a stratified statistic method was used to determine the sampling size and to establish the sampling plan. According to results from the socio-economic development level studies by the Turkey Statistics Institute, consumers living in 2 cities per region were included (the cities of Kars and Muş in Eastern Anatolia, Gaziantep and Batman in South Eastern Anatolia, Bolu and Samsun in the Black Sea region, Sivas and Konya in Central Anatolia, Burdur and Adana in the Mediterranean Region, Afyonkarahisar and Aydın in the Aegean Region, and Tekirdağ and Balıkesir in the Marmara Region).
The sample size was calculated with the formula (n = s2.Zα 2/d2) proposed for large populations (when the population size is larger than 10,000) in survey research.22 As a result of a pilot study including 50 people, a standard deviation of s = 0.9, an effect size of d = 0.1 and Z0.05= 1.96 (for significance level α = 0.05) were used as parameters in the formula. A minimum sample size of 311 consumers for each region was calculated (an equal number of consumers were surveyed for each region and city, since the population size was over 10,000, see formula above)22. The total sample size was thus established at 2177 (311×7 = 2177). Accordingly, 2500 questionnaires were applied -as face to face interviews-, where consumers had to evaluate each item using the Likert scale. Two hundred and five questionnaires were discarded due to inconsistency between the answers given to similar questions, or due to incomplete and incorrect data. Final evaluation was performed on 2295 questionnaires.
Statistical analyses
First, to determine the factor structure of the AWAS, an EFA was performed using varimax rotation. Within the EFA, the Bartlett’s test of sphericity was used for applicability of the factor analysis, and the Kaiser-Meyer-Olkin measure was used to evaluate sampling adequacy. In addition, eigenvalues, variance explanation rates and factor loadings were calculated. The reliability, mean, and standard deviation for the items and dimensions were also determined. The mean values for each item were calculated by dividing the sum of scores given in 5-point Likert scale, by the number of respondents (initially panelists and subsequently consumers). Mean values indicated negative attitudes as they approached 1, whilst values closer to 5 denoted positive attitudes as they approached 5.
Considering a calculated minimum sample size of 311consumers per region, a CFA was performed on an independent sample of 425 consumers (allowing for potential incomplete or incorrect questionnaires that would have to be eliminated), to confirm the factor structure obtained from the EFA. Also, goodness of fit indices for the CFA were determined by the Root Mean-Square Error of Approximation (RMSEA), the Normed Fit Index (NFI), the Non-normed Fit Index (NNFI), the Comparative Fit Index (CFI), the Standardized Root Mean Square Residual (SRMR), the Adjusted Goodness-of-Fit Index (AGFI) and the Chi-Square/degree of freedom (X2/df).
The overall attitude towards animal welfare of the 2295 surveyed consumers was established by the Ward’s hierarchical clustering method. The consumers were divided as impassive, moderate or sensitive based on their responses to the 42 items. For clustering, the squared Euclidean distance was used, and a level of 10 was obtained as a minimum reference distance. Further, to obtain a more detailed assessment of found differences between these 3 clusters, a further categorization of consumers as impassive, moderate or sensitive was established within each dimension. One-way ANOVA and the Tukey’s post-hoc test were used for comparison between groups obtained from the cluster analysis, and between groups of differing socioeconomic characteristics. Statistical significance was set at p < 0.05. The CFA was performed, using LISREL 8.71. All other data were analyzed with SPSS 21.0 for Windows (SPSS, Inc., Chicago).
Results and discussion
According to data obtained from the 2295 surveyed consumers, the results for the EFA and the reliability analysis (Cronbach’s alpha coefficients), as well as the corrected item-total correlations and calculated means (± SD) for items and dimensions (cognitive, affective and behavioral) for the AWAS attitude scale are presented in Table 1.
Table 1 Exploratory factor analysis, reliability analysis (Cronbach’s alpha coefficients), corrected item-total correlations and calculated means (± SD) for items and dimensions of the AWAS applied to consumers
| Dimensions and Items | Factor loadings | Corrected item-Total correlation | Cronbach’s Alpha if item deleted | Likert scale ¯X ± SD |
| Cognitive dimension-Eigenvaluesa (% of variance): 13.624 (32.439%)- | 0.853* | 4.02 ± 0.59 | ||
| C1. Conditions of animal shelter affect animal welfare. | 0.784 | 0.494 | 0.917 | 4.56 ± 0.73 |
| C2. Animal feeding conditions affect animal welfare. | 0.872 | 0.454 | 0.917 | 4.53 ± 0.68 |
| C3. Animal health conditions affect animal welfare. | 0.793 | 0.434 | 0.917 | 4.53 ± 0.73 |
| C4. Staff responsible for the care of animals has an impact on animal welfare. | 0.843 | 0.601 | 0.916 | 4.37 ± 0.81 |
| C5. Conditions of transporting animals from one place to another have an impact on animal welfare. | 0.694 | 0.565 | 0.916 | 4.02 ± 1.03 |
| C6. Conditions that may lead to the nervousness of animals affect animal welfare. | 0.808 | 0.550 | 0.916 | 4.24 ± 0.93 |
| C7. The conditions of reproduction of animals affect animal welfare. | 0.798 | 0.475 | 0.917 | 4.22 ± 0.93 |
| C8. The relationship process of animals with their offspring affects animal welfare. | 0.735 | 0.504 | 0.916 | 4.25 ± 0.90 |
| C9. Equipment and technology used in animal production affect animal welfare. | 0.688 | 0.511 | 0.916 | 4.08 ± 1.02 |
| C10. The feeling of self-confidence affects welfare of the animals. | 0.786 | 0.550 | 0.916 | 4.24 ± 1.00 |
| C11. The recognition of the animals as individual affects animal welfare. | 0.644 | 0.640 | 0.915 | 3.88 ± 1.14 |
| C12. Slaughtering of livestock affects animal welfare. | 0.448 | 0.538 | 0.916 | 3.37 ± 1.34 |
| C13. Naming animals affect animal welfare. | 0.468 | 0.516 | 0.917 | 3.30 ± 1.39 |
| C14. The conditions during transport affect animal welfare. | 0.705 | 0.643 | 0.915 | 3.93 ± 1.09 |
| C15. Religious sacrificing animals affect animal welfare. | 0.495 | 0.488 | 0.917 | 3.20 ± 1.49 |
| C16. Leave the animals in streets (like as cats, dogs) affects animal welfare. | 0.618 | 0.607 | 0.915 | 3.86 ± 1.19 |
| C17. The activities of non-governmental organizations supporting animal protection affect animal welfare. | 0.648 | 0.563 | 0.916 | 4.03 ± 1.08 |
| C18. Legislation regarding animals has an impact on animal welfare. | 0.625 | 0.600 | 0.915 | 3.90 ± 1.13 |
| C19. Purchase of food products have been produced in animal friendly production system (milk, egg, meat, etc.) affects animal welfare. | 0.562 | 0.588 | 0.916 | 3.76 ± 1.22 |
| C20. Interaction between animals and humans affects animal welfare. | 0.742 | 0.607 | 0.915 | 4.14 ± 1.02 |
| Behavioral dimension -Eigenvalues (%of Variance): 8.9158 (21.228%)- | 0.845* | 3.55 ± 0.78 | ||
| B1. I am interested in animal welfare. | 0.714 | 0.602 | 0.915 | 3.32 ± 1.26 |
| B2. Animal welfare issue affects my choices when buying animal products. | 0.753 | 0.604 | 0.915 | 3.12 ± 1.30 |
| B3. I tell people around me about animal welfare. | 0.819 | 0.656 | 0.915 | 3.20 ± 1.29 |
| B4. I encourage people to treat animals well. | 0.768 | 0.629 | 0.915 | 3.83 ± 1.07 |
| B5. It approaches with compassion for street animals. | 0.854 | 0.672 | 0.915 | 3.91 ± 1.11 |
| B6. I support the civil societies dealing with animals. | 0.832 | 0.607 | 0.915 | 3.63 ± 1.21 |
| B7. I comply with legislation regarding animals. | 0.836 | 0.618 | 0.915 | 3.90 ± 1.07 |
| B8. I always treat animals well. | 0.814 | 0.584 | 0.916 | 4.13 ± 0.99 |
| B9. I make required attempts against animal violence. | 0.834 | 0.615 | 0.915 | 3.81 ± 1.16 |
| B10. I buy products that have been produced in compliance with high animal welfare standards. | 0.818 | 0.588 | 0.916 | 3.38 ± 1.31 |
| B11. I buy products produced under high animal welfare standards although they are expensive. | 0.792 | 0.606 | 0.915 | 3.28 ± 1.36 |
| B12. I can easily identify using the label on the product if it has been produced in animal friendly production system (milk, egg, meat etc.). | 0.777 | 0.484 | 0.917 | 3.12 ± 1.30 |
| Affective/Emotional Dimension -Eigenvalues (% of Variance):7.701(18.336%)- | 0.832* | 4.01 ± 0.57 | ||
| A1. I think animals as an individual. | 0.722 | 0.464 | 0.917 | 3.67 ± 1.29 |
| A2. Animals have been created for human use. | 0.529 | -0.353 | 0.922 | 2.89 ± 1.45 |
| A3. I believe that animals have a well-being. | 0.830 | 0.589 | 0.916 | 4.14 ± 0.97 |
| A4. I believe that animals are sentient beings. | 0.882 | 0.481 | 0.917 | 4.44 ± 0.82 |
| A5. I can understand that an animal feels pain or suffers. | 0.824 | 0.542 | 0.916 | 4.20 ± 1.01 |
| A6. Using violence on animals is atrocious. | 0.836 | 0.420 | 0.918 | 4.58 ± 0.85 |
| A7. I believe that there is a relation between domestic violence and intentional harm against animals. | 0.819 | 0.542 | 0.916 | 4.04 ± 1.09 |
| A8. I believe that animals have rights like people. | 0.862 | 0.641 | 0.915 | 4.12 ± 1.05 |
| A9. I believe that attitudes of people towards animals affect others’ perception towards them. | 0.849 | 0.573 | 0.916 | 4.05 ± 1.09 |
| A10. I believe that happy animals will produce higher quality products such as meat, milk, eggs, etc. | 0.798 | 0.526 | 0.916 | 4.05 ± 1.21 |
| General (overall) scale Cumulative Variance %: 72.003% | 0.918b | 3.89 ± 0.54 |
a The eigenvalue is a coefficient used in calculating the rate of variance explained by each factor or dimension.
b Cronbach’s Alpha value for subscales and overall scale
Kaiser-Meyer-Olkin Measure of Sampling Adequacy (KMO) = 0.915
Bartlett’s Test of Sphericity: Chi-Square = 9432.162; p < 0.001
The KMO and Bartlett’s test of sphericity confirmed sampling adequacy and applicability of the factor analysis for the AWAS (Bartlett’s Test of Sphericity: x 2= 9432.162; p < 0.001 and KMO = 0.915). The 42 items collected under 3 dimensions explained 72.003% of the total variance of the model. The cognitive dimension, which included 20 items and accounted for 32.439% of the total variance, had the higher relative weight on the scale, followed by the behavioral (21.228%) and affective/emotional (18.336%) dimensions. Factor loads of all items were higher than 0.40.
Cronbach’s alpha coefficients for reliability analysis were calculated as 0.853 for the cognitive dimension, 0.832 for the affective dimension, and 0.845 for the behavioral dimension, with a 0.829 established for the overall scale that comprised all 42 items. Every coefficient was above the 0.70 established as the critical value. The corrected item-total correlation values exceeded 0.35 (Table 1). A negative correlation was found for the 2nd item (A2) in the affective dimension. The Cronbach’s alpha coefficients were found to be high (Table 1).
According to the responses given by consumers, the calculated means (¯X ± SD) for the cognitive, affective and behavioral dimensions were 4.02 ± 0.59, 4.01 ± 0.57 and 3.55 ± 0.78, respectively, indicating that there is a more impassive (negative) attitude in the behavioral dimension than in the cognitive or the affective dimensions. All these values were above 3 in the 5-point Likert score. When considering the calculated means within the cognitive dimension, items C12 (¯X = 3.37), C13 (¯X = 3.30) and C15 (¯X = 3.20), showed lower values, i.e. consumers attitude towards these statements tended to be more negative, when compared to other items in this same dimension. As for the behavioral and affective dimensions, the lower means were found for items B2 (¯X = 3.12), B12 (¯X = 3.12) and B3 (¯X = 3.20), and items A2 (¯X = 2.89) and A1 (¯X = 3.67), respectively, revealing a more negative attitudes of consumers for these particular entries. The calculated overall mean for the scale was 3.89 ± 0.54.
The CFA that allowed testing the factor structure to determine adequacy of dimensions, as well as how strongly the items belong to each dimension is presented in Figure 1. The items within this figure are identified with letters that correspond to labels and statements found in Table 1. The fit indices23,24 for construct validity in the CFA are shown in Table 2. The RMSEA, NFI, SRMR, and AGFI indicate an acceptable fit, whereas the NNFI, the CFI and the x 2/df denote a good fit. Results for fit indices, standardized partial correlation coefficients (seen to the right of item labels in Figure 1), and error covariance values (seen to the left in Figure 1), showed that a three-factor model fits the data adequately.
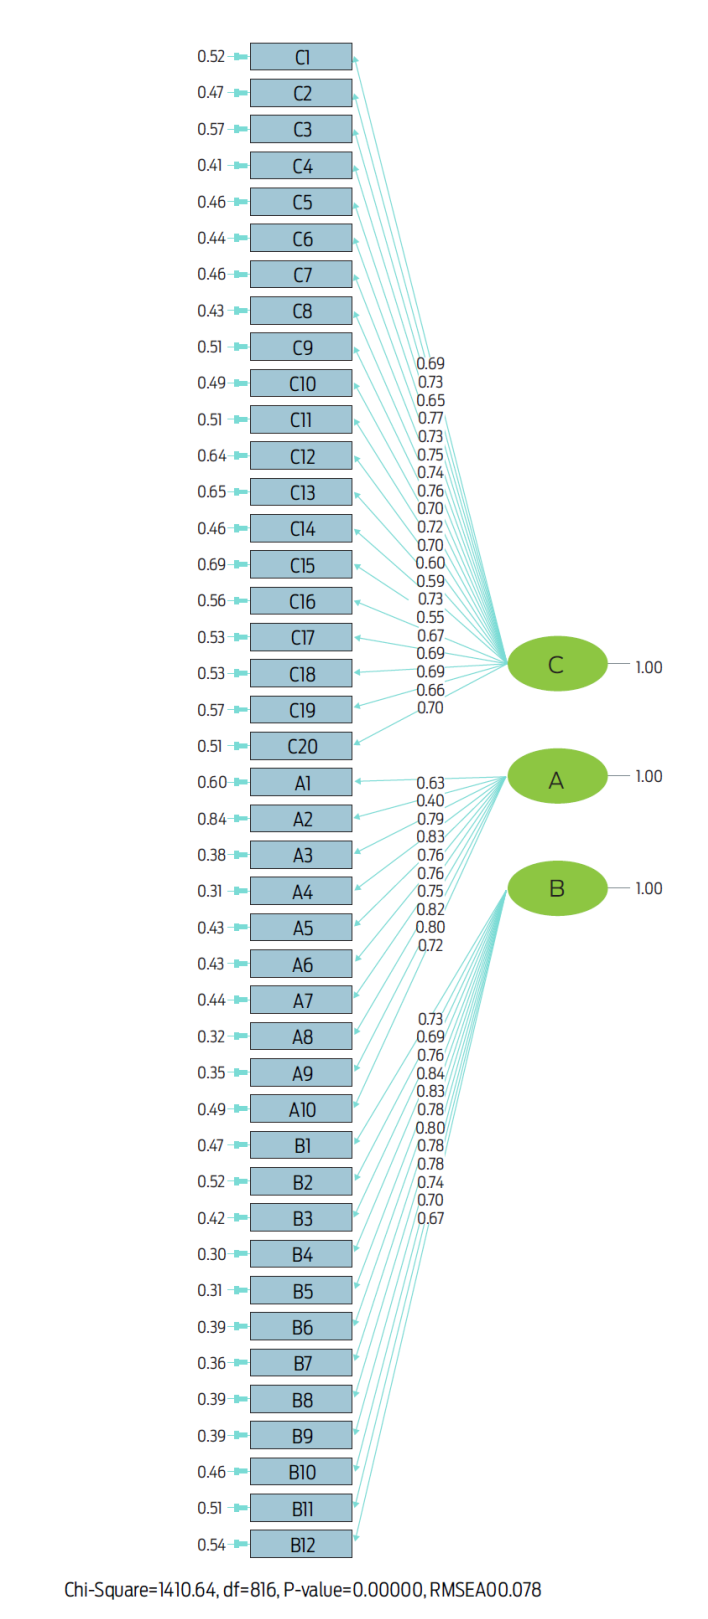
Figure 1 CFA used to test the factor structure of the bespoke AWAS. (A = affective, B = behavioral, C = cognitive; numbers that accompany the letters are items placed in the corresponding dimensions). X2: degrees of freedom; RMSEA and p values for the analysis are shown at the bottom of the figure. Standardized partial correlation coefficients are shown to the right, and error covariance values are presented to the left of item labels.
Table 2 Goodness of fit indices for the AWAS
| Fit Measure | Good Fit | Acceptable Fit | Goodness of Fit Statistics | Result |
| RMSEA | 0≤RMSEA≤0.05 | 0.05<RMSEA≤0.08 | 0.078 | Acceptable |
| NFI | 0.95≤NFI≤1 | 0.90≤NFI<0.95 | 0.930 | Acceptable |
| NNFI | 0.97≤NNFI≤1 | 0.95≤NNFI<0.97 | 0.990 | Good fit |
| CFI | 0.97≤CFI≤1 | 0.95≤CFI<0.97 | 0.990 | Good fit |
| SRMR | 0≤SRMR≤0.05 | 0.05<SRMR≤0.10 | 0.066 | Acceptable |
| AGFI | 0.90≤AGFI≤1 | 0.85≤AGFI<0.90 | 0.860 | Acceptable |
| x2/DF | <3 | <5 | 1.730 | Good fit |
RMSEA: Root Mean-Square Error of Approximation; NFI: Normed Fit Index; NNFI: Nonnormed Fit Index; CFI: Comparative Fit Index; SRMR: Standardized Root Mean Square Residual; AGFI: Adjusted Goodness-of-Fit Index.
The classification of consumers according to their overall attitudes towards animal welfare (which included the 42 items), was done by a clustering analysis. Accordingly, consumers were initially divided in two groups, and then one of these groups was further divided in two other groups (due to the established minimum reference distance of 10), finally obtaining three overall groups. The overall attitude of consumers towards animal welfare was defined as low (impassive), middle (moderate) or high (sensitive). Results show that 16.9% (n = 387) of the surveyed consumers had an overall impassive attitude, 49.9% (n = 1146) a moderate attitude and 33.2% (n = 762) a sensitive attitude toward animal welfare. To have a more detailed assessment of cluster attitudes of consumers, the impassive, moderate and sensitive grouping was additionally executed within each dimension and compared by ANOVA (Table 3). Consumers with an impassive attitude towards animal welfare had the lowest means for within each of the three dimensions in the analysis (Table 3).
Table 3 Comparison of consumer attitudes within each dimension
| Dimension | Cluster | ¯X | SD | P |
| Cognitive | Low (impassive) | 3.33c | 0.55 | < 0.001 |
| Middle (moderate) | 3.98b | 0.34 | ||
| High (sensitive) | 4.55a | 0.33 | ||
| Affective | Low (impassive) | 3.36c | 0.53 | < 0.001 |
| Middle (moderate) | 4.01b | 0.39 | ||
| High (sensitive) | 4.48a | 0.33 | ||
| Behavioral | Low (impassive) | 2.56c | 0.57 | < 0.001 |
| Middle (moderate) | 3.35b | 0.43 | ||
| High (sensitive) | 4.35a | 0.43 |
a,b,c Different superscripts in the means column within each dimension indicate statistical difference at p < 0.01.
Interviewed consumers were 56.3% and 43.7% male and female respectively, of which 42.6% were married and 57.4% were single. Group ages of participants were 18-30 (38.2%), 31-40 (23.3%), 41-50 (21.1%) and over 51 years old (17.4%). Levels of education were primary school (19.7%), secondary school (65.7%) and university (14.6%). Monthly income of interviewees was of 350 USD or under (31.5%), 351-1000 USD (52.6%) and 1001 USD or over (15.9%).
The association between consumer attitudes and demographic variables was examined and no differences were observed in terms of gender, age or marital status (p > 0.05). However, differences were found for education and socio-economic levels (p < 0.01), with consumers with lower education and socio-economic levels having a more impassive overall attitude towards animal welfare (Table 4).
Table 4 Comparison of overall consumer attitudes within different education and socio-economic levels
| Variable | Demographic Group | n | % | ¯X | SD | P |
| Education levels | Primary education | 453 | 19,7 | 3,43c | 0,56 | < 0.001 |
| Secondary education | 1508 | 65,7 | 3,92b | 0,44 | ||
| University | 334 | 14,6 | 4,31a | 0,65 | ||
| Socio-economic levels (monthly income US dollars) | 350 < | 723 | 31,5 | 3,61c | 0,58 | < 0.001 |
| 351-1000 | 1208 | 52,6 | 3,88b | 0,49 | ||
| 1001 > | 364 | 15,9 | 4,43a | 0,61 |
a,b,c Different superscripts in the means column within each demographic group indicate statistical difference Means of groups followed by different letters differ significantly at p < 0.01.
In this study, a bespoke scale (AWAS) consisting of 42 items within 3 dimensions was
developed to determine an overall consumer attitude towards animal welfare. The 42
items included in this scale were allocated according to the ABC basis of social
psychology20, i.e. the
affective, behavioral and cognitive dimensions.
The affective dimension comprises items measuring
emotions (happiness, fear, anxiety, etc.) of individuals. The behavioral dimension
comprises items regarding active responses related to animal welfare. The cognitive
dimension contains items that express ideas of individuals and include some basic
knowledge. According to the results of the EFA, the 42 items included in the three
dimensions explained more than two-thirds of the total variance in the study. The
results of the EFA, the CFA25, the
Cronbach’s Alpha26 and the
Corrected item-total correlation27
confirmed the validity and reliability of the AWAS without removing any items.
The consumer attitudes for each dimension and the overall attitude of the consumers towards animal welfare were defined by mean and standard deviation values of the Likert scale. Interestingly, the overall scores for the behavioral dimension were lower than those for the cognitive and affective dimensions. This indicates that consumers can have positive attitudes in the cognitive and affective dimensions towards animal welfare yet tend to fail to behave accordingly. This implies that consumers may display an unpredictable behavior with respect to acquiring food of animal origin produced under high animal welfare standards. These results may be since the respondents were more sensitive28 to norms consisting of beliefs and values, or that they were inclined to respond the survey questions in a way that is expected from a social perception. Alternatively, participants may have answered to the cognitive and affective dimension items according to accepted social norms, whereas the behavioral dimension items may have been approached based on their daily purchasing routine. Several studies5,14 have in fact reported that individuals tend to respond to surveys as members of a social group and give more importance to animal welfare than is the case. Moreover, Grunert28 reported that people approached animal welfare in accordance with social norms and showed high sensitivity towards this issue, yet still purchased products from the production systems that they strongly criticized as consumers.
In the cognitive dimension, consumers stated that naming, slaughtering and religious sacrificing of animals (religious slaughter without stunning) did not considerably affect animal welfare. Results from answers to items in the affective dimension revealed that animals are mainly believed to have been created for human use and are not generally considered as individuals. This supports the argument that the values and norms of the participants may have an utilitarian basis, where farm animals are raised for eggs, milk and meat, or that their slaughtering is a legitimate right.5 This may also be valid for the religious sacrifice of animals as a fundamental form of worship, where values and norms might be embedded with strong religious foundations.1,5 However, since participants were not asked whether they partake with religious practices such as animal sacrificing, the answers to this particular item may be biased, as it may be affected by whether or not they practice a religion.
In terms of the behavioral dimension, Turkish consumers do not appear to give much consideration to animal welfare, and hence to their potential purchase of animal origin goods produced with high animal welfare standards. Their interest in communicating animal welfare related issues is also low. The fact that animal welfare issues have only very recently been put on the agenda, following accession of Turkey as a member state of the European Union in 2018, with only poultry eggs having labels according to production type, suggest that the conceptual knowledge of Turkish consumers in terms of animal welfare is still inadequate.29 The lack of animal friendly production labels for milk, meat and other animal products on the market, the absence of promotion or advertising of these products, and the limited activities supporting animal welfare sponsored by producer or consumer organizations also contribute to the inadequate animal welfare practices information status of Turkish consumers. Three basic groups were determined as a result of the cluster analysis, to establish an overall attitude of Turkish consumers toward animal welfare, and differences between them were found. The consumers were defined as impassive (low), moderate (middle) or sensitive (high). Results show that half of the consumers in Turkey were considered as having a moderate overall attitude towards animal welfare, while one out of every six people showed to be impassive, and 33.2% of the consumers placed in the sensitive section. The proportion of consumers with a moderate attitude towards animal welfare presents an area of opportunity for new high animal welfare standard products on the Turkish market. Moderate individuals may be influenced to display more sensitive attitudes following new personal experiences, changes in social and living environments and an improved knowledge of animal welfare.14 As stated above, the low proportion of participants placed in the sensitive consumer segment could relate to the fact that animal welfare is a relatively new concept in Turkey, and legislation changes are still ongoing.
When demographics of the participants were analyzed, education and socio-economic levels of consumers in Turkey seem to also have an impact on consumer overall attitude toward animal welfare. In fact, consumers within the lower education and socio-economic levels more frequently showed an impassive attitude, than that seen in other levels of these categories. There is a wide range of literature on how demographic factors such as socio-economic structure and education level can affect animal welfare perception and attitudes.11,12,14,30 In fact, a positive association between animal welfare concern, and higher education and economic income levels has been found. The fact that people with lower education and income exhibit a more negative animal welfare attitude may relate to their need to assign utilitarian values and norms to products, and possibly to insufficient knowledge about the impact of industrial production on animal welfare, as well as on human and environmental health. Therefore, these consumers may be less inclined to have a sensitive attitude in relation to ethic purchasing. Similar results have been reported by Kendall et al.12, and Kılıç and Bozkurt30. In addition, consumers with a lower socio-economic profile may have a stronger connection to rural areas and agriculture, reinforcing their utilitarian approach to animal welfare.12,14 Moreover, literature reports argue that other social factors, such as life experiences, having children and pets, or being a vegetarian may also enhance a sensitive attitude towards animal welfare standards in production systems.1,6,12,14
Conclusion
The attitude scores of Turkish consumers in the cognitive, affective and behavioral dimensions, as well as an overall attitude score of participants toward animal welfare were determined in this study. Proportions of sensitive attitudes for the cognitive and the affective dimensions were higher than that for the behavioral dimension. That is, while consumers did not approve of inhumane or low animal welfare production standard practices, this was not reflected in their behavior and hence their potential purchasing habits. An increased knowledge of the positive effects of humane animal production on derived products and on the environment, as well as the introduction of improved animal welfare regulations, the development of product label follow-up habits, the introduction of more animal-friendly production-type products, and the increase in advertising and awareness activities of retailers and consumer organizations may progressively have a positive impact on overall consumer behavior. This could enhance the potential marketing opportunities for animal friendly products in Turkey in the near to medium term. However, further studies are warranted to clearly ascertain the understanding, opinions, perceptions, attitudes and behaviors of Turkish consumers regarding sustainable animal production strategies.

