


 nueva página del texto (beta)
 Inglés (pdf)
 Artículo en XML
 Referencias del artículo
 Enviar artículo por email
 Citado por SciELO
  Similares en
SciELO
Similares en
SciELO 
 Permalink
Introduction
Since the generation of Bitcoin´s genesis block in 2009 the impact of cryptocurrency markets on the global economy is constantly growing. Currently, there exist about 9,500 different cryptocurrencies from which Bitcoin is by far the most important one (CoinMarketCap, 2022). Nevertheless, also, for example, Ethereum, BNB and XRP (besides many others) are nowadays globally important cryptocurrencies. Although designed usually as means of exchange, especially in recent years cryptocurrencies also catch increasing and significant attention as investment vehicles and, hence, speculative assets.
The disease of Coronavirus (COVID-19) started in late 2019 in the city of Wuhan, China, and was declared a pandemic by the World Health Organization (WHO) in March 2020. Since then, the disease not only has caused a severe global health crisis, but also impacted in a detrimental manner in many international economies as well as financial markets. Generally, for many leading international stock markets the negative effect in form of a financial crisis was rather short-term during the beginning of the pandemic in spring 2020. However, briefly afterwards market prices recovered and started to rise again as a reaction to first vaccine trails as well as economic stimulus packages (Rahman et al., 2021). With respect to the performance of cryptocurrency markets during the COVID-19 pandemic financial literature is still scarce and primarily centered on the analysis of Bitcoin and the first few months of the pandemic in 2020.
Therefore, the research question of the present study is as follows: Which differences can be found in the data series of market prices of the leading cryptocurrencies Bitcoin, Ethereum, BNB and XRP before and during the COVID-19 pandemic? to answer the outlined research question, a longitudinal, exploratory, and quantitative research design is chosen. Hence, the present study analyzes and compares statistical moments of the four leading free-floating cryptocurrencies - Bitcoin, Ethereum, BNB and XRP - for the period 01/01/2019 to 12/31/2021 as well as for the two subsamples Period 1 (01/01/2019 - 03/10/2020) and Period 2 (03/11/2020 - 12/31/2021). To divide the whole data sample into its two respective subsamples the WHO announcement of a global pandemic on 03/11/2020 was chosen as the crucial date. The hypothesis underlying the present study is that there do exist differences between the data series of market prices of the leading cryptocurrencies Bitcoin, Ethereum, BNB and XRP before and during the COVID-19 pandemic.
Besides the analysis of the selected cryptocurrencies also a comparison with two traditional assets - stocks represented by the MSCI World Index as well as gold futures as a commodity - is carried out. In order to sustain the results of the descriptive analysis of cryptocurrency´s statistical moments, the present study also searches for structural changes using the Chow test combined with stationarity tests. Furthermore, the present paper also considers the design and analysis of optimized cryptocurrency portfolios and their comparison to single cryptocurrency investments.
The remainder of the paper is structured as follows. After this brief introductory part, the first section presents theoretical and contextual fundamentals with reference to cryptocurrencies, the COVID-19 pandemic, and its impact on international financial markets. Section 2 outlines the research approach used in the study. Afterwards Section 3 presents the results of the study and offers a brief discussion. The study closes with some concluding remarks.
I. Literature review
Fundamentals of Cryptocurrencies
Cryptocurrencies are an application of the so-called blockchain technology which beginning in recent years has revolutionized the economic world. According to Antonopoulus (2017) the blockchain is a “list of validated blocks, each linking to its predecessor all the way to the genesis block (p. xxiii)” and a block can be defined as a “grouping of transactions, marked with a timestamp, and a fingerprint of the previous block (p. xxiii)”. There exists a vast field of adoptions of the blockchain technology with for example its applications in distributed storage systems, within healthcare services, decentralized voting systems, financial services, and as non-fungible tokens (ownership rights to digital art) - just to name a few (Miraz and Ali, 2018).
One of the most widely known forms of usage of blockchain technology can be found in cryptocurrencies in which financial operations are realized in a decentralized and autonomous manner, i.e., without the help of a financial intermediary as well as the supervision of a central authority. As cryptocurrencies use peer-to-peer networks to realize financial transactions, they establish a direct relation between payers and payees. Consequently, they usually allow for time and cost advantages in comparison with the traditional system of financial intermediation (Ocariz, 2019).
In the opinion of Härdle, Harvey and Reule (2020) a cryptocurrency is a digital asset designed as a medium of exchange (especially in the context of e-commerce) which uses cryptography to secure transactions, to control the creation of additional units and to verify the transfer of assets. Moreover, Abramova and Böhme (2016) identify cryptocurrencies as innovative, digital instruments which potentially endanger traditional payment systems based on financial intermediation through commercial banks. Although cryptocurrencies are highly dynamic and innovative instruments, the concept of digital payment systems is not new. Already Chaum (1983) introduced the idea of an automated payment system based on techniques of cryptography.
Table 1 shows the currently (03/08/2022) Top 10 cryptocurrencies by market capitalization expressed by the product of current market price times the number of circulating coins. According to CoinMarketCap (2022) there exist more than 9,500 cryptocurrencies worldwide. As can be seen, the general cryptocurrency market is dominated by Bitcoin with a market capitalization of USD 735,038,062,182 what accounts for 53.44 % of the overall market capitalization of all the Top 10 currencies (USD 1,375,424,179,133). In second place one can find Ethereum with a capitalization of USD 307,911,519,741 (22.39 % of the Top 10 overall) and in third place Tether (USD 80,042,688,040, 5.82 % of the overall).
Table 1 Top 10 cryptocurrencies by market capitalization (USD) (03/08/2022)
| Cryptocurrency | Market Capitalization (USD) |
| 1. Bitcoin | 735,038,062,182 |
| 2. Ethereum | 307,911,519,741 |
| 3. Tether | 80,042,688,040 |
| 4. BNB | 63,284,355,056 |
| 5. USD Coin | 52,576,978,356 |
| 6. XRP | 34,587,150,286 |
| 7. Terra | 29,394,502,672 |
| 8. Cardano | 26,911,643,647 |
| 9. Solana | 26,455,100,641 |
| 10. Avalanche | 19,222,178,512 |
Source: CoinMarketCap (2022)
Within this Top 10 there are listed two examples of stablecoins (Tether and USD Coin) whose market prices are tied to an underlying (in their case USD) to basically eliminate price volatility. All the other cryptocurrencies shown in Table 1 are normal free-floating currencies. Hence, Bitcoin, Ethereum, BNB and XRP - research objects of the present study - are the most important free-floating cryptocurrencies which currently exist.
As the present day most important and widely known cryptocurrency, Bitcoin was introduced in 2008 in a white paper written under the alias of Satoshi Nakamoto and the Bitcoin network started in 2009 with the mining of its genesis block (Antonopoulus, 2017). Based on the functioning of Bitcoin but also on its weakness Vitalik Buterin invented in 2013 Ethereum which was launched in 2015 (Ethereum, 2023). BNB (Binance Coin) was introduced in 2017 by Changpeng Zhao, founder and CEO of the world´s currently largest cryptocurrency exchange Binance (Forbes, 2023). Finally, in 2016 Ryan Fugger founded the Ripple project which intends to improve the international transfer system of the financial sector by implementing the cryptocurrency XRP (Expansion, 2022).
Generally, all the mentioned cryptocurrencies were originally designed as a mean of exchange principally within e-commerce transactions and / or cross-border transfers. Nevertheless, in recent years the influence of speculative trading motives increased substantially within the overall cryptocurrency market. Therefore, today there exists a vast amount of scientific studies which characterize Bitcoin, Ethereum and cryptocurrencies in general as a highly volatile investment alternative vulnerable to excessive speculation. For instance, Schilling and Uhlig (2019) identify the lack of control and regulation by governmental institutions as one important reason for the wild price fluctuations of cryptocurrencies. Also, Samson (2020) as well as Demmler and Fernández (2022) characterize Bitcoin as exceptionally volatile and consider that its trading is mostly driven by speculation instead of its fundamentals.
Furthermore, Cheah and Fry (2015) as well as Moosa (2020) characterize Bitcoin as a speculative asset which continuously suffers periods of asset price bubbles. At this point, according to Kindleberger and Aliber (2005) as well as Agosto and Cafferata (2020) an asset price bubble can be defined as a financial market’s phenomenon, which is based on speculation and where the market price of an asset at first sharply increases and then collapses again. For example, Gerlach, Demos and Sornette (2019) find multiple bubble periods within Bitcoin market prices between 2012-2018. Also, Bouri, Shahzad and Roubaud (2019), examining price data between 2015 and 2017, find evidence for multiple financial bubble periods in the market prices of Bitcoin and other major cryptocurrencies leading to the conclusion that there might even exist contagion effects between one cryptocurrency to another. Similar results are obtained by Agosto and Cafferata (2020) for Bitcoin and four other leading cryptocurrencies for the period 2017-2018. In line, Montasser, Charfeddine and Benhamed (2022), analyzing 18 major cryptocurrencies, identify within their sample (October 2017 until January 2021) cryptocurrency bubbles in late 2017 and early 2018 as well as July 2020. For a more recent dataset from December 2019 to June 2021 Shu, Song and Zhu (2021) find evidence for bubble tendencies in Bitcoin market prices for the periods winter 2020/2021 and spring 2021. Also, Mnif et al. (2022) find evidence for multiple bubble periods in cryptocurrency market prices during the COVID-19 pandemic.
COVID-19 Pandemic and Impact on International Financial Markets
The disease of Coronavirus (COVID-19) is an infectious disease caused by the SARS-CoV-2 virus (WHO, 2023). First cases of the illness were detected in late December 2019 and early January 2020 in China. A large part of these cases was directly related to the Huanan Wholesale Seafood Market in Wuhan City, China, as many of the initial patients were stall owners, market employees or regular visitors of this market (WHO, 2020). On 03/11/2020 the World Health Organization announced the existence of a pandemic which endangers humankind on a global scale. Until today (03/08/2022) globally there have been 446,511,318 confirmed cases of COVID-19, including 6,004,421 deaths (WHO, 2022).
Beginning in spring 2020 the global health crisis caused by the SARS-CoV-2 virus had significantly negative impacts on the global economies and financial systems. With reference to the stock markets Shehzad, Xiaoxing and Kazouz (2020) find that important global market indexes (e.g., S&P 500, Nasdaq Composite Index, DAX 30, Nikkei 225) suffered extreme losses in their market values due to COVID-19 at the beginning of the pandemic when the global health care crisis resulted in a global economic and financial crisis. Moreover, for the case of the US Goel et al. (2020) find substantial return declines in equity markets as, for instance, Nasdaq Composite Index, S&P 500, and Dow Jones Industrial Average. Also Latin American stock markets greatly suffered as, for example, the Mexican IPC index lost almost 25 % (yahoo!finance, 2023a) and the Brazilian Ibovespa index about 44 % (yahoo!finance, 2023b) in the first two months of 2020.
Nevertheless, because of public stimulus packages and vaccine trial news equity markets started to recover again beginning in March-April 2020 despite the ongoing global health care crisis (Rahman et al., 2021). Likewise, Gupta, Chaudhary and Gupta (2021) find an only short-term negative impact of the COVID-19 crisis on the stock markets and a fast recovery for many international markets.
Referring to the performance of cryptocurrency markets during the COVID-19 pandemic published literature is largely centered on Bitcoin, the first few months of the pandemic in 2020 and whether or not cryptocurrencies (especially Bitcoin) present safe-haven properties during the pandemic induced market crisis, i.e., providing protection against significant losses in traditional asset markets. Conlon and McGee (2020) question with their empirical study the supposed safe-haven properties of Bitcoin. They find that during the stock market crisis of early 2020, caused by the beginning pandemic, Bitcoin did not provide shelter from turbulence in traditional markets as its market prices decreased parallel to market prices of the S&P 500 index as the crisis developed. Furthermore, the authors do not recommend a diversification of traditional assets with Bitcoin as already a small allocation to the cryptocurrency substantially increases portfolio downside risk during their studied period. Similar results obtain Conlon, Corbet and McGee (2020) with respect to an increasing portfolio downside risk when including Bitcoin and Ethereum to portfolios of traditional asset classes like stocks. Also, Chen, Liu, and Zhao (2020), Kristoufek (2020) and Taleb (2021) find evidence for the failure of Bitcoin as safe-haven asset during the pandemic.
On the other hand, analyzing daily data of various cryptocurrencies (including Bitcoin, Ethereum, BNB and XRP) for the period 09/13/2017 to 09/20/2020, Aysan, Khan and Topuz (2021) find that cryptocurrency market prices are resilient to the effects of the pandemic and, therefore, recommend to aggregate cryptocurrencies to portfolios of traditional assets. Mariana, Ekaputra and Husodo (2021) as well as Sah and Patra (2023) find that during the pandemic (after the pandemic announcement of the WHO) volatility of cryptocurrencies as Bitcoin and Ethereum rose significantly. Nevertheless, they find negative correlations between the market prices of both cryptocurrencies and the S&P 500 index and conclude that Bitcoin and Ethereum are suitable short-term safe-haven assets for traditional assets. Huang, Duan and Urquhart (2023) find that Bitcoin during the pandemic also represents an effective hedge for other investment classes like green assets. Moreover, in line with Markowitz (1952) and referring to cryptocurrency portfolios, Díaz, Esparcia, and Huélamo (2023) find that such portfolios reduce the high volatility of single cryptocurrency investments.
With respect to cryptocurrency returns during the pandemic Chen, Liu and Zhao (2020) find that negative Bitcoin returns and its high trading volume during the very beginning of the pandemic can be explained by fear sentiment regarding the coronavirus. Moreover, Goodell and Goutte (2021) analyze daily data of COVID-19 world deaths and Bitcoin market prices for the period 12/31/2019 to 04/29/2020 and find especially for the last month of their short sample that rising levels of COVID-19 deaths caused increasing Bitcoin market prices. A result that is also confirmed by Demir et al. (2020) for the beginning of the pandemic. Hence, these studies highlight the favorable performance of Bitcoin during the ongoing pandemic.
II. Methodological design
Analysis of Statistical Moments
As already mentioned, the research question of the present study is as follows: Which differences can be found in the data series of market prices of the leading cryptocurrencies Bitcoin, Ethereum, BNB and XRP before and during the COVID-19 pandemic? Hence, the research objective is to compare the market price movements of Bitcoin, Ethereum, BNB and XRP before and during the COVID-19 pandemic by analyzing statistical moments during the periods January 2019 to March 2020 and March 2020 to December 2021 and by testing for structural changes in order to prove the hypothesis that differences between the data series of market prices of the selected cryptocurrencies before and during the COVID-19 pandemic do exist.
In general, the research method of the present study can be characterized as longitudinal, exploratory and quantitative using descriptive statistics, tests for structural changes combined with stationarity tests and portfolio calculations. The methodological design uses logarithmic returns derived from daily market prices (adjusted close) of the four leading free-floating cryptocurrencies: Bitcoin, Ethereum, BNB and XRP for the period 01/01/2019 to 12/31/2021. To analyze the dataset before and during the pandemic the whole sample of a total of 1,095 observations is divided into two subsamples. The first one (434 observations) covers the period before the pandemic from 01/01/2019 until 03/10/2020 and the second subsample (661 observations) includes the period from 03/11/2020 to 12/31/2021. 03/11/2020 is chosen as the starting point of the pandemic because on this day the WHO published its declaration that COVID-19 can be characterized as a pandemic.
To statistically compare the four mentioned cryptocurrencies for the whole sample and the two chosen subsamples statistical moments, including average daily return (mean), standard deviation, coefficient of variation and maximum and minimum daily return are calculated and compared using RStudio software. To explore the bigger picture as well, besides the analysis of different cryptocurrencies, also their comparison with two traditional investment alternatives (stocks and commodities) is realized. For that reason, daily closing prices of the MSCI World Index and gold futures were obtained, converted to logarithmic returns and analyzed. Although the same period (01/01/2019 to 12/31/2021) is covered, for the analysis of the MSCI World and gold futures fewer observations are obtained as trading of stocks and commodities is generally limited to Monday to Friday and trading of cryptocurrencies is possible for all seven days of the week. Market prices for all cryptocurrencies were obtained from yahoo!finance and the ones for the two chosen traditional investment alternatives from Investing.com.
Structural Change and Stationarity
To sustain the results of the analyzed statistical moments, time series of the selected cryptocurrencies are also analyzed econometrically using tests for structural changes. For that reason, monthly market prices of Bitcoin, Ethereum, BNB and XRP between 01/2019 until 12/2021 are analyzed by the Chow test. The Chow test (according to Chow (1960)) is a suitable method to identify and analyze possibly multiple structural changes in a data series. According to Gujarati and Porter (2010) a structural change in each data series implies that the values of the parameters of a regression model do not remain constant throughout the whole period. In other words, if for a given regression the intercept as well as the slope coefficient remain the same over an entire period, there is no structural change. On the other side, a structural change exists if at some point of time the intercept and / or the slope coefficient change. Hence, in case of the existence of a structural change, the pooled (whole period) regression is of doubtful value and should rather be replaced by two new regressions covering the two subsamples before and after the structural change (structural breakpoint). Within the present study the Chow test is carried out with RStudio and follows the subsequent hypothesis:
H0: No existence of structural change - p-value > 0.05
H1: Existence of structural change - p-value < 0.05
According to Becker, Enders, and Lee (2006) improper modelling of breakpoints determined by structural changes of macroeconomic variables can result in improper results. Therefore, proper modelling using structural changes should be complemented by performing the unit root test. This test allows to examine for single breakpoints in data series and associate possibly existent stationarity to structural changes. The mentioned tests are performed by many other authors (for instance, Priestley and Rao (1969), Kurozumi, (2002), Hadri and Rao (2008) as well as Witt, Kurths and Pikovsky (1998)) To determine stationarity. In addition, stationarity can lead to a proper modelling through time series methods (Gujarati and Porter, 2010). Therefore, in the present paper stationarity is also tested, to determine whether or not structural changes occur due to stationarity on the data set.
As mentioned before, the unit root test is performed to test stationarity in the datasets. According to Gujarati and Porter (2010), the first step is to define the stochastic process shown in Equation (1).
Where Yt is the value of the dependent variable
at time
Where
Portfolio Analysis
To extend the outlined cryptocurrency analysis, additionally portfolios of the selected cryptocurrencies are built based on their historic price behavior. Portfolio theory goes back to Markowitz (1952) who showed that portfolio risk can be reduced by intelligent diversification based on the existing correlation between different portfolio assets, i.e., in general, the smaller the correlation coefficients the higher is the potential for diversification.
Therefore, using MS Excel software and considering the three selected sample periods (whole sample, Period 1 and Period 2) optimized portfolios are built and analyzed by their composition, return mean and standard deviation. The term optimized portfolios refer to the construction of minimum variance portfolios and maximum return portfolios for the three analyzed periods. The formulas to determine return mean and standard deviation of multiple asset portfolios are as follows:
Where, rp is the return of the portfolio, xi is the weight of asset i and ri is the return of asset i.
With,
III. Results
Whole Sample Results
Figures 1 and 2 show the movement of daily closing prices for the selected cryptocurrencies as well as their volatility of daily returns for the whole sample period (January 2019 to December 2021). As can be seen in Figure 1, roughly speaking for all four cryptocurrencies the first two years of the sample (2019-2020) can be characterized by a more stable price trend in comparison to 2021 which shows for the selected cryptocurrencies more volatility which translated into multiple episodes of partially astonishing price increases to new historic heights but also market price crashes. According to Figure 2, all presented cryptocurrencies show considerable volatility for the whole sample between 2019 to 2021. Nevertheless, volatility and, hence, risk appears to be stronger in the second half of the sample.
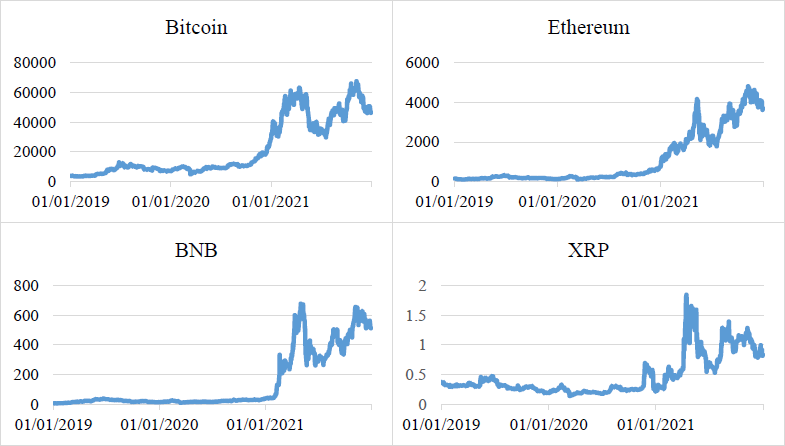
Source: Author´s own elaboration based on data obtained from yahoo!finance.
Figure 1 Market price movements of cryptocurrencies (2019-2021)
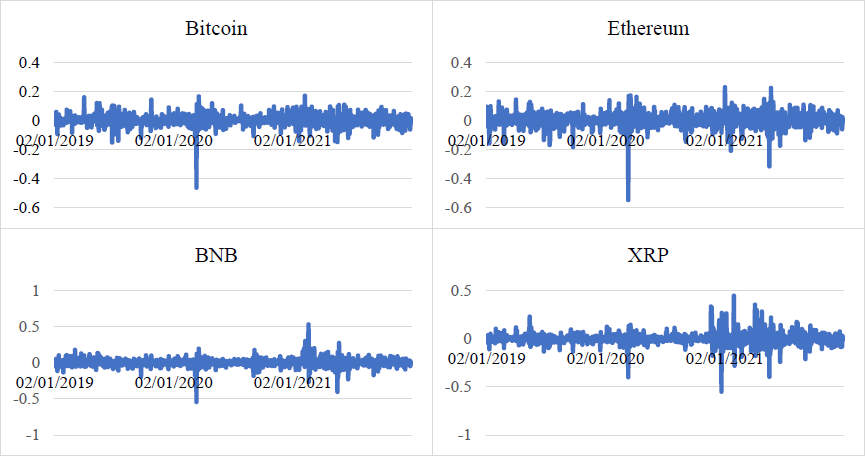
Source: Author´s own elaboration based on data obtained from yahoo!finance.
Figure 2 Volatility of daily returns of cryptocurrencies (2019-2021)
Figures 1 and 2 can also be seen from a contextual perspective by identifying major tendencies and events which moved market prices during the 3 years of the whole sample. First, for 2019 as overall tendencies which moved global cryptocurrency prices one can identify throughout the year an increased media coverage for cryptocurrencies in general which resulted in a growing familiarization and adaption of the innovative asset class. For instance, one can mention the hype in international media beginning in May 2019 caused by the announcement of Facebook´s plan to establish its own cryptocurrency (Libra). Furthermore, high growth figures of cryptocurrency derivatives trading can be identified in 2019. Another significant event at the end of October 2019 was the announcement of the Chinese government to focus its efforts on the implementation of blockchain technology (Interdax, 2019).
In 2020, naturally, the COVID-19 pandemic was the major topic. In Figures 1 and 2 one can clearly see a very significant market price drop for all selected cryptocurrencies on 03/12/2020 - one day after the WHO pandemic announcement. Nevertheless, shortly afterwards cryptocurrency prices came back to a continuous moderate growth trend which accelerated at the end of the year. The beginning pandemic resulted in a worsening of the outlook for global economies as well as for traditional financial systems and cryptocurrencies were perceived as an investment alternative which provided protection against overall negative economic tendencies. Furthermore, one major event during 2020 was the Bitcoin halving (halving of the creation rate of new Bitcoins) on 05/11/2020 which impacted in all analyzed cryptocurrencies as this kind of event usually results in the long-term in growing overall cryptocurrency prices. Moreover, another driver of cryptocurrencies during 2020 was the market-related public interest of multiple important institutions - for example, PayPal announcing in October that they would start to allow their users to buy, sell and hold cryptocurrencies through its system (SIGMA, 2021).
For all analyzed cryptocurrencies the year 2021 is marked by high volatility and astonishing price rallies resulting in new historic heights, but also significant crashes. Apparently, mainstream interest in and adaption of cryptocurrencies rose again significantly during 2021. Major events that triggered price movements were Elon Musk´s announcement to accept Bitcoin payment for Tesla products in March 2021, PayPal´s announcement of collaboration with Coinbase (one of the world´s biggest cryptocurrency exchange platforms) in April 2021 and Mastercard´s launch of its Crypto Card Program (crypto-backed payment cards) also in April 2021. On the other side, causing downside pressure on prices, major countries - for example, the USA and China - took important steps to regulate and control cryptocurrencies what resulted in the case of China in a complete ban on all cryptocurrency trading and mining activity in September 2021 (The Crypto Times, 2022).
Table 2 presents statistical moments for the whole sample period. As can be seen, all four cryptocurrencies present a positive mean return during the whole sample. With 0.0040 BNB shows the highest average return and with 0.0008 XRP the lowest. Risk, measured by the standard deviation of daily returns, is highest for XRP (0.0608) and lowest for Bitcoin (0.0392). The coefficient of variation as a simple performance measure, i.e., an indicator which characterizes the risk-return profile of an asset, is the lowest and, therefore, most favorable for BNB (14.10). Hence, during the sample BNB investors had to accept 14.10 units of risk To obtain 1 unit of return. The least favorable risk-return profile is offered by XRP (80.83).
Table 2 Statistical moments of cryptocurrencies (whole sample 2019-2021)
| Bitcoin | Ethereum | BNB | XRP | |
| Mean | 0.0023 | 0.0030 | 0.0040 | 0.0008 |
| Standard deviation | 0.0392 | 0.0504 | 0.0571 | 0.0608 |
| Coefficient of variation | 17.2642 | 16.8948 | 14.1043 | 80.8271 |
| Maximum daily return | 0.1718 | 0.2307 | 0.5292 | 0.4448 |
| Minimum daily return | -0.4647 | -0.5507 | -0.5431 | -0.5505 |
Source: Author´s own elaboration.
The highest maximum daily return during the analyzed years was reached by BNB (52.92 %) and the lowest by Bitcoin (17.18 %.) On the other hand, the cryptocurrencies also show extreme downside potential as the highest negative daily return was obtained by Ethereum (- 55.07 %) and the lowest minimum daily return by Bitcoin (- 46.47 %).
In summary, BNB can be characterized as the most attractive asset (highest mean return, third highest standard deviation, lowest coefficient of variation) and XRP as the least favorable one (lowest mean return, highest standard deviation, and highest coefficient of variation). As outlined in the present section and as seen in Figures 1 and 2, it appears that the return behavior of all selected cryptocurrencies changed importantly in the second half of the sample in comparison to the first half. In the following section this will be analyzed further considering the announcement of the global pandemic by the WHO on 03/11/2020 as the event which divides the whole sample period into two subsamples.
Comparison of Pre and Post COVID Results
Table 3 shows statistical moments of the four selected cryptocurrencies for the two subsamples Period 1 (01/01/2019 - 03/10/2020) and Period 2 (03/11/2020 - 12/31/2021).
Table 3 Statistical moments of cryptocurrencies by subsample
| Subsample Period 1 (01/01/2019-03/10/2020) | ||||
| Bitcoin | Ethereum | BNB | XRP | |
| Mean | 0.0017 | 0.0008 | 0.0024 | -0.0012 |
| Standard deviation | 0.0343 | 0.0420 | 0.0432 | 0.0374 |
| Coefficient of variation | 20.6432 | 51.4441 | 18.3449 | -29.9734 |
| Maximum daily return | 0.1600 | 0.1450 | 0.1792 | 0.2286 |
| Minimum daily return | -0.1518 | -0.1833 | -0.1929 | -0.1361 |
| | ||||
| Subsample Period 2 (03/11/2020-12/31/2021) | ||||
| Bitcoin | Ethereum | BNB | XRP | |
| Mean | 0.0027 | 0.0044 | 0.0052 | 0.0021 |
| Standard deviation | 0.0422 | 0.0551 | 0.0646 | 0.0721 |
| Coefficient of variation | 15.7759 | 12.5254 | 12.5241 | 34.9277 |
| Maximum daily return | 0.1718 | 0.2307 | 0.5292 | 0.4448 |
| Minimum daily return | -0.4647 | -0.5507 | -0.5431 | -0.5505 |
Source: Author´s own elaboration.
Summarizing and comparing the two selected subsamples (Period 1 and Period 2) one can clearly find important differences for all statistical moments. Although risk (standard deviation) is much higher for all cryptocurrencies in Period 2 compared to Period 1, average daily returns are much higher as well, resulting in significantly more favorable coefficients of variation in Period 2 than in Period 1 for all analyzed assets. Finally, maximum, and minimum daily returns for all currencies are more extreme in Period 2 than in Period 1.
As can be seen, in Period 1 BNB is the dominant single asset (highest mean return, lowest coefficient of variation besides highest standard deviation) and XRP presents the least favorable characteristics (lowest mean return, second highest risk, least favorable coefficient of variation). In Period 2, again, BNB can be characterized as the best asset (highest mean, third highest risk, lowest coefficient of variation) and XRP as the worst one (lowest mean, highest risk, highest coefficient of variation).
Comparison with MSCI World and Gold
To gain a broader general perspective on the analyzed topic, the present section aims to compare the obtained results for cryptocurrencies with two traditional investment alternatives. As already mentioned, the two selected alternatives are stocks (represented by the MSCI World Index as a global stock index in comparison to the globally traded cryptocurrencies) and commodities (represented by gold futures). Table 4 presents the results for the three samples.
Table 4 Statistical moments of traditional investment alternatives
| Whole Sample Period (01/01/2019-12/31/2021) | ||
| MSCI World | Gold | |
| Mean | 0.0007 | 0.0004 |
| Standard deviation | 0.0118 | 0.0118 |
| Coefficient of variation | 17.1837 | 26.4191 |
| Maximum daily return | 0.0841 | 0.0563 |
| Minimum daily return | -0.1044 | -0.0507 |
| | ||
| Subsample Period 1 (01/01/2019-03/10/2020) | ||
| MSCI World | Gold | |
| Mean | 0.0003 | 0.0008 |
| Standard deviation | 0.0089 | 0.0120 |
| Coefficient of variation | 32.3466 | 15.9511 |
| Maximum daily return | 0.0327 | 0.0544 |
| Minimum daily return | -0.0744 | -0.0502 |
| | ||
| Subsample Period 2 (03/11/2020-12/31/2021) | ||
| MSCI World | Gold | |
| Mean | 0.0010 | 0.0003 |
| Standard deviation | 0.0134 | 0.0117 |
| Coefficient of variation | 13.9778 | 46.4551 |
| Maximum daily return | 0.0841 | 0.0563 |
| Minimum daily return | -0.1044 | -0.0507 |
Source: Author´s own elaboration.
Relating the whole sample results of Table 4 with the whole sample results of the selected cryptocurrencies one can find a higher average return and higher risk for all currencies compared to both - stock index and gold futures. Furthermore, coefficients of variation of Ethereum and BNB are below the coefficients of MSCI World and gold. Bitcoin shows a whole sample coefficient of variation better than gold and on the same level as the stock index. The respective coefficients of XRP lie above the levels of the MSCI World and gold. With respect to maximum and minimum daily returns, all analyzed cryptocurrencies present more extreme values than the traditional assets (same applies for subsamples Period 1 and 2).
With reference to subsample Period 1, average returns of all cryptocurrencies (except XRP) are higher than the average returns of MSCI World and gold. Once again, risk for all currencies is higher compared to the traditional assets. Coefficients of variation of Bitcoin and BNB are above gold level but underneath the MSCI World level. Coefficients of Ethereum and XRP are less favorable than the ones of the traditional assets. During the pandemic (subsample Period 2) mean returns and standard deviations of all selected cryptocurrencies lie above the values of their traditional asset peers. Moreover, every cryptocurrency presents a better coefficient of variation than gold futures. The coefficients of variation of Ethereum and BNB are even lower than the one of the MSCI World.
Test for Structural Changes and Stationarity in Cryptocurrency Price Data
Table 5 presents the highly significant results of the Chow test carried out for all selected cryptocurrencies based on monthly market price data for the period 01/2019 to 12/2021.
Table 5 Chow test results
| Bitcoin | Ethereum | BNB | XRP | |
| sup. F | 237.19 | 196.08 | 239.98 | 122.26 |
| p-value | < 2.2e-16 | < 2.2e-16 | < 2.2e-16 | < 2.2e-16 |
| number of structural changes | 2 | 3 | 2 | 1 |
| breakpoints | 08/20; 01/21 | 09/20; 02/21; 07/21 | 01/21; 07/21 | 03/21 |
Source: Author´s own elaboration.
As can be seen, for all analyzed cryptocurrencies the null hypothesis can be rejected as the p-value lies far below 0.05. Hence, the alternative hypothesis is accepted. In other words, there can be identified structural changes, in the form of significant or violent changes of the behavior of market prices, within the time series of all cryptocurrencies. For the case of Bitcoin, there exist 2 structural breakpoints during the months 08/2020 and 01/2021. Market prices of Ethereum present 3 structural changes (09/2020, 02/2021 and 07/2021) and BNB 2 breakpoints (01/2021 and 07/2021). Finally, XRP demonstrates one structural change in 03/2021. Hence, all structural breakpoints can be found in the Period 2 dataset.
The results from the Dickey-Fuller test performed to find stationarity in the datasets by assuming Equation (2) are shown in Table 6. Monthly market prices are non-stationary for the assets Bitcoin, Ethereum, XRP and stationary for BNB. Table 6 also shows the p-value associated with this test which is higher than
Table 6 Stationarity test results
| Bitcoin | Ethereum | BNB | XRP | |
| observed value of the statistic | -1.64 | -1.65 | -6.72 | -0.77 |
| p-value associated | 0.46 | 0.46 | <0.001 | 0.83 |
Source: Author´s own elaboration.
Comparing the results of Table 6 with those of Table 5, one can see that the identified structural changes in all cryptocurrencies are not because of stationarity in the datasets, except for BNB. Hence, BNB prices can be modelled by using time series models as structural changes and stationarity were found.
Portfolio Considerations
To determine optimal portfolio combinations of the selected cryptocurrencies to complement the analysis of the present study, Table 7 presents the matrix of correlation coefficients considering daily cryptocurrency returns for the whole sample as well as the two subsample periods.
Table 7 Correlation of cryptocurrency returns
| Whole Sample Period (01/01/2019 - 12/31/2021) | ||||
| BTC | Ethereum | BNB | XRP | |
| BTC | 1 | |||
| Ethereum | 0.8183 | 1 | ||
| BNB | 0.6611 | 0.7019 | 1 | |
| XRP | 0.5884 | 0.6446 | 0.5513 | 1 |
| Subsample Period 1 (01/01/2019 - 03/10/2020) | ||||
| BTC | Ethereum | BNB | XRP | |
| BTC | 1 | |||
| Ethereum | 0.8237 | 1 | ||
| BNB | 0.6067 | 0.6751 | 1 | |
| XRP | 0.7124 | 0.8225 | 0.5760 | 1 |
| Subsample Period 2 (03/11/2020 - 12/31/2021) | ||||
| BTC | Ethereum | BNB | XRP | |
| BTC | 1 | |||
| Ethereum | 0.8167 | 1 | ||
| BNB | 0.6838 | 0.7121 | 1 | |
| XRP | 0.5671 | 0.6080 | 0.5486 | 1 |
Source: Author´s own elaboration.
One can see that correlation coefficients are not constant over time but depend on market conditions. However, correlations are rather strongly positive. Hence, diversification potential is quite limited. The only moderately positive coefficients (below 0.6) can be found for XRP´s correlation mainly referring to the whole sample period and Period 2 as well as its pairing with BTC and BNB.
Table 8 lists the optimal risk portfolios (minimum variance portfolios, MVP) and their risk-return characteristics for the three analyzed sample periods. As can be seen, BTC is the dominant asset in every minimum risk cryptocurrency portfolio which is no surprise as in every sample period BTC resulted to be the cryptocurrency with the least overall risk. Ethereum is not considered in any MVP. Moreover, BNB is very much underweighted within the optimal risk portfolios (marginal part in whole sample, minor part in Period 1 and not included in Period 2) due to its relatively high risk in every sample period. Finally, XRP, despite of its relatively high risk, is considered in every MVP (marginal parts in whole sample and Period 2, important weight in Period 1) what emphasizes its apparent higher diversification potential in comparison to BNB and Ethereum. Focusing on the standard deviation as the primary characteristic for a MVP, the lowest risk is obtained for the Period 1 MVP (0.0325). Comparing the MVPs of Period 1 and 2, one can find a significant difference in their composition, i.e., the Period 1 portfolio is much more equilibrated combining important weights of BTC, XRP and BNB in comparison to the Period 2 portfolio which is centered on BTC with a marginal part of XRP. Moreover, in the same way as every single currency investment, the Period 2 MVP offers a higher mean return at a greater risk in comparison to the Period 1 MVP.
Table 8 Minium variance portfolios of cryptocurrencies
| Whole Sample Period (01/01/2019 - 12/31/2021) | |||||
| MVP | BTC | Ethereum | BNB | XRP | |
| Composition | 93% | 0% | 2% | 5% | |
| Mean | 0.0022 | ||||
| Standard deviation | 0.0391 | ||||
| Subsample Period 1 (01/01/2019 - 03/10/2020) | |||||
| MVP | BTC | Ethereum | BNB | XRP | |
| Composition | 55% | 0% | 16% | 29% | |
| Mean | 0.0009 | ||||
| Standard deviation | 0.0325 | ||||
| Subsample Period 2 (03/11/2020 - 12/31/2021) | |||||
| MVP | BTC | Ethereum | BNB | XRP | |
| Composition | 98% | 0% | 0% | 2% | |
| Mean | 0.0027 | ||||
| Standard deviation | 0.0421 | ||||
Source: Author´s own elaboration.
In general, one can identify a certain level of importance of diversification using portfolios of cryptocurrencies instead of single asset investments as the quantified risk for every MVP is slightly below the risk of the minimum risk alternative for every sample period (BTC). In other words, considering the minimization of investment risk, for every sample period an investment in the MVP results slightly more favorable than a single asset investment in BTC alone. However, risk reduction via portfolio diversification appears to be limited as a natural consequence of high correlations between different cryptocurrency assets. Additionally, it should be stated that in comparison to the two presented traditional investment alternatives (MSCI and gold) the cryptocurrency MVPs offer a higher return, but also on a still (much) higher risk in every sample period.
It is worth mentioning that numerical results of maximum return portfolios (MRP) are not outlined in Table 8 as, naturally, the optimization process results in portfolios which represent a 100 % investment in the highest return asset for every sample period. Hence, every MRP represents a 100 % investment in BNB and replicates its risk-return characteristics which were already presented at the beginning of the results section of this paper.
Discussion of Results
The results outlined in the previous sections show some interesting aspects. First, comparing the different cryptocurrencies in all sample periods, on the one hand, BNB presents the highest mean return and the most favorable risk-return profile measured by the coefficient of variation. On the other hand, XRP presents over all samples the least favorable characteristics. Bitcoin´s historic market prices offer the smallest risk measured by the standard deviation of returns in the three analyzed periods. Hence, for a cryptocurrency investor, who had been willing to accept a higher risk to obtain a higher return, BNB clearly would have been the most favorable asset. For a rather risk-averse investor of cryptocurrencies, Bitcoin would have been the best single option of the four analyzed currencies.
Nevertheless, risk measures of Bitcoin as well as of the other cryptocurrencies cannot be compared to traditional assets risks. In this aspect, the MSCI World Index as well as gold futures clearly imply a much lower total risk than cryptocurrencies for all analyzed samples and, hence, seem to be the more adequate investment alternative for generally risk-averse investors. Therefore, in line with, for example, Cheah and Fry (2015), Demmler and Fernández (2022) and Moosa (2020) and based on their standard deviations as well as their wide range between minimum and maximum daily returns, cryptocurrencies undoubtedly should be interpreted as high-risk and speculative assets. Also, Schilling and Uhlig (2019) highlight significant price fluctuations as a characteristic of cryptocurrencies in general what is in line with our results. However, especially true for Bitcoin, BNB and Ethereum, their performance measured by the risk-return profile, is convincing throughout all the analyzed samples in comparison to the two traditional assets. Thus, in line with Aysan, Khan and Topuz (2021) cryptocurrencies in general could be an interesting allocation alternative to consider in portfolios of traditional assets during different market phases.
Surprisingly, during the pandemic and, hence, in a market phase characterized by trends of economic and financial crisis as well as high uncertainty levels, Bitcoin, BNB and Ethereum presented an even better performance than gold which is generally one of the most accepted safe-haven assets during periods of market turmoil. For sure, gold futures presented the lowest risk during the pandemic subsample period, but also the least favorable coefficient of variation of all analyzed assets during the pandemic. Consequently, our results confirm the opinion of Samson (2020) that some cryptocurrencies, as for example Bitcoin, might represent a suitable alternative to gold.
Comparing a little bit more into detail the two different subsamples (Period 1 and Period 2) one can identify for all analyzed assets (except gold) higher mean returns, higher risk measures and more favorable risk-return profiles for the pandemic subsample in comparison to the sample which covered the period before the pandemic. Speaking especially for the analyzed cryptocurrencies, their return behavior changed drastically in Period 2 in comparison to Period 1. However, this change did not appear immediately with the beginning of the pandemic announced by the WHO in March 2020. All cryptocurrencies struggled in their returns during the weeks around the beginning of the pandemic but returned to their relatively stable growth trends soon afterwards - a similar result to the studies of Rahman et al. (2021) and Gupta, Chaudhary and Gupta (2021) for the international stock markets. Then, beginning in the second half of 2020 (Ethereum and Bitcoin) and early 2021 (BNB and XRP) return behaviors changed significantly characterized by much higher prices, higher volatility measures (in line with Mariana, Ekaputra and Husodo (2021) and Sah and Patra (2023)) and in general a better performance in comparison to the pre-COVID sample.
To some extent the identified similar return behaviors of the analyzed cryptocurrencies throughout the sample periods might be an indication of contagion effects from one cryptocurrency to another (possibly lead by Bitcoin as the most important cryptocurrency) identified by Bouri, Shahzad and Roubaud (2019). Though, to be honest, the methodological design of the present study did not include statistical tests to identify potential contagious behaviors. Furthermore, as was already mentioned, for all analyzed cryptocurrencies especially the year 2021 is marked by high volatility and astonishing price rallies, which resulted in new historic heights, but also significant crashes of market prices. This could be an indicator of potentially existing continuous financial bubble tendencies in line with the results of, for example, Mnif et al. (2022), Montasser, Charfeddine and Benhamed (2022), Moosa (2020) as well as Shu, Song and Zhu (2021). Nevertheless, it should be mentioned that the present study did not focus on the detection of financial bubbles in cryptocurrency markets.
The result of significantly different return behaviors of the analyzed cryptocurrencies in Period 2 in comparison to Period 1 is confirmed by the Chow test results based on monthly market price data. For none of the cryptocurrencies a structural breakpoint was detected during Period 1. The identified multiple structural changes can all be date stamped during the pandemic subsample. Nevertheless, these breakpoints seem not to be directly and immediately related to the pandemic announcement of the WHO on 03/11/2020. As can be seen as well in the results of the Chow test, structural changes initiated first within Bitcoin and Ethereum market prices during the second half of 2020 and later for BNB and XRP (start of 2021). As a complement to the Chow test, stationarity tests were performed with the result that monthly market prices of all cryptocurrencies, except BNB, do not show stationarity.
Hence, it can be concluded that the results of the impact of the pandemic on the price behavior of the selected cryptocurrencies are two-folded. On the one side, there is a clear negative short-term effect of the pandemic announcement on market prices as all the studied cryptocurrencies showed a highly negative return on 03/12/2020 - one day after the WHO announcement. Moreover, during the weeks around the start of the pandemic all cryptocurrencies rather struggled in their return behavior. One the other side, nevertheless, no negative medium- to long-term effect of the pandemic can be found in the data sample. Return behavior did change - but relatively long after the pandemic announcement and it changed somewhat for the better and not for the worse. Consequently, the present study of the cryptocurrency market between 2019 and 2021 confirms the results of Aysan, Khan and Topuz (2021) who find that the cryptocurrency market is resilient to the effects of the pandemic and Demir et al. (2020) who highlight the favorable performance of Bitcoin and cryptocurrencies in general during the first episode of the pandemic.
To complement the outlined analysis of single cryptocurrency investments, the present study also considers the design of optimized portfolios of the selected cryptocurrencies. In general, diversification potential appears to be quite limited for portfolios which use cryptocurrencies alone, due to high correlation coefficients between the participating currencies. Nevertheless, and in line with Díaz, Esparcia, and Huélamo (2023), minimum variance portfolios of all analyzed periods offer a marginally lower risk than single investments in BTC alone - what could be of interest for generally risk-averse investors who despite their risk preference consider investments in cryptocurrencies.
Concluding remarks
The present study questioned about the existence of differences in the behavior of market prices of the leading cryptocurrencies Bitcoin, Ethereum, BNB and XRP before and during the COVID-19 pandemic. To answer the research question, a longitudinal, exploratory and quantitative research design was chosen based on the analysis of statistical moments of the logarithmic daily returns of the selected four cryptocurrencies for the whole sample period (01/01/2019 - 12/31/2021). Furthermore, based on the announcement of the WHO on 03/11/2020 of a global pandemic, the whole sample period was divided into two subsamples - Period 1 before the pandemic (01/01/2019 - 03/10/2020) and Period 2 during the pandemic (03/11/2020 - 12/31/2021). Moreover, to support the analysis of statistical moments, tests for structural changes within cryptocurrency´s market prices were carried out using the Chow test combined with tests of stationarity. Finally, the present study also contains considerations with respect to the diversification potential of optimized cryptocurrency portfolios.
Results show a clearly negative and short-term impact of the pandemic on cryptocurrency prices on the day after the announcement by the WHO and during the weeks around the start of the pandemic. Nevertheless, the medium- to long-term return behavior of all analyzed cryptocurrencies did not change immediately with the start of the pandemic, but later (second half of 2020 and beginning of 2021). Furthermore, return behaviors rather improved for the pandemic subsample in comparison to the pre-pandemic subsample. Interestingly, in general cryptocurrencies (especially, Bitcoin, BNB and Ethereum) also convince in comparison to traditional investment alternatives (stocks, gold futures) as they present comparable or even better results especially for the whole sample and subsample Period 2 for key aspects as mean return and risk-return profile. The results of the Chow test confirm the results of the descriptive analysis of statistical moments as multiple structural breakpoints can be identified within the data series of the selected cryptocurrencies. The identified structural changes took place during Period 2, but not immediately after the pandemic announcement of the WHO. Consequently, the underlying hypothesis of the present study of existing differences between the data series of market prices of the leading cryptocurrencies Bitcoin, Ethereum, BNB and XRP before and during the COVID-19 pandemic can be confirmed. With respect to the design of optimized minimum variance portfolios of cryptocurrencies, the present study confirms the existent, but marginal, diversification potential of cryptocurrency portfolios in comparison to single cryptocurrency investments.
The present study offers a broad and useful exploratory picture of the performance of leading cryptocurrencies before and during the ongoing pandemic of COVID-19. Necessary future research studies could expand on the number of analyzed cryptocurrencies, on different traditional assets to be included and / or on the statistical methods used throughout the analysis. Besides, methods could be used which transform a non-stationary data set into a stationary one. Moreover, future studies could extend the analysis of portfolios of cryptocurrencies and traditional assets and their dependence on different market phases.

