


 nueva página del texto (beta)
 Inglés (pdf)
 Artículo en XML
 Referencias del artículo
 Enviar artículo por email
 Citado por SciELO
  Similares en
SciELO
Similares en
SciELO 
 Permalink
Introduction
There is an extensive study of the Treynor-Black model in the literature. Some recent examples are the study of the behavior of the model under different market scenarios. Pannu (2021) contrasts the Treynor-Black model in bear and bull markets, obtaining better performances against naive portfolios. Another example, Srinivas & Shivaraj (2021) study the performance of the model with different measurement methods. This paper seeks to improve asset allocation using the Treynor-Black model, comparing results using robust regression vs. linear regression for long-term portfolios. Robust regression would be expected to improve the calculation of alpha, and hence performance. In this way, we seek to improve performance in this type of investments. Portfolio construction can be summarized in two steps 1) asset selection, and 2) asset allocation, the central theme of the paper. To exclude point 1 from the equation, the paper is limited to the Dow Jones Industrial Average index components (stocks) over the period 2000-2020. The use of different performance measures is out of scope, since the Treynor-Black model uses appraisal, see Amenc and Le Sourd (2003) for other options. Another limitation is the use of different factors, here we study the market (DJIA) and the 5 factors of Fama & French (2015), for the creation of other factors see Ladrón de Guevara & Torra, 2014. In addition, only contrast robust regression and linear regression.
As mentioned by Rousseeuw & Hubert (2018) "Real
data often contain outliers, also known as outliers. These can spoil the resulting
analysis, but they can also contain valuable information." Our motivation is to
find out whether the information contained in the prices of the DJIA components is
relevant or not relevant for portfolios using the Treynor-Black model in one-year
investments to improve the performances of these portfolios. Linear regression
models, when the errors have heavy tails, the distribution of these errors is not
normal, so it does not meet this model specification. These outliers are removed
because they can change the estimates of their coefficients. Robust regression uses
a criterion to fit these observations to meet the linear model specification. See
Figure 1 for the visual difference between
these two models, which results in different levels of alpha (

In the CAPM model the alpha is the performance of portfolio i. Alpha is that which is not related to the risk premium, measured by beta. The higher the alpha, the better the performance compared to portfolios with similar risks, so we explain below how to adjust for this risk using appraisal. It is obtained from the linear relationship of the asset risk premiums with the market risk premiums. In our study the market is the Dow Jones Industrial Average (DJIA). One of the criticisms of this model is that portfolio performance can be explained by several factors. Fama & French (2015) propose five factors to explain its behavior (limitation of the study). Samaniego (2022) simulate portfolios formed by the components of the DJIA between 2000-2020, weighting them with their appraisal (Treynor & Black, 1973), whose calculation basis is the alpha. They found that the DJIA as the market in the CAPM model was better than the combination of the five factors proposed by Fama & French (2015). See Table 1, where the portfolios formed with this methodology outperformed the DJIA by 66.9% in the period analyzed.
Table 1 Probability of outperforming the DJIA with different factor models: 2000-2020
| Alpha source | DJIA average annual return |
Portfolio average annual return |
Probability of outperforming the DJIA |
| CAPM (DJIA as the market) | 6.3% | 6.9% | 58.0% |
| CAPM (DJIA as the market, R^2 |
7.8% | 13.8% | 66.9% |
| F&F (1 factor model) | 6.2% | 5.9% | 56.6% |
| F&F (2 factor model) | 6.2% | 5.9% | 56.9% |
| F&F (3 factor model) | 6.2% | 5.9% | 56.9% |
| F&F (4 factor model) | 6.2% | 5.9% | 56.8% |
| F&F (5 factor model) | 6.2% | 5.9% | 56.7% |
Source: Samaniego (2022).
Note: 5134 observations in each method.
The objective of this work is to improve the performance of the Treynor-Black model for one-year investments. To achieve this, this paper is limited to the study of the best regression model between two options: ordinary least squares regression and robust regression. These models impact the calculation of alpha used in the Treynor-Black model. The better the estimation, the better the performance of the one-year portfolios would be expected. Unlike Samaniego (2022), where the Treynor-Black model is contrasted over time, in this paper, using the same study period, two models for the calculation of alpha are studied for the selection of the best method to maximize performance. Considering the limitations of the study mentioned above.
There are several studies in different disciplines where robust regression is used (Yu & Yao, 2017; Farcomeni & Ventura, 2012; Erceg-Hurn & Mirosevich, 2008; Klein, 2020). And we can also find applications in the literature in the context of this study, the evaluation of investment portfolios (Cuthbertson et al., 2010). That unlike this study they looked at returns rather than performance. They found that for UK and US equity mutual funds, the performance of winning funds is followed by winning returns, and the same is true for losing funds. They predict losing returns. The above with frequencies of less than one year. In our study we will keep investment periods of one year. The study is divided into three parts: methodology, results, and conclusions.
Besides this introduction the document is divided into two sections. The first section mentions the research methodology. The second section mentions the results obtained and finally, the conclusions are presented and gives future lines of research.
Methodology
The research methodology does not seek to make new proposals to the methodologies used in the literature, the objective is to make empirical contrast between two regression methods that help to improve the performance of one-year portfolios that use the Treynor-Black method to assemble their portfolios (main contribution). To test the best regression model in the estimation of the CAPM-alpha as an estimator of future performance. The Treynor-Black (1973) methodology is used in its active portfolio part and uses appraisal as measure of performance. This methodology proposes to divide the portfolio in two: active portfolio and portfolio indexed to a reference index. Only the active portfolio is used. Its calculation depends on the appraisal which is related to alpha. If this alpha were a good estimator of future performance, better returns would be expected compared to the benchmark index, DJIA. Portfolios are assembled between 2000-2020 taking as a reference the components of the DJIA in history. The Treynor-Black (1973) methodology selects and weights these assets through equation 2 and 3. In equation 2 the appraisal is calculated, which is the ratio of the abnormal return (or performance) of the asset, expected to be positive. In the case of being zero, it indicates a performance like its benchmark (in this study it is the DJIA). It is divided by the variance of the residuals of the regression, indicating the asset-specific risk or risk assumed to obtain the alpha. For example, if a portfolio is indexed to its benchmark, its alpha and specific risk are expected to be zero. The higher the appraisal, the better the performance. Using ordinary least squares regression and robust regression, alpha is calculated, and portfolios are simulated every day with an investment period of one year. 5134 portfolios are simulated, and 154020 (5134 x 30) alphas are calculated with each of the regression methods to be tested. The real data were taken from FactSet of 57 assets contained in the DJIA in the study period (see Appendix, Table 5).
Equation 2 shows the calculation of the proportion to invest in each asset. The divisor is the sum of the appraisals of the assets contained in the portfolio. And the dividend is the appraisal of the asset. In this way, performance is adjusted to the risk assumed. For further details see Amenc and Le Sourd (2003).
Not all observations will have positive alphas, which indicate a certain level of investment. If the investment grade is in few assets, it would represent higher risk. Likewise, when investing in several assets and weighting a single asset with the largest share of investment, it also represents a higher risk. The better the performance, the more the asset will be weighted.
Woerheide & Persson (1992) are used to measure the degree of diversification. The higher the degree of diversification, the better (equation 4). This equation does not consider correlations, which the Treynor-Black model does not either, its limitation would be to weight correlated assets. What it does consider is the amount of assets contained in a portfolio and the investment percentage, it would be expected that portfolios with few assets or portfolios where more weighting is given to few assets would have a low DI. Where it is obtained with equation 3.
The following section explains the simulation results of the 5134 portfolios, excluding the non-investment periods. See Figure 2 for the entire process in the simulations. FactSet is used to obtain the data and its processing is performed in Matlab.

Results
For the same investment period (one year) and the same study period (2000-2020), Figure 3 compares the annual returns of the simulations for each regression method.
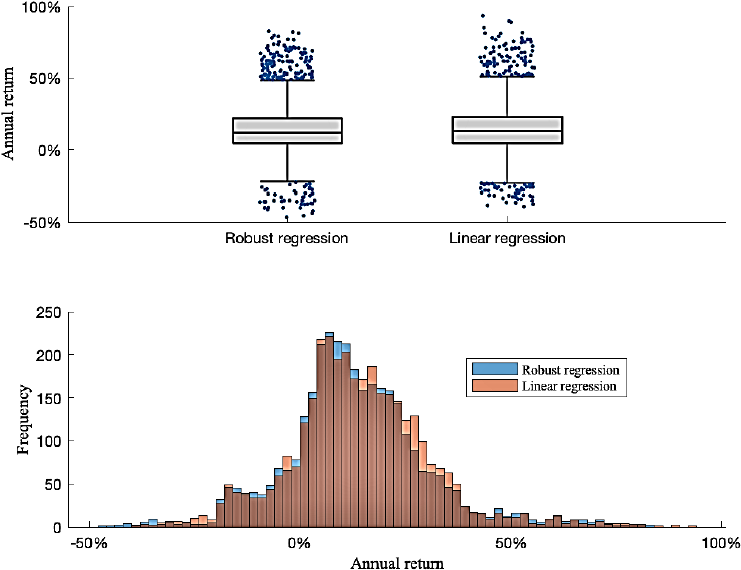
Source: own elaboration and data from FactSet.
Figure 3 Treynor-Black active portfolios annual returns: DJIA components, 2000-2020
Since the Treynor-Black model only weights assets with positive alpha, there are non-investment periods for both methods. This will be taken as part of the investment strategy where sometimes are not invested and will be taken as zero return. To compare each strategy or regression method with the DJIA, only the observations where there is investment will be taken. The average returns of the benchmark index (DJIA) are different, 7.8% and 7.9% (OLS and robust regression, see Table 2) which is lower than the return obtained with Treynor-Black (13.8% and 13.3%). We deduce that both methods outperform the DJIA in the study period but the volatility for both methods is higher than that obtained in one-year DJIA investments. A comparison of the two regression methods is made later in this section.
Table 2 CAPM-alpha source: robust regression vs. linear regression.
| Alpha source | DJIA average annual return |
Treynor-Black average annual return |
DJIA volatility | Treynor-Black volatility |
Probability of outperforming the DJIA |
| Linear regression (OLS) | 7.8% | 13.8% | 15.3% | 16.8% | 66.9% |
| Robust regression | 7.9% | 13.3% | 15.2% | 17.0% | 66.8% |
Source: own elaboration and data from FactSet.
Note: accepted alpha has R^2
As in Samaniego (2022), only regression models are used with R^2
Table 3 Probability of outperforming the DJIA vs. each stock.
| Alpha source | Probability of outperforming the DJIA |
Probability of returns greater than zero |
observations | Alpha>0 |
| Linear regression (OLS) | 55.7% | 72.5% | 15 137 | 9.8% |
| Robust regression | 55.4% | 72.1% | 15 565 | 10.1% |
Source: own elaboration.
Note: R^2
Table 4 calculates the appraisal (Equation 2) using the annual yields in the simulation (Figure 3). Where the OLS methodology is slightly superior to using robust regression, the appraisal is calculated as follows.
Table 4 Performance (appraisal)
| Estimate | Standard error | T-statistic | P-value | Appraisal | |
| Linear regression (R-squared 0.496) | 5.471 | ||||
| Alpha | 0.078 | 0.002 | 34.045 | 0.000 | |
| Beta | 0.773 | 0.013 | 58.104 | 0.000 | |
| Robust regression (R-squared 0.534) | 5.047 | ||||
| Alpha | 0.068 | 0.002 | 30.194 | 0.000 | |
| Beta | 0.817 | 0.013 | 62.121 | 0.000 | |
Source: own elaboration.
The distributions of the CAPM-alpha, appraisal, and diversification index (equation 4) are very similar for both methods (see Figure 4). Presenting the same problem in relation to diversification. There are many observations where the portfolio has a DI<0.1, because it only invests in a single asset. Of the 30 regressions performed on each observation, it finds only one asset with alpha>0, R^2

Conclusion
In the study period both regression methods outperform the DJIA, with risk premia around 6%. This with a small increase in volatility below 2%. So, managers or investors where the investment period is one year and they seek to outperform the DJIA, could use both methods to weight the selected assets in the portfolio. Seeking to amplify these risk premia, the paper compared two regression models: the OLS model and the robust regression. The OLS model was superior to robust regression measured by appraisal performance, as does the Treynor-Black model. Having an alpha differential of 1% and an appraisal differential of 0.4. The probabilities of having positive returns in the 5 134 observations, both for the DJIA, Treynor-Black with OLS and Treynor-Black with robust regression is similar at around 72%. Thus, the regression methods increase the risk premium and do not increase the probability of having returns greater than zero. Analyzing the diversification coefficient, we observe periods where the DI is 0.1, which indicates one of two options, in those investment periods the Treynor-Black model (independent of the regression method): 1) contains few assets, 2) mostly few assets are weighted. This is because the model found few assets in which to invest (positive alpha) or the appraisal spread on few assets is very high. It leads us to conclude, to put the model into practice it needs to analyze more assets than the 30 components of the DJIA. Several studies can be derived from the paper, for example, to study indices with components greater than 30, to look for factors that better explain performance or to use other linear or non-linear regression models.

