


 nova página do texto(beta)
 Inglês (pdf)
 Artigo em XML
 Referências do artigo
 Enviar este artigo por email
 Citado por SciELO
  Similares em
SciELO
Similares em
SciELO 
 Permalink
Introduction
There is a growing body of literature that recognizes the importance of micro-firms for a country’s development because these firms represent most of the business activity and employ more workers than any other kind of firm. This is especially true for developing countries, where micro-firms can be seen as an alternative to the formal wage sector. Low wages and high unemployment levels are common characteristics of developing countries; at the same time, there may also be an expression of the entrepreneurial capacity of the society. In fact, the characteristics of micro-firms are instrumental to understanding their performance.
Micro-firms have been often considered unproductive and as having undesirable characteristics, such as being too small and unlikely to grow sufficiently to be productive, as they are normally run by uneducated people and have a short life expectancy (La Porta and Shleifer 2014). In fact, in most developing countries, micro-firms are associated with informal activities such as street selling and poor-quality products (Loayza et al., 2009; Masatlioglu and Rigolini, 2008).
Although micro-firm performance has been studied before, most research in this area has not dealt with the differentiation between formal and informal micro-firms, with most studies focusing on bigger firms and labour market issues. The differentiation between formal and informal micro-firms is applied here to analyze the characteristics of each group, to test whether they exhibit different performance in terms of output and efficiency, and to explain why.
The main aims of this study are to characterize formal and informal micro-firms, to visualize the differences between them, and to explain the reasons behind these differences. Another novel aspect of this research is the use of the Oaxaca-Blinder decomposition method (Oaxaca 1973; Blinder 1973) to explain the output and efficiency gap between groups. While this method has been used in research on labour issues, it is used in this article to shed light on the differences between formal and informal micro-firms.
The rest of the article is divided into five sections. Section 2 presents the literature review, which provides an overview of the role of the micro-firm, outlining the informality issues linked to this kind of firm and what has been said about the differences between groups. Section 3 describes the database used in the research as well as the way the variables were defined. Section 4 describes the methodology used to explain the different efficiencies and outputs between groups. Section 5 presents the results, and section 6 summarizes the main conclusions and policy implications.
I. Literature review
There has been an increasing interest in the role of micro-firms on countries development, since these kinds of firms can be seen to have positive or negative effects on development, depending on the point of view from which they are viewed and the country under study. For instance, in developed countries, owning a business and being your own boss are desirable characteristics, with this kind of firm taken as an alternative to salaried work. In contrast, micro-firms in developing countries are associated with unregulated activities and the self-employed sector. While most of the time these micro-firms are taken as being involved in informal subsistence activities, they are also recognized as a means of reducing poverty and social inequality (Mungaray and Ramírez 2007).
The fact that microenterprises are associated with informality has to do with the characteristics associated with these economic units, for example, the low level of organization to carry out their operations. However, the simple fact of defining and measuring informality has brought differences from an economic and statistical point of view; proof of this is the way to name it. Since under the first perspective is mostly known as shadow economy, unofficial economy, hidden economy, or underground economy. While for the second perspective is known as underground production (Dell'Anno, 2021). To reconcile with differences, Feige (2016) has proposed a differentiation through non-conforming behaviors, such as undeclared economy, unregistered economy, illegal economy and informal economy; the latter referred more to the circumstances of the labor market.
In a step toward defining the informality, the International Labor Organization (ILO) has proposed definitions and recommendations (ILO, 2015); it is proposed that the informality is all activities of workers and economic units that are -in law or in practice- not covered or insufficiently covered by the formal arrangement. It is made a distinction that the informal sector consists of units engaged in the production of goods or services with the primary objective of generating employment and income for the persons concerned; these economic units normally operate with a low level of organization and with little division between labor and capital as factors of small-scale production; then, these informal enterprises can be self-employed or formal enterprises that deliberately underreport their production to avoid the burden of regulations and taxation. To have a better definition of informality in economic units, the ILO (2021) introduces the term informal productive analysis, which is activities carried out by a person and economic units that are -in law or in practice- not covered by formal arrangements. That is, it can see that the concept has been improving, along with the measurement to make comparisons, to have more accurate data of the informality.
On the other hand, it is important to explain the different reasons people decide to explore the informal sector and start a new micro-firm, as it is known that these reasons may influence a firm’s economic performance. For instance, it is said that economic performance may respond to voluntary entrance. Where a salaried worker enters the informal sector, this is considered a transitory situation. Similarly, Levy (2010) states that in cases where salaries are too low, as in most developing countries, micro-firms measured as self-employed may be less desirable. However, the main reason for entering this sector of firms is the non-pecuniary benefits, such as flexibility of hours and being one’s own boss (Hurst and Pugsley 2011). As these benefits have also been found in studies carried out in developed countries, it has been proposed that micro-firms in developing countries should be treated as they are in developed countries, i.e., as a desirable sector that provides, for instance, a source of employment for low-productivity workers (Fajnzylber et al., 2006).
Some argue that micro-firms are less desirable in economic terms for a society, citing their low working capital and low wages and their poor-quality and low-value products (La Porta and Shleifer 2014). According to Davis et al., (2007), most non-employing micro-firms in the United States are quite small in size and have never employed staff. In this respect, Hurst and Pugsley (2011) state that only a few small businesses have a new idea to market, with most having little interest in growth and innovation. Furthermore, most micro-firms are dismantled when their owners die (Benjamin and Mbaye 2012). Unlike micro-firms, larger firms have better characteristics, such as higher education levels.
Obstacles may affect the economic performance of micro-firms. For example, regulations play a key role in inhibiting individual activity to exploit such opportunities in the market as contract enforcement or labour market regulations (Ardagna and Lusardi 2008). On the other hand, among the most common obstacles for micro-firms are available capital and credit restrictions (Hernández-Trillo et al., 2005). These factors may make a difference in the performance of a business, as it has been found that micro-firms that support their activities with bank credit instead of loans from family or friends are more efficient (Aguilar et al., 2012). Similarly, Heino (2006) describes the relationship between starting a new micro-firm and the methods of financing it, with, for instance, the constraints of family savings hindering the creation of micro-enterprises in Mexico. However, despite liquidity restrictions, this sector does not appear to be less desirable than alternative business models available in market (Fajnzylber et al., 2006).
Another important argument made against micro-firms is that most of them are informal; in other words, they are breaking law in some way. Whether informality is a problem or not depends on theoretical approach, with the dualist school, for instance, seeing informality as a marginal activity that provides income and security to poor people who, although they would prefer to be employed in the formal sector, are excluded. The structuralist school sees informality to help reduce inputs and labor cost. The legalistic school sees informality as a problem related to regulations, in which economic agents try to avoid costs (Alter 2012).
In practical terms, the informal sector can be seen as a strategic response to competition from larger firms (Farrell, 2004). Many economic units in this sector encounter capital shortfalls due to a lack of institutional credit and social security, as well as employee job instability. Most informal economic units do not move to the formal sector and remain in the same conditions without any improvement for many years (La Porta and Shleifer 2014). In addition, governments collect lower tax revenues due to a lack of information on earnings from this sector (Aguilar et al., 2012).
The question as to whether micro-firms choose the informal sector may be explained by government failures, which, for instance, may influence whether a society perceives the benefits of paying taxes, such as the quality of public services. Known as tax morale, this can affect the decisions of economic agents and promote involvement in the informal sector. In the case of low tax morale, many economic units may see no point in formality (Benjamin and Mbaye 2012; Jaramillo 2009).
The problems with informality begin with attempts to measure it. For instance, the informality of an economic unit has been measured through business size, in terms of the number of employees; in this way and as a basic measurement, a firm with few employees might be informal. While registration with government agencies has been also used as another measure of informality, the problem with this measurement method is that a business can be registered with one government agency but not others. The firm’s accounts are another way of measuring informality, with this measurement considered a good indication, as firms do not usually formally register their activities. Business mobility has been also used as a measure because this kind of firm does not have a fixed workplace. Most studies recognize, however, that it is difficult to measure informality regardless of the measurement method, largely due to data availability. Furthermore, it is impossible to talk about unique informality, as there are firms that are breaking all laws and others only breaking some laws (Benjamin and Mbaye 2012).
Efficiency is a key point to understanding economic development in any society, as it represents a measurement of the efficiency with which a country, firm, or worker produces goods and services. In this regard, economic growth is considered as coming from the creation of highly productive formal, rather than informal, firms, and micro-firms much less so. The problem is that most informal firms are too small to be sufficiently productive; for instance, a sample of poor countries reveals that, on average, an informal firm employs four workers while a formal firm employs 126 workers (La Porta and Shleifer 2014). The problem of informal firms is that, in general terms, they are less productive and less efficient (La Porta and Shleifer 2014; La Porta and Shleifer 2008; Fajnzylber et al., 2011). It has been found that when newly created firms choose to operate in the formal sector, they show better revenue levels, employ more workers, and have more working capital (La Porta and Shleifer 2014).
The differences in productivity, however, are only found in smaller firms, as bigger informal firms may have productivity levels as high as formal firms while remaining informal (Benjamin and Mbaye 2012; Castany 2007). This means that productivity differences are more notable in small firms than in large firms. It is very important to distinguish between large and small firms to better explain the productivity differences for each sector and size of firm. The size of a firm has been considered as a criterion for informality, with micro-firms often assumed to be informal without any distinction being made. Nevertheless, there may also be differences in terms of efficiency in this sector of firms. In this regard, Otero et al., (2013) find that informal micro-firms in Mexico are less efficient than formal firms. These efficiency differences may also be expressed in terms of wages and growth rates. La Porta and Shleifer (2014) conclude that the productivity of informal firms is too low for them to compete in the formal sector.
The motivation to begin a new business is another possible variable that can explain efficiency differences between formal and informal firms. The latter sector of firms can be seen as way of sheltering firms from adverse conditions in formal labour market. Put in these terms, micro-firms may simply represent a way of subsisting rather than a form of entrepreneurship, and as such, are unlikely to grow, which may explain some of the differences between groups (Aguilar et al., 2012; Perry et al., 2007).
The human capital variable is another factor used to explain efficiency differences between formal and informal firms. It is said, for instance, that educated people often run formal firms. These business owners find it more profitable to run a bigger formal firm than an informal one. In empirical studies, the human capital variable is statistically significant in explaining productivity levels, although the formation of human capital is more important for managers than workers in this kind of firm (La Porta and Shleifer 2008; Gennaioli et al., 2013; Akoten et al., 2006; Gelb et al., 2009). It has even been found that entrepreneurs with more educated spouses have higher earnings (McKenzie and Woodruff 2006). However, the problem of measuring human capital is that most measurements do not consider labor experience, which is known to play an important role in explaining the performance of any kind of firm (Mungaray and Ramírez 2007).
Capital endowment may be one of the main differences between formal and informal micro-firms. It is expected that a firm with better endowments will achieve better performance in economic terms. A study carried out on Turkish micro-firms confirms that formal firms are more capital intensive than informal micro-firms, although this was not the case for Egyptian micro-firms (Hendy and Zaki 2013). Capital differences can be explained by a lack of access to formal credit. Many micro-firms do not comply with the standard requirements of the formal financial system. Empirical studies have found that micro-firms with access to bank loans, moneylenders, or formal credit from clients and suppliers are more efficient than those who depend on credit from family or friends (Hernández-Trillo et al., 2005).
Factors other than credit access or finance issues, such as better market strategies or the characteristics of micro firms and their owners (Fajnzylber et al., 2011; Akoten et al., 2006), may better explain performance differences between formal and informal micro-firms. For instance, a lack of ability or a lack of desire to grow would be reflected in poor performance (De Mel et al., 2010). Besides, variables, such as hours worked, whether relatives of the business owner support the micro-firm, or marital status of the business owner can have an important influence on performance (Fajnzylber et al., 2011).
It is important to consider a broader context where, for instance, the macroeconomic environment can influence micro-firm performance, given the impact of factors such as economic shocks on formal and informal firms.
In the same way, geographical regions must be considered inasmuch as these may influence productivity and efficiency, for instance, firms locate on borders can have a different behaviour by different tax law.
Furthermore, law enforcement may affect the business environment and thus the performance levels between groups (Gelb et al., 2009). Government plays a very import role in terms of their obligations for law enforcement and the provision of a good business environment. Governmental failures may limit the ability of a micro-firm to reach optimal size and performance. In practical terms, unequal access to public services can generate differences in productivity (Steel and Snodgrass 2008). In sum, policies that improve the business environment, such as the provision of access to formal credit, facilities to enable formalization, and management training, can cause differences between the groups (Mano et al., 2012).
II. Data and descriptive variables
The database used in this research has been taken from the Instituto Nacional de Geografía y Estadística (INEGI, or the National Institute for Statistics), from the Encuesta Nacional de Micronegocios (ENAMIN, or the National Micro Firm Survey). ENAMIN is focused on micro-firm owners in Mexico, covering businesses of up to six people in the trade, service, and construction sectors, and up to sixteen people in the case of the manufacturing sector. The study period includes the years 2008, 2010, and 2012; One of the advantages of using these years is that there were no important variations in the survey, so it is possible to compare each year with the others; unlike the years prior to this study where the questions of the survey had significant changes. The sample is about 12,000 micro-firms each year. Representative to a national level, the survey sample takes data from the 32 states of the Republic of Mexico, including the Mexico City.
Regarding informality, I use the criteria taken from the survey to identify formal and informal micro-firms. Each interviewee had to complete the sentence “In your activity or business…”. If from among the possible answers the interviewee chose “using a notebook or a notepad to keep accounts” or “accounts are not kept” the micro-firm was classified as informal.
The criterion used in this study to classify micro-firms as either formal or informal is considered the most appropriate, because it is inferred from a hidden question. When the interviewee is explicitly asked whether the micro-firm is registered with the government, it is highly likely that the interviewee will lie to avoid exposure to financial authorities. Furthermore, informal micro-firms’ accounts are not usually officially registered, which is one of their most remarkable and representative characteristics (INEGI, 2014; Benjamin and Mbaye, 2012; Cardenas and Rozo, 2009).
The variables listed below are obtained to measure the efficiency of micro-firms. The output variable is computed by obtaining micro-firm income with the question, “What is the amount of income generated by the business in the past month for the following items?” The survey gives the total amount of income. The capital variable is computed using the following question, “If you had to sell the tools, equipment, machinery, furniture, equipment, land, vehicles, and property that have been used in your trade or business, for how much would you sell them?” with the survey providing an estimated amount of capital. The labor variable is computed using the number of employees in the business, including the owner.
According to the literature, the variable of education is considered as playing an important role in explaining efficiency differences, obtained based on educational level, ranging from zero (uneducated) to nine (PhD). The age of the firm is another variable considered in this study, with the expectation that it has a positive effect on firm efficiency. The motivation for starting a business is considered important, as this can influence micro-firm performance and is taken from the following question: “What was the main reason for which you started this business or activity?” To capture an active motivation, the following answers are considered: “I had money and found a good opportunity” or “I wanted to do a job according to my trade, career or profession”; on the other hand, a different answer leads to the motivation being considered as passive.
Based on the literature, the formal financing of the micro business is considered as playing an important role in its performance, the data for which being taken from the following question: “Where did you get the money to start this business or activity?” Micro-firms are considered as having used a formal credit institution when the financing comes from commercial banking, government programs, supplier credit, small formal financial institutions, etc. Table 1 summarizes the variables used in this research:
Table 1 Definitions of variables
| Variable | Definition | Source |
| Output | Total amount expressed in money | ENAMIN |
| Capital | Estimated amount of capital expressed in money | ENAMIN |
| Labor | Number of workers including owner | ENAMIN |
| Education | Schooling of owner: from cero (no schooling) nine (Ph.D.) | ENAMIN |
| Firm Age | Age of micro firm | ENAMIN |
| Motivation | Motivation to begin the business: active (entrepreneurship) passive (necessity) |
ENAMIN |
| Financing | The money to begin the business comes from: formal credit (bank credit, government, etc.) or informal credit (relatives, friends, etc.) |
ENAMIN |
Source: Own elaboration
As an overview of micro-firms in Mexico, Table 2 presents descriptive statistics for the years 2008, 2010, and 2012. While the mean output in the sample for the three years is approximately 15,000 Mexican pesos, differences emerge when the sample is split between formal and informal micro-firms. For instance, the mean output of formal micro-firms is 36,196 pesos, while for informal micro-firms it is only 9,129 pesos, with the difference amounting to 27,067 pesos. While the mean capital for the full sample is 64,110 pesos, there is a notable difference between groups because formal micro-firms count on 184,062 pesos of capital, with informal micro-firms counting on only 26,037 pesos.
Table 2 Descriptive Statistics 2008, 2010, 2012
| Variable | Mean | Std. Dev. | Min | Max | Mean | Std. Dev. | Min | Max | Mean | Std. Dev. | Min | Max | |||
|---|---|---|---|---|---|---|---|---|---|---|---|---|---|---|---|
| Full sample 2008 | Formal Micro firms 2010 | Informal Micro Firms 2012 | |||||||||||||
| Average | |||||||||||||||
| Output | 15650.10 | 54046.50 | 20.33 | 2033333.33 | 36196.42 | 94918.23 | 57.33 | 2033333.33 | 9129.16 | 27397.80 | 20.33 | 1293333.33 | |||
| Capital | 64110.32 | 280089.40 | 2.33 | 7666666.67 | 184062.73 | 512576.73 | 37.33 | 7666666.67 | 26037.53 | 114296.93 | 2.33 | 5000000.00 | |||
| Labor | 1.69 | 1.17 | 1.00 | 15.00 | 2.31 | 1.63 | 1.00 | 14.67 | 1.49 | 0.89 | 1.00 | 13.75 | |||
| Education | 3.55 | 1.97 | 0.00 | 9.00 | 4.69 | 2.12 | 0.00 | 9.00 | 3.18 | 1.77 | 0.00 | 8.67 | |||
Source: Own elaboration
While the mean of number of workers, including the owner, is 1.69 for the full sample, this number changes when it is split, with formal micro-firms having a mean of 2.31 workers and informal micro-firms a mean of 1.49 workers. Another important difference is the owner’s level of education, with the mean for formal firms at 4.69, indicating that they have at least a high school education, while the average for owners of informal micro-firms is 3.18, indicating a middle school education. Another important variable is the age of the business, where the full sample has a mean of 10 years, but, again, a notable difference appears between the groups, with formal micro-firms having been, on average, in business for 11.8 years, while informal micro-firms have been in business for only 9.49 years.
III. Methodology
In light of the fact that, over the years, many theoretical papers have suggested different approaches to measuring efficiency and have obtained different results, there is no single measurement of them. Although it is difficult to measure, three recognized methodologies have been developed and widely applied to compute productivity: the econometric approach, index number, and distance function.
The methods of measuring the performance of microenterprises are essentially four (Coelli et al., 2005) the Least-Square econometrics production models; 2) Total Factor Productivity (TFP); 3) Data Envelopment Analysis (DEA); and (4) Stochastic Frontiers (SF). The first two methods are used for time-series aggregate. The last two methods are employed for firm samples at a point in time, in this way, it provides the firm efficiency, and it is not assumed that all firms are technically efficient. However, the third option does not consider measurement errors and other sources of statistical noise; this circumstance is considered with the stochastic production frontier method.
The methodology for measuring productivity depends largely on the availability and makeup of the database. Considering the availability and framework of the ENAMIN survey, the distance function approach is considered the best option for estimating efficiency. The most efficient micro-firms have a higher output-input ratio and are situated in the frontier of production, with the distance between any given firm and this frontier interpreted as the technical “(in)efficiency” of a micro-firm.
The estimation method is conducted by means of the stochastic frontier model approach. The efficiency range is from zero to one, where the higher the score, the more efficient the micro-firm.
Stochastic frontier model
According to the data available in the ENAMIN survey, the stochastic frontier model is the best method for measuring the efficiency differences between formal and informal micro firms in Mexico, as explained below:
Where variable
Equation 2 shows the composed error
To get a preliminary test of the effect of (in)formality, this variable is incorporated in equation 1 by means of a dummy variable, with the value of one for a formal micro-firm and zero for others.
Once the stochastic frontier model has been estimated, it is possible to obtain an efficiency
measure for micro-firms,
Oaxaca-Blinder decomposition method
A novel aspect of the research is the use of Oaxaca-Blinder decomposition method, which enables a better analysis of efficiency differences between groups. Although the Oaxaca-Blinder decomposition method has often been used to study labour market outcomes, it can be used to explain efficiency differences between formal and informal micro-firms (Kumari, 2022; Ali et al., 2016; Castany et al., 2007). This technique of counterfactual decomposition can be of great support in the analysis in other fields where the mean outcome differences between two groups are compared (Jann, 2008); in this study are formal and informal microenterprises.
In this way, two equations of efficiency can be estimated to obtain the returns enabled by the characteristics of both groups of firms. Equation 4 is the mean efficiency of formal micro-firms and equation 5 is the mean efficiency of informal micro-firms. Vectors
Finally, equation 6 decomposes the average efficiency differential between formal and informal micro-firms using two components, with the first referring to the differential in characteristics between formal and informal micro-firms that have the same endowment returns as formal micro-firms. The second part refers to the efficiency differential, which allows for differentiation of endowment returns for formal and informal micro-firms when they have the same endowments. The same analysis is conducted for the output variable as the dependent variable to obtain a wider overview of micro-firms.
IV. Results
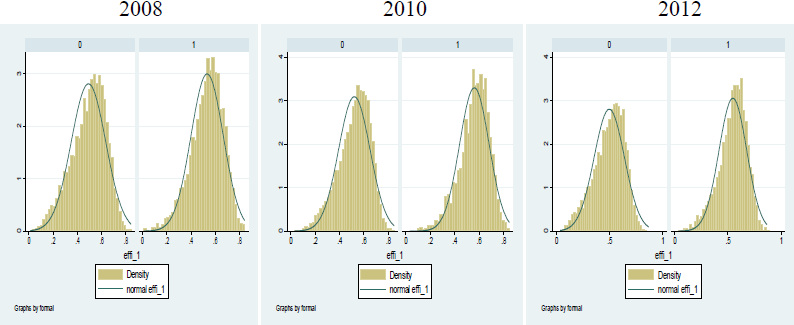
To compare and highlight the efficiency differences between informal and formal micro-firms, Figure 1 and Figure 2 show the results of graphing the main variables (capital and labor) with efficiency and output for both formal and informal micro-firms. In the three figures, formal micro-firms (represented by the black dots) are located higher than the informal micro-firms (represented by the grey dots), indicating greater efficiency and production. In addition, Figure 3 shows the efficiency differences in terms of the density distribution; in each figure, the density graph on the left corresponds to informal microenterprises, and the density graph on the right corresponds to formal microenterprises; in this way, it is possible to compare both graphs visually. It is confirmed that formal and informal micro-firms exhibit different behavior in terms of efficiency and output.


Stochastic frontier results
Table 3 shows the results obtained from the regressions carried out using the stochastic frontier method to compute micro-firm efficiency. As stated above, the model is computed considering the two main production factors-capital and labor-with the geographic area and the economic sector included for the three years, and with output as the dependent variable. As shown in model 1, the independent variables are statistically significant, with coefficients of 0.780 and 0.286 for the labor and capital factors respectively in 2012. Model 2 adds the formal dummy variable, which takes the value of one for a formal micro-firm and the value of zero for an informal micro-firm. With a positive effect of one percent, the formal variable is statistically significant. In other words, a first glance suggests that formal micro-firms perform differently from informal micro-firms.
Table 3 Stochastic frontiers method. Output as dependent variable
| Variables | 2008 | 2010 | 2012 | |||
| Capital | 0.285*** | 0.253*** | 0.273*** | 0.238*** | 0.286*** | 0.252*** |
| (0.00482) | (0.00514) | (0.00511) | (0.00547) | (0.00505) | (0.00533) | |
| Labor | 0.736*** | 0.669*** | 0.748*** | 0.685*** | 0.780*** | 0.710*** |
| (0.0217) | (0.0217) | (0.0205) | (0.0206) | (0.0200) | (0.0201) | |
| Northeast | 0.0452 | 0.0612 | -0.0848* | -0.0645 | -0.0481 | -0.0343 |
| (0.0433) | (0.0428) | (0.0443) | (0.0438) | (0.0439) | (0.0433) | |
| Northwest | 0.243*** | 0.252*** | 0.0315 | 0.0328 | 0.174*** | 0.183*** |
| (0.0386) | (0.0382) | (0.0380) | (0.0375) | (0.0375) | (0.0370) | |
| West | 0.223*** | 0.216*** | 0.0506 | 0.0430 | 0.193*** | 0.173*** |
| (0.0369) | (0.0365) | (0.0375) | (0.0371) | (0.0361) | (0.0356) | |
| East | 0.178*** | 0.189*** | -0.156*** | -0.141*** | 0.106*** | 0.119*** |
| (0.0400) | (0.0395) | (0.0410) | (0.0405) | (0.0391) | (0.0385) | |
| Northcentral | 0.0931** | 0.0961** | -0.0518 | -0.0380 | 0.130*** | 0.128*** |
| (0.0395) | (0.0391) | (0.0393) | (0.0388) | (0.0390) | (0.0384) | |
| Southcentral | 0.0812* | 0.0998** | -0.0562 | -0.0444 | 0.120*** | 0.138*** |
| (0.0448) | (0.0443) | (0.0456) | (0.0451) | (0.0440) | (0.0434) | |
| Southeast | 0.130*** | 0.137*** | -0.0583 | -0.0566 | 0.146*** | 0.153*** |
| (0.0389) | (0.0385) | (0.0382) | (0.0377) | (0.0376) | (0.0371) | |
| Manufac | -0.182*** | -0.171*** | -0.194*** | -0.175*** | -0.145*** | -0.121*** |
| (0.0279) | (0.0276) | (0.0283) | (0.0279) | (0.0279) | (0.0276) | |
| Commerc | 0.0487** | 0.0317 | 0.0588*** | 0.0481** | 0.0959*** | 0.0882*** |
| (0.0224) | (0.0222) | (0.0227) | (0.0224) | (0.0222) | (0.0220) | |
| Formal =1 | 0.412*** | 0.433*** | 0.462*** | |||
| (0.0248) | (0.0258) | (0.0260) | ||||
| Constant | 6.502*** | 6.697*** | 6.697*** | 6.933*** | 6.623*** | 6.863*** |
| (0.0567) | (0.0571) | (0.0624) | (0.0628) | (0.0594) | (0.0598) | |
| lnsig2v | -0.262*** | -0.300*** | -0.234*** | -0.270*** | -0.310*** | -0.360*** |
| (0.0345) | (0.0348) | (0.0377) | (0.0374) | (0.0364) | (0.0363) | |
| lnsig2u | 0.175*** | 0.181*** | -0.0287 | -0.0253 | 0.130* | 0.147** |
| (0.0638) | (0.0620) | (0.0855) | (0.0819) | (0.0672) | (0.0634) | |
| N | 12324 | 12324 | 11553 | 11553 | 11978 | 11978 |
| sigma_u | 1.091 | 1.095 | 0.986 | 0.987 | 1.067 | 1.076 |
| sigma_v | 0.877 | 0.861 | 0.890 | 0.874 | 0.856 | 0.835 |
| chi2_c | 130.4 | 139.6 | 66.56 | 73.15 | 109.1 | 123.6 |
| Cmd | frontier | frontier | frontier | frontier | frontier | frontier |
| Function | production | production | production | production | production | production |
| Ll | -18572 | -18435 | -17145 | -17006 | -17774 | -17617 |
Source: Own elaboration.
Standard Errors in parentheses. *** p<0.01 , ** p<0.05 , * p<0.1.
Once the efficiency level of the micro firms has been computed, with a range between zero and one (the higher the score, the greater the efficiency), the efficiency variable is taken as a dependent variable. Table 4 shows the results of running the efficiency variable with the variables of interest:
Table 4 OLS. Efficiency as dependent variable
| Variables | 2008 | 2010 | 2012 |
|
|
|||
| Education | 0.0269*** | 0.0233*** | 0.0293*** |
| (0.00314) | (0.00298) | (0.00317) | |
| Firm age | 0.00857*** | 0.00562*** | 0.00359** |
| (0.00142) | (0.00132) | (0.00142) | |
| Formal =1 | 0.0219*** | 0.0253*** | 0.0298*** |
| (0.00325) | (0.00309) | (0.00343) | |
| Motivation | 0.0223*** | 0.0180*** | 0.0149*** |
| (0.00314) | (0.00357) | (0.00348) | |
| Financing | 0.0116** | 0.00782 | 0.0194*** |
| (0.00550) | (0.00555) | (0.00552) | |
| Constant | 0.444*** | 0.482*** | 0.456*** |
| (0.00493) | (0.00468) | (0.00509) | |
|
|
|||
| Observations | 10,479 | 9,893 | 10,326 |
| R-squared | 0.028 | 0.027 | 0.029 |
| N | 10479 | 9893 | 10326 |
| Cmd | regress | regress | regress |
Source: Own elaboration.
Standard Errors in parentheses. *** p<0.01 , ** p<0.05 , * p<0.1 .
In the three years analyzed here, the formal variable, the main variable of interest, is statistically significant at one percent and has a positive effect on efficiency, with, for instance, the highest coefficient of 0.029 in 2012. This result strengthens the conclusions drawn from the results mentioned above, which indicate that formal micro-firms have better efficiency levels than informal micro-firms, and, thus, better performance.
The education variable has the expected positive effect and, at one percent, is statistically significant for the period studied, with a coefficient of 0.0293 in 2012-the second highest impact on efficiency. At one percent, the age of the firm is statistically significant and has a positive effect on efficiency, with a coefficient of 0.003 in 2012. The motivation to start a business has a positive influence on the efficiency level and is statistically significant at one percent with a coefficient of 0.0149. Access to formal financing is statistically significant, with a positive effect on efficiency and a coefficient of 0.0194 in 2012. Although the described results are for 2012, the basic thrust of the analysis is the same for 2008 and 2010 (Table 4).
Oaxaca-Blinder results
Table 5 shows the results of the Oaxaca-Blinder decomposition to explain the output and efficiency differences between formal and informal micro-firms. This method has the advantage of enabling the separation of the endowment and endowment return effects. Group 1 is made up of informal micro-firms, with the formal micro-firms found in group 2. It can be seen from Table 5 that the output differences, or output gap, between groups are 1.11, 1.28, and 1.23, in 2008, 2010, and 2012 respectively. Table 5 also shows the efficiency differences between groups with coefficients 0.035, 0.036, and 0.042 for the period covered in this study. These results confirm the difference between groups and show that formal micro-firms exhibit better performance in terms of production and efficiency than informal micro-firms.
Table 5 Oaxaca-Blinder decomposition method
| Output | Efficiency | ||||||
| Variables | 2008 | 2010 | 2012 | 2008 | 2010 | 2012 | |
| Informal | 8.262*** | 8.406*** | 8.596*** | 0.495*** | 0.521*** | 0.500*** | |
| -0.0146 | -0.0143 | -0.014 | -0.00166 | -0.00154 | -0.00161 | ||
| Formal | 9.381*** | 9.591*** | 9.833*** | 0.530*** | 0.558*** | 0.542*** | |
| -0.0227 | -0.0236 | -0.0249 | -0.00248 | -0.00237 | -0.00267 | ||
| Difference | -1.119*** | -1.185*** | -1.237*** | -0.0356*** | -0.0367*** | -0.0429*** | |
| -0.027 | -0.0276 | -0.0285 | -0.00298 | -0.00283 | -0.00312 | ||
| Endowments | |||||||
| Total | -0.831*** | -0.840*** | -0.890*** | -0.0133*** | -0.0110*** | -0.0122*** | |
| -0.0224 | -0.0234 | -0.0241 | -0.00153 | -0.00144 | -0.00151 | ||
| Capital | -0.489*** | -0.492*** | -0.507*** | ||||
| -0.017 | -0.0177 | -0.0172 | |||||
| Labor | -0.205*** | -0.232*** | -0.262*** | ||||
| -0.0122 | -0.0131 | -0.0138 | |||||
| Education | -0.0797*** | -0.0658*** | -0.0781*** | -0.00761*** | -0.00637*** | -0.00859*** | |
| -0.0108 | -0.0102 | -0.0102 | -0.00135 | -0.00121 | -0.00133 | ||
| Firm age | -0.0151*** | -0.0155*** | -0.00977*** | -0.00214*** | -0.00218*** | -0.00147*** | |
| -0.00295 | -0.00385 | -0.00325 | -0.000397 | -0.000481 | -0.000442 | ||
| Motivation | -0.0267*** | -0.0193*** | -0.0140*** | -0.00306*** | -0.00232*** | -0.00183*** | |
| -0.0042 | -0.00454 | -0.00448 | -0.000529 | -0.000558 | -0.000603 | ||
| Financing | -0.00502*** | -0.00198* | -0.00243* | -0.000471** | -0.000116 | -0.000262* | |
| -0.00191 | -0.00114 | -0.00132 | -0.000235 | -0.000121 | -0.00015 | ||
| Region | -0.0104*** | -0.0128*** | -0.0163*** | ||||
| -0.00325 | -0.00317 | -0.00405 | |||||
| Returns | |||||||
| Total | -0.287*** | -0.345*** | -0.347*** | -0.0223*** | -0.0258*** | -0.0308*** | |
| -0.0288 | -0.0296 | -0.0294 | -0.00331 | -0.00314 | -0.00342 | ||
| Capital | 0.581*** | 0.655*** | 0.775*** | ||||
| -0.14 | -0.152 | -0.153 | |||||
| Labor | -0.0373 | -0.0705** | -0.0787*** | ||||
| -0.0267 | -0.0296 | -0.0302 | |||||
| Education | -0.169** | -0.222*** | -0.224*** | -0.0171* | -0.0172* | -0.0190* | |
| -0.0733 | -0.0759 | -0.0776 | -0.00914 | -0.00892 | -0.00996 | ||
| Firm age | 0.125** | 0.0724 | 0.120** | 0.0209*** | 0.0172*** | 0.0210*** | |
| -0.0512 | -0.0549 | -0.0558 | -0.00654 | -0.00657 | -0.00729 | ||
| Motivation | 0.0314* | 0.018 | -0.00222 | 0.00397* | 0.00174 | -0.00112 | |
| -0.0176 | -0.0146 | -0.017 | -0.00225 | -0.00176 | -0.00224 | ||
| Financing | 0.00369 | -0.00123 | 0.00227 | 0.0008 | -0.000217 | 0.000383 | |
| -0.00774 | -0.00662 | -0.00692 | -0.00099 | -0.000797 | -0.000909 | ||
| Region | -0.0522 | -0.0787 | 0.177** | ||||
| -0.0822 | -0.0875 | -0.0825 | |||||
| Constant | -0.770*** | -0.718*** | -1.116*** | -0.0309*** | -0.0272** | -0.0320** | |
| -0.165 | -0.174 | -0.176 | -0.0117 | -0.0113 | -0.0128 | ||
| Observations | 10,479 | 9,893 | 10,326 | 10,479 | 9,893 | 10,326 | |
| Informal | 7463 | 7181 | 7817 | 7463 | 7181 | 7817 | |
| Formal | 3016 | 2712 | 2509 | 3016 | 2712 | 2509 | |
Source: Own elaboration.
Standard Errors in parentheses. *** p<0.01, ** p<0.05, * p<0.1
The difference in efficiency between the groups of microenterprises analyzed is according to what was expected according to the literature seen before. Finding the factors that explain these differences is where there may be divergence, in this sense, Osorio et al., (2018) explain that a large part of Mexican microenterprises is mainly subsistence and that they originate as a countercyclical mechanism, that is, these microenterprises do not have elements to operate competitively. Many of the informal micro-enterprises could fall into the subsistence group explaining the differences in efficiency. Other elements that explain the differences are discussed below.
According to the decomposition method used, Table 5 it can see that the efficiency difference between the analyzed groups can be divided into two components, the first component, is the so-called endowment effect which explains the differences in the levels of the observable characteristics of each group, which are expressed in the variables used in the model such as capital, labor, education, firm age, motivation, financing, and region. For instance, the 1.213 output gap is explained by the differences of 0.890 in micro-firm endowments in 2012, with most of this gap explained by capital and labor factors. In the same way, this result could be observed for the other two years featured in this study. These findings suggest that a large part of the output gap is caused by capital differences between groups, so this difference explains 0.50 points of 0.890 in 2012. In this regard, Hendy and Zaki (2013) have found similar results for micro-firms connected to industry in Turkey, with the group of formal micro-firms more capital intensive than their informal counterparts.
Labor is the second most important variable explaining output differences, contributing 0.26 out of 0.89 endowment differences. Furthermore, these results show that if formal micro-firms had the same labor characteristics as informal micro-firms, their outputs would be lower. Usually, an informal micro-firm has fewer employees than a formal firm and is less productive (La Porta and Shleifer 2008).
The results confirm that the education variable plays an important role in explaining output differences. In fact, education explains most differences among all variables-excluding capital and labor-with a coefficient of 0.078 in 2012. In this regard, the education variable is in line with most results reported in the literature and has always had a very important role in society. The sense of the analysis is the same for 2008 and 2010.
The motivation variable is statistically significant at one percent and explains-excluding capital and labor-0.014 out of 1.141 of the endowment differences recorded in 2012, indicating its importance in explaining output differences. The relationship between motivations and performance of microenterprises has been analyzed by Alvarado (2021) in the case of Mexico, where motivations such as being unemployed, having a low-paid job, or simply improving family income, are important factors since the creation of the microenterprise.
The age of the firm variable is third most important in explaining output differences, with a coefficient of 0.009 in 2012, supporting the idea that the age of the firm is significant in explaining performance differences between groups. Finally, although the financing variable has the lowest coefficient it is statistically significant at one percent, thus indicating its importance. In the case of Mexico, Guzman-Soria (2020) finds that bank loans have a significant impact on the productivity of microenterprises, however, this is not the largest impact among variables, this situation can be because of the lack of access to formal credit of these economic units. The findings are the same for 2008 and 2010.
On the other hand, the second part of the Oaxaca-Blinder decomposition method, the so-called endowment return effect is assuming that both groups have identical characteristics and that the differences that persist may be because that each of the characteristics has, although it may also be capturing the unobservable factors that are not included in the model. Interestingly, while the decomposition method applied to explain efficiency differences shows similar results to output difference analysis, this is in terms of variable importance, not in terms of endowments and endowment return analysis. For instance, the endowment returns effect explains 0.030 out of 0.429, while the firms’ endowments or characteristics explain only 0.012 in 2012. The methods used to exploit endowments explain most of the efficiency differences between groups.
The importance of the education variable in explaining efficiency differences between formal and informal micro-firms is strengthened by these results. The variable explains most of the efficiency differences, with a coefficient of 0.012 in 2012. This result is like that found by other authors (La Porta and Shleifer 2008; Gennaioli et al., 2013; Akoten et al., 2006; Gelb et al., 2009), who recorded the same importance and significance of this variable.
Remarkably, the variable age of the firm has a larger coefficient in endowment return than endowment, with 0.0210 and 0.001 respectively in 2012. This may be an indication that micro-firm owners’ business experience affects efficiency differences between formal and informal firms. This result is notable inasmuch as this issue is not often covered by these kinds of studies (Mungaray and Ramírez 2007). On the other hand, the motivation variable is statistically significant at one percent, a result that strengthens the idea that the motivation to start a business is important in explaining efficiency differences. Otero et al., (2013) find similar results for explaining efficiency. The financing variable has a positive effect and is statistically significant at ten percent in explaining the efficiency differences between formal and informal micro-firms-a finding in line with Hernández-Trillo et al., (2005). They found that the methods of financing a micro-firm matter in efficiency and output terms, although this variable is only statistically significant at ten percent and has a small coefficient.
Robustness checks
In order to support the results above, the econometric analysis and the Oaxaca-Blinder decomposition method have been applied to different measurements of (in)formality for micro-firms such as: i) registration of micro-firm before a notary (formal 2); ii) registration of micro-firm before a notary and the firm does not have any kind of accounting (formal 3); iii) micro-firm is registered before a governmental institution (formal 4). Annex 1 shows the results of the Oaxaca-Blinder decomposition method for 2012. Basically, the results are the same as those shown above for both output and efficiency analysis.
It is worth mentioning that it needs much more research to understand the world of microenterprises. This analysis contributes a little more to the literature on the subject, however, it is recognized that it is necessary for more studies based on more recent surveys to have better comparability and make contrasts over time. Unfortunately, the 2012 survey was the latest to be conducted in Mexico and this is a limitation to the analysis. It is expected that the government will apply again the survey and, in this way, it would be possible to work on expanding this analysis.
Conclusions
The role of micro-firms has been discussed from different points of view in economic terms, where this kind of firm can be seen as an example of entrepreneurship or as an economic unit that takes advantage of its informal position to compete unfairly. Micro-firms represent most of the business activity, particularly in developing countries, where informality is seen as an alternative to the traditional employment sector. Nevertheless, most of the time the micro-firm is considered unproductive and informal due to its size.
This study differentiates between two categories of micro firm-formal and informal-and then provides an explanation as to why there are efficiency differences between the groups. A novel aspect of this study is the use of the Oaxaca-Blinder decomposition method to determine why formal micro-firms are more efficient than informal micro-firms. To the knowledge of this author, this methodology has not been used before in this kind of research, which features an economic unit as the main object of study. Furthermore, this study is focused on a developing country, Mexico, in which this kind of firm is common and growing. The sample size is representative to a national level for the years 2008, 2010, and 2012.
Unlike other studies, this research distinguishes between micro-firms, highlighting the importance of categorizing them as either formal or informal rather than by size, thereby showing the differences in output and efficiency. Most output differences are due to endowment differences between groups, in that the characteristics of formal firms are superior to their informal counterparts. Interestingly, when the efficiency analysis is carried out the endowment return has more weight in the explanation of the gap between groups. Formal micro-firms take more advantage of their endowments.
The detailed analysis shows that the education variable explains most of the output and efficiency differences between formal and informal firms. The age of the firm is another variable that helps to explain the differences between groups. Similarly, the motivation variable plays an important role in clarifying the differences. Finally, while the financing variable has less statistical weight, it is significant in the econometric model.

