


 text new page (beta)
 English (pdf)
 Article in xml format
 Article references
 Send this article by e-mail
 Cited by SciELO
  Similars in
SciELO
Similars in
SciELO 
 Permalink
Introduction
One of the most important problems that exists today worldwide is inequality in the distribution of wealth. In the so-called developing countries, it is where this problem increases even further, generating all kinds of social difficulties. The companies, organizations that by making an effective use of all type of resources offer godos and services to cover the requirements of the market, do not escape to this reality; as in the case of countries and regions, wealth is similarly concentrated in a small group of companies that have a large amount of financial, technological and organizational resources that allow them to remain profitable and competitive in the long term. In contrast, a large number of micro businesses which are responsible for generating the majority of jobs in Mexico, do not have sufficient resources to grow and continue to offer what society requires. Based on INEGI (2015), 95.9% of companies in Mexico have characteristics that accredit them as a micro company. Companies, considered as the main engines for the growth of any local, national or global economy, generating direct and indirect jobs, paying taxes and satisfying the needs of market consumption; sometimes do not meet the optimal financing conditions required. Financial institutions clearly favor large companies that have sufficient tangible and intangible assets that allow them to maintain competitive positions in the markets, and that present solid data according to the valuation methods of companies generally used. However, taking into account the reality of the companies, particularly in Mexico, it is considered pertinent to propose new ways to determine the risk and performance of small businesses, and thereby helping them to obtain more and better financial support that allows to effectively contribute to the improvement in the quality and the standard of living of its workers, clients, suppliers, investors and society in general.
In this way, it is clear that traditional methods to assign the value and risk of a company for the purpose of obtaining credit do not currently correspond to the reality of microenterprises in Mexico, which are characterized by having a great potential for growth, however, they are also distinguished by not having clear and audited financial statements, well-defined organizational structure, operational manuals to follow, and so on. This makes it difficult for these companies to be taken seriously by financial institutions that seek to optimize their resources, respond to the economic problem of scarcity and maximize their benefits with minimal risk. Even those studies carried out by professionals in finance, generally focus on methods to determine the value and risk of large companies, so it can be said that the valuation of companies focused on micro companies is a relatively unexplored field due to the difficulty in obtaining the required information, as mentioned above.
It is due to the above reasons that the valuation of companies is a tool of great importance to contribute to economic growth, as discussed by Siu Villanueva (1999), who states that the valuation of companies has grown in importance at the time of making decisions of business investment due to the great diversity of variables that need to be included to obtain solid and useful values. For Caballer V. (1994), the valuation of companies is defined as ¨a part of the economy whose purpose is the estimation of a certain value or values of a company according to certain assumptions, with a view to certain purposes and through calculation processes based on information of a technical and economic nature¨. For its study and application, the discipline of corporate valuation can be broadly divided into: accounting methods, cash flow methods and market methods; its use depends on the nature of the asset to be valued as well as on the information available at the time of valuation.
Taking into consideration the professional valuatory practice, it can be affirmed that the approach that is most pertinent for determining the value of a company is that of cash flows, due to the characteristics of a business organization. Specifically, the method called Capital Asset Pricing Model1 originally proposed by Markowitz (1959), offers an option to determine the financial risk of an asset or company related to the market risk to which it belongs, through the so-called coefficient Beta risk. This factor, together with others related to returns, is used to estimate the so-called discount rate, data necessary to calculate the net present value the estimated future cash flows generated by a company, under the income approach. For Moreno (2010) , the main characteristics of the Beta coefficient are: it is estimated by an analysis of variances and covariances of matrix calculation, it is an index that measures the degree of movement of the performance of a company with respect to the movement of the market’s performance, is the relevant part of a company’s risk that is attributable to market factors that affect all its companies; he also comments that in order to reduce and almost eliminate the risk of an investment portfolio, it is only necessary to add more companies in such a way that the only relevant risk is the non-diversifiable or systemic one.
In the field of the study and application of risk Betas, Damodaran (2018) has been one of the main promoters of the use of the CAPM for the determination of risk by means of the Beta coefficient applied to various industries that operate mainly in the United States. As previously mentioned, the main disadvantage of this type of studies is that they focus on obtaining data from large companies, so the results are applicable to organizations with similar characteristics, leaving aside the risk estimation for smaller companies and /or located in other countries or regions. Regarding the limitations of the results in the calculation of the Beta coefficient, Marín & Rubio (2010) indicate that the risk factors measured by this coefficient present a temporal behavior with respect to their market, which is also different for each sector. Regarding the need to contextualize the Beta coefficient, Argueta & Martínez (2016) conclude that it is necessary to adapt the financial information required to calculate the factor when considering the beta of the chosen industry corresponding to international markets and then apply some type of factor that adjusts the level of risk, using for example, the respective country’s risk.
Similarly, Vidaurre (2016) states that for the proper application of the CAPM method, various implications and limitations need to be considered, such as the fact that the information required to estimate the risk coefficient is easily obtained in mature stock markets from developed countries, unlike developing countries where a low number and variety of companies are listed on the stock market. Finally, Caballer V. (1998) explains that the “market” of companies cannot be considered homogeneous if it is taken into account that even organizations that operate in the same sector and of similar size, have different characteristics of effectiveness, profitability, productivity, organization, etc.
Based on everything presented above, the problem to be investigated is the inability of traditional methods to measure risk through the CAPM and to provide adequate and reliable results for microenterprises in Mexico; considering that the majority of the studies carried out so far focus on organizations of different sizes and very general sectors, conditions that differ from the current national reality. As has been reviewed, the information traditionally used for the estimation of the Beta coefficient is the one belonging to an industry in the market and its variation is determined with reference to the whole market, represented by a stock index. Because managing a single Beta factor for an entire industry is not the most valid, precise, representative or optimal, the hypothesis or research question to be checked is that, by building an own index using information pertaining to a sample of micro businesses in Mexico, it may be possible to calculate risk Betas for a specific subsector that indicates the risk of these companies in a more contextualized way.
Due to all the previous statements, the hypothesis to be verified is as follows: Is it possible to obtain Beta risk coefficients for selected subsectors of the manufacturing sector that accurately reflect the risk associated with these companies, by forming an own index according to a sample of micro companies in Mexico? Thus, the main objective of this research work is to estimate the Beta risk coefficient for micro companies that operate in selected sub-sectors in Mexico, responding to the need for a risk estimation that is truly pertinent, representative and applicable for the decision making of the various stakeholders involved. Thus, this research aims to provide a risk measurement tool that supports financial decision-making for micro-enterprises in a competitive environment, with great uncertainties, where they constantly require more and better sources of financing that allow them to continue to add value to the national economic growth.
The structure of the present investigation shows in the first place the introduction that includes the approach of the problem, justification, hypothesis and the main objective. Subsequently, the review of the literature corresponding to the use of the CAPM as a risk measurement is presented. Next, the methodology used in the study is exposed, which includes the segmentation and composition of the sample as well as the sources of information used. Below are the results of the application of the chosen methodology through the proposed method, breaking down the calculations of the respective variances and covariances based on the performance of the companies of the general index and the selected subsectors. In the conclusions, the most relevant contributions of the research are gathered from the results obtained. Finally, the main references used to support the study are presented.
I. Review of Literature
According to the research carried out by Francisco (2010), the values that the beta risk coefficient can present are practically unlimited, also mentions that it should be considered as a relative data and that it can also be expressed as a percentage. In this way, a risk Beta of 1.25 indicates that the financial asset analyzed has a 25% sensitivity higher than the market in which it operates. Additionally, Gitman L. J. (2007) explains that while the beta coefficients have positive and negative values, in general practice most of them usually have a positive sign. In the same way, it indicates that most of the betas are in an approximate range between 0.5 and 2.0; for every 1% change in market performance, the asset with beta of 0.5 will move by 0.5% and the asset with beta of 2.0 will move by 2.0%. On the other hand, Noguer (2008) comments that the beta coefficient is also used by investors to measure the profitability of a portfolio that is attributable to the evolution of the general market considering that, for example, a risk beta greater than +1 indicates that the financial asset presents risk and its value will increase more than the average in a bull market and will decrease more than the average in a bear market; which will make the market offer a bigger reward to that risk through a higher risk premium.
Regarding a review of more recent works that aim to address similar approaches to the present investigation, some of the most outstanding are presented below, which vary in methodology depending on their nature and objectives.
The study conducted by López et al. (2013), about the systematic risk of issuing banks of securities in Spain for the period of 1993 and 2010, using an econometric methodology of the study of events and considering the possibility of changes in the systematic risk within the windows of the event. The most relevant findings indicate that the systematic risk increases from the beginning and until the end of the analysis period for the issuance and registration dates, improving the diversification of the issuer’s portfolio; similarly, it is found that the systematic risk prior to issuance for large entities is considerably greater than that of small and medium-sized banks and that issuance is an event of greater importance for these latter companies due to the greater impact of this effect.
The work dedicated to estimate the beta coefficients of a sample of listed companies in the Argentine Stock Exchange between 2010 and 2012 through four different methods in order to find one that can be considered as a reference to determine the betas of SMEs that do not quoted on the Stock Exchange, carried out by Martínez et al. (2014), concluded that to calculate and interpret the risk of each company is required to analyze technically the method used as well as the sensitivity of the time series used, in addition to taking into account the future prospects of both the company analyzed and the sector.
The research carried out by Kristjanpoller & García (2014), on the estimation of the beta risk of pension funds in Chile during the period 2002-2012, used the methodologies of least squares, Blume method and Vasicek method when analyzing the characterization, consistency and stability of the beta risk of said funds. The main conclusions indicate that the beta index is an adequate measure to identify the risk of an investment, which proves that the pension funds present a defensive behavior within the investment portfolio.
Based on the research elaborated by Vargas & Cruz (2015) focused on determining how risk management models can generate value through the reduction of the discount rate of the valuation flows of the underlying asset; three models of real derivatives were proposed in order to maximize the value of the asset through strategies to reduce the systematic risk measured by the risk beta. The main conclusion is that the coverage of the EBIT eliminates the unexpected changes in the demand, which generates that it becomes an EBIT with zero changes, which means that the systematic risk of the asset becomes 0 or a free rate. Risky; maximizing the value of the company minimizing the discount rate.
The work of Santana (2015), dedicated to estimating the beta coefficient of the real estate sector based on the performance of real estate investment funds in Colombia, used several autoregressive models and conditional heteroscedasticity with the objective of calculating the risk of the funds in reference to the sensitivity of the systematic risk of the real estate sector. The results obtained showed that the level of risk of the real estate sector is below the risk of the total market, which indicates that real estate projects have a lower capital cost than projects in other sectors.
The study on the effectiveness of the CAPM model for valuing family businesses by estimating cash flows using said discount rate, containing the total risk and opportunity costs, prepared by Wong & Chirinos (2016); It allowed concluding that the model presents a tendency to dismiss the enterprises, even those considered as acceptable. Additionally, it was identified that if other changes were taken into account, such as the liquidity discount or country risk, the results would be less favorable to family businesses.
The investigation carried out by Vidaurre (2016), on the determination of a model of approximation of the beta coefficient to measure the risk-return to the Bolivian Financial System, by means of the proposal of a practical approach of the alternative models as well as its correlation with the traditional model, managing to evaluate the risk-return of a bank in Bolivia. The main findings indicate that the effectiveness of accounting betas is affected by the number of observations, and that qualitative betas present a somewhat level of subjectivity on the part of the evaluator; In spite of this, the proposed model validates its methodological applicability and can be used to estimate the value of companies by all kinds of professionals in valuation and finance.
In the work focused on the comparison of risk management models and their application in SMEs by Muñoz & Cuadros (2017), it was possible to verify the impossibility of its application because of the high cost involved, the amount of time it requires apply robust methodologies and the approach of such methodologies to large companies. Specifically, it explains that SMEs are unable to manage risk adequately due to lack of knowledge, resources and personnel; This is demonstrated by the lack of change management and the risks associated with uncertainty as well as the systematization of the learning obtained.
Based on the recent research cited, it is possible to conclude that there is a wide range of works that seek to contextualize the data used to focus the conclusions to its application to a certain type of companies, varying its size, geographical location and rotation. Despite this, it was not possible to find studies with the same objective as the present research, that is: the determination of the risk through the beta coefficient for microenterprises of subsectors of the manufacturing sector in Mexico through its comparison with its own index of micro companies in the country.
Taking into consideration what is stated in the literature review, it is possible to conclude the importance of making certain adjustments in the application of the basic methodology of the CAPM and particularly to the estimation of the Beta risk coefficient. The present research project proposes that instead of using data on stock market returns, the creation of an own index composed of selected financial information corresponding to micro companies in Mexico is made. In this way, the results obtained may be valid and applicable to the current business reality, thus contributing to the improvement in the financial decision making of the various stakeholders involved.
II. Methodology
From the theoretical framework presented in the review of the literature regarding the Beta risk coefficient, and according to the approach proposed in the introduction of this work; The methodology to be applied consists first of all in the elaboration of an own reference index based on information belonging to microenterprises in Mexico. To achieve the objective of estimating an own index, it is required to use information from companies with comparable size characteristics by their number of workers; in this way, the final results will be truly relevant for the financial decision-making of the micro entrepreneurs and the respective interest groups. To select both the size of the company and the most relevant subsector to be analyzed in this study, the following context analysis was carried out.
Sample of the main index
Based on the results presented by the Encuesta Nacional sobre Productividad y Competitividad de las Micro, Pequeñas y Medianas Empresas conducted by the Instituto Nacional de Estadística y Geografía, the Banco Nacional de Comercio Exterior and the Instituto Nacional del Emprendedor, graphic 1 is presented INEGI (2016).
As can be seen in graphic 1, microenterprises in Mexico are the economic units that contribute with 75.4% of the total employed personnel.

Source: ownelaboration based on: INEGI (2016).
Graphic 1 Percentage distribution of companies by personnel employed in Mexico, 2014
For the present investigation, selected financial information was obtained from 200 companies that covered with two fundamental characteristics:
Instituted in Mexico, without considering the industry to which they belong.
That by their number of workers and annual sales could be classified within the category of micro enterprises (1 - 10 people and up to 4 million pesos in annual sales).2
In order to estimate the behavior of the returns of a sector with respect to its market, it is necessary to analyze the information of different periods or years, in this case information corresponding to the years 2012, 2013, 2014, 2015 and 2016 has been used; which is considered as the time horizon of the constructed index. Specifically, it is necessary to determine the profitability of the 200 micro companies during said periods, for which the financial indicator return on investment (ROI)3 has been used specifically.
Selection of the economic sector
Secondly, it is necessary to obtain the rate of return measured by the ROI corresponding to a sample of microenterprises whose sector has been included in the index formed, which belongs to the sector or sub-sectors that are to be analyzed and from which one wants to obtain their sensitivity or variability measured through the Beta coefficient. When carrying out an analysis of the remunerations according to the distribution of economic units by sector in Mexico, it can be determined based on graphic 2 that manufactures are the ones that represent the greatest proportion with 33.88% of the total, according to INEGI. Censos Económicos. Resultados Definitivos (2014).

Source: ownelaboration based on: INEGI. Censos Económicos 2014. Resultados Definitivos (2014).
Graphic 2 Percentage distribution of remunerations by sector in Mexico, 2014
Taking into consideration the manufacturing companies in Mexico due to their important contribution to remunerations, based on information from INEGI (2014) it can be concluded that 93.6% of them are micro enterprises (graphic 3), so it is confirmed the relevance of focusing the study on this size of organization. The same source corresponding to the economic censuses prepared by INEGI, details that the manufacturing sector stands out for the generation of total gross production of 48.2% of the total at the national level, in addition to concentrating 11.6% of economic units and 23.5% of total personnel employed.
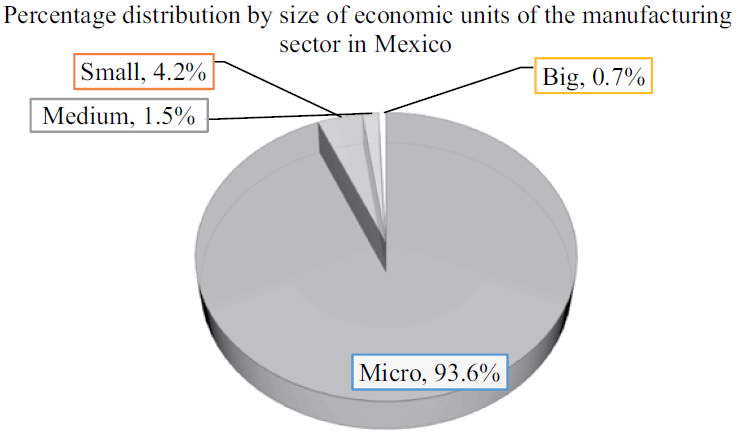
Source: ownelaboration based on: INEGI (2014).
Graphic 3 Percentage distribution by size of economic units of the manufacturing sector in Mexico
Thus, manufactures, representing an important source of remuneration for their workers, constitute a sector of great importance for economic growth and for the increase in the level and quality of life of people in Mexico, so the estimate of the risk Betas in this study will focus on this sector.
Based on the North American Industrial Classification System (NAICS), the manufacturing sector includes: “economic units dedicated mainly to the mechanical, physical or chemical transformation of materials or substances in order to obtain new products; to assemble in series of manufactured parts and components; to the serial reconstruction of machinery and industrial, commercial, office and other equipment, and to the finishing of manufactured products through dyeing, heat treatment, plating and similar processes. It also includes economic units hired to carry out the manufacturing activities of products that are not their own (maquila activities), and economic units that do not have productive factors, that is, those that do not have employed personnel or machinery and equipment for the transformation of goods, but that they produce them through the subcontracting of other economic units” INEGI (2013). Likewise, the NAICS proposes the sub-sector classification shown in table 1 for the manufacturing industries
Table 1 Classification of the subsectors of manufacturing industries according to NAICS
| NAICS Code | Subsector |
| 311 | Food industry |
| 312 | Beverage and tobacco industry |
| 313 | Manufacture of textile inputs and textile finishing |
| 314 | Manufacture of textile products, except clothing |
| 315 | Manufacture of clothing |
| 316 | Tanning and finishing of leather and leather, and manufacture of leather, skin and substitute materials |
| 321 | Wood Industry |
| 322 | Paper industry |
| 323 | Printing and related industries |
| 324 | Manufacture of petroleum products and coal |
| 325 | Chemical industry |
| 326 | Plastic and rubber industry |
| 327 | Manufacture of products based on non-metallic minerals |
| 331 | Basic metal industries |
| 332 | Manufacture of metallic products |
| 333 | Manufacture of machinery and equipment |
| 334 | Manufacture of computer equipment, communication, measurement and other electronic equipment, components and accessories |
| 335 | Manufacture of accessories, electrical appliances and electric power generation equipment |
| 336 | Manufacture of transport equipment |
| 337 | Manufacture of furniture, mattresses and blinds |
| 339 | Other manufacturing industries |
Source: own elaboration based on: INEGI (2013).
Selection of the manufacturing subsectors
According to information published by the Banco de Información Económica regard ing the number of economic units in the manufacturing sector in Mexico, graphic 4 was elaborated. Based on this information, it can be concluded that the majority of manufacturing establishments are concentrated mainly in three subsectors: food industry, metal products manufacturing and the beverage and tobacco industry, grouping 96.49% of the total BIE (2016). For the purpose of this research work, it has been determined to estimate the Beta risk coefficient of the 8 subsectors that account for 98.24% of the total manufacturing establishments in Mexico BIE (2016), as shown in table 3; in this way it is ensured that the final results are applicable for the adequate financial decision making of the most representative economic units in the sector.
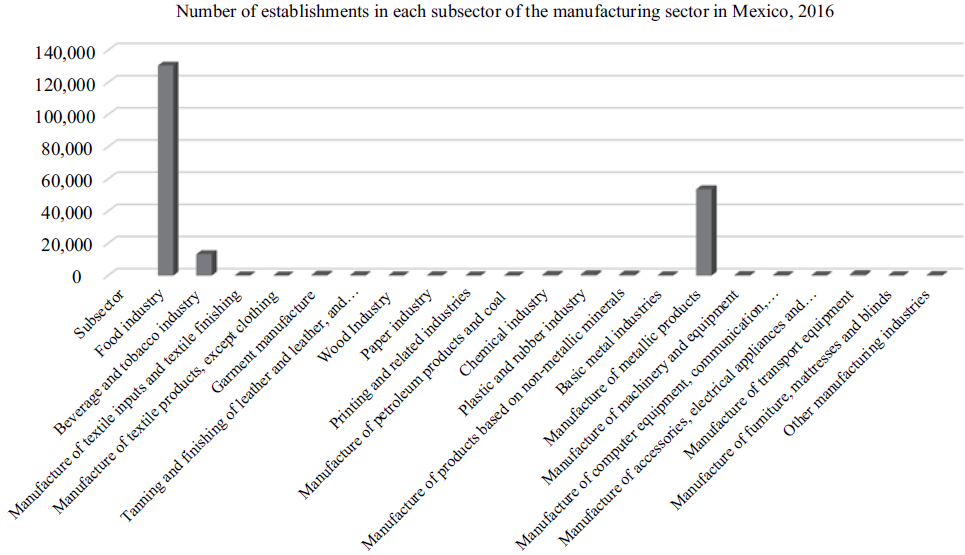
Source: ownelaboration based on: BIE (2016)
Graphic 4 Number of total establishments in the manufacturing sector by sub-sector in Mexico, 2016
Based on what it was stated in the introduction of the present study and in all the exposed information in the analysis of the context, the present investigation will be oriented to analyze selected information from a database composed of a representative sample of micro enterprises belonging to the manufacturing subsectors expressed in table 2. This information will allow conclusions which are applicable to their individual context.
Table 2 Manufacturing subsectors grouping the majority of establishments in Mexico
| SCI Code | Subsector | No. of establishments | Percentage |
| 311 | Food industry | 130,540 | 63.77% |
| 332 | Manufacture of metallic products | 53,629 | 26.20% |
| 312 | Beverage and tobacco industry | 13,351 | 6.52% |
| 336 | Manufacture of transport equipment | 882 | 0.43% |
| 326 | Plastic and rubber industry | 841 | 0.41% |
| 327 | Manufacture of products based on non- metallic minerals | 708 | 0.35% |
| 315 | Manufacture of clothing | 594 | 0.29% |
| 325 | Chemical industry | 565 | 0.28% |
| Total | 98.24% |
Source: own elaboration based on: BIE (2016).
Sample of the selected manufacturing subsectors
Base on the above, the required information was obtained from a sample of companies that covered the following three requirements:
Focused on the manufacturing sector in Mexico.
That based on their number of workers and annual sales they could be defined as micro enterprises (1-10 people and up to 4 million pesos in annual sales).4
Belonging to the subsectors of the manufacturing industry described in table 3.
The total sample is constituted by 240 micro companies of the manufacturing industry in Mexico. It is important to clarify that the size of the sample of the micro enterprises of the selected manufacturing sub-sectors was considered as a case study of 30 companies representative of each one, as shown in table 3. The number of 30 elements was determined to ensure that the variable studied meets the minimum number of observations required for its behavior to resemble that of a normal curve distribution, based on the central limit theorem according to Johnson & Kuby (2004) .
Table 3 Sample composition of the selected manufacturing sub-sectors in Mexico
| Manufacturing subsector | Number of companies |
| Food industry. | 30 |
| Manufacture of metallic products | 30 |
| Beverage and tobacco industry. | 30 |
| Manufacture of transport equipment | 30 |
| Plastic and rubber industry | 30 |
| Manufacture of products based on non-metallic minerals. | 30 |
| Manufacture of clothing. | 30 |
| Chemical industry. | 30 |
| Total | 240 |
Source: own elaboration based on research results.
Regarding the obtaining of the performance data required for the estimation of the coefficient, it is important to make clear that the totality of the data was obtained through a collaboration agreement with a consulting firm established in the City of Puebla, Puebla; from which its name will be omitted, as well as those corresponding to the micro companies analyzed for compliance with the confidentiality agreement established. Regarding the type of research carried out, it can be defined as a type of non-probabilistic sampling with the characteristics of an intentional or selective sampling, according to Bonilla-Castro & Rodríguez (2005) , this is due to the fact that since the beginning of the investigation, the information required to carry out the study was already available.
Once the information required to estimate the average ROI of each of the years: 2012, 2013, 2014, 2015 and 2016, both of the 200 micro companies in the index, and of the 240 micro-manufacturing companies in the sample corresponding to the selected subsectors has been obtained, the next step is to apply the respective methodology and estimate the covariances and variances required to obtain the resulting Beta coefficients. This will reflect the individual risk that each of the manufacturing sub-sectors presents with respect to the total of micro-companies considered in the index, the corresponding estimates are presented in the results section.
III. Results
Taking into consideration the previous literature review as well as the presentation of the methodology consisting of elaborating an own index of micro companies and obtaining the Beta corresponding to a selection of micro enterprises belonging to the selected subsectors in the manufacturing industry; the respective estimates are made. As previously mentioned, the horizon to be evaluated in this study was determined based on the information required by the model as well as the data obtained through the agreement with the consulting firm. The required data correspond to the years: 2012, 2013, 2014, 2015 and 2016, is:
Average annual net income of each company for the period to be analyzed
Average annual capital invested by the owners of each company for the period to be analyzed.
Based on these data it is possible to determine the average annual return measured by the Return on Investment (ROI) indicator; which was estimated both for the conformation of the index of 200 micro companies in Mexico, and for the sample of 240 micro enterprises of the selected manufacturing sub-sectors.
Return of the micro business market
Table 4 shows the results corresponding to the average ROI of the 200 micro companies in Mexico, based on the data collected in the research.
Return of the selected manufacturing subsectors
Similarly, table 5 shows the results of the average annual return measured by the ROI corresponding to the subsectors of the manufacturing industry indicated for the specified periods.
Table 5 Annual average ROI of the 240 companies of the selected manufacturing sub-sectors in Mexico for the periods indicated
| Manufacturing subsector | Average Return on Investment | ||||
| 2012 | 2013 | 2014 | 2015 | 2016 | |
| Food industry. | 62% | 100% | 94% | 60% | 88% |
| Manufacture of metallic products | 44% | 75% | 106% | 50% | 61% |
| Beverage and tobacco industry. | 55% | 99% | 100% | 51% | 81% |
| Manufacture of transport equipment | 57% | 113% | 75% | 66% | 97% |
| Plastic and rubber industry | 59% | 71% | 95% | 47% | 69% |
| Manufacture of products based on non- metallic minerals. | 57% | 85% | 84% | 62% | 83% |
| Manufacture of clothing. | 51% | 93% | 80% | 47% | 75% |
| Chemical industry. | 73% | 101% | 118% | 51% | 78% |
Source: own elaboration based on research results.
Based on the results presented in tables 4 and 5, it is possible to elaborate the estimates required to obtain the Beta risk coefficient for each of the subsectors with respect to the entire microenterprise market in Mexico. It is important to mention that in order to optimize the presentation of the results in this study, only the breakdown of the calculations corresponding to the food industry sub-sector will be presented, the respective calculations of the other subsectors will be made in the same way and the final results of all the subsectors will be shown at the end.
Analysis of the performance of selected subsectors belonging to the manufacturing industry in Mexico by period
Using the results of the estimated returns, the difference between the values of the return of each year and the average of all the analyzed values is estimated as shown in equation 1.
Equation 1
Analysis of the return of selected subsectors belonging to the manufacturing industry in Mexico by period
Analysus o the selected subsector by period = Subsector return per period - Average subsector return
Source: own elaboration based on research results.
By performing all the corresponding calculations for each of the five evaluation years, the results presented in table 6 are obtained.
The operations described for the food industry are also calculated for the rest of the manufacturing sub-sectors. These results will be used to estimate the variance between the returns of the sub-sectors and the performance of the micro-enterprise market in Mexico.
Table 6 Analysis of the companies in the food industry subsector.
| Year | Average return of the food industry | Food industry return - average return |
| 2012 | 62.29% | -18.33% |
| 2013 | 99.56% | 18.95% |
| 2014 | 93.73% | 13.11% |
| 2015 | 59.82% | -20.80% |
| 2016 | 87.68% | 7.06% |
| Average | 80.62% |
Source: own elaboration based on research results.
Analysis of the performance of the microenterprise market in Mexico for each year of analysis
In a similar way to the previous analysis of the subsectors, it is required to calculate what is presented in equation 2 regarding the returns of the microenterprise market in Mexico.
Equation 2 Analysis of the return of the micro business market in Mexico
Analysis of the return of the micro business market per year = Return of the micro business market of the period - Average performance of the micro business market
Source: own elaboration based on research results.
The results corresponding to the micro business market are presented in table 7.
Table 7 Analysis of the performance of the micro business market in Mexico
| Year | Average return of the micro business market | Return of the micro business market - average return |
| 2012 | 41.08% | -4.11% |
| 2013 | 44.16% | -1.04% |
| 2014 | 48.71% | 3.51% |
| 2015 | 37.72% | -7.47% |
| 2016 | 54.31% | 9.11% |
| Average | 45.20% |
Source: own elaboration based on research results.
The results shown in table 7 are considered representative of the totality of microenterprises in Mexico, so the same data expressing the difference between the return respective to each year, and its average are used to calculate its covariance with respect to the returns of each one of the manufacturing sub-sectors analyzed.
Covariance
Based on the analysis of the returns of both the market index and the selected subsectors, it is possible to calculate the covariance between both data corresponding to each period of analysis. The covariance is estimated as shown in equation 3 by multiplying each of the sub-sector returns by the corresponding to the market for the same year; finally, these results are added as shown in table 8.
Equation 3 Estimation of Covariance
Covariance = Analysis of subsector's return X Analysis of the total market's return
Source: own elaboration based on research results.
Table 8 Covariance between the analysis of the return of companies in the food industry and the analysis of the return of the micro-enterprises market in Mexico
| Year | Food industry return - average return | Return of the micro business market - average return | Covariance |
| 2012 | -18.33% | -4.11% | 0.007536 |
| 2013 | 18.95% | -1.04% | -0.001972 |
| 2014 | 13.11% | 3.51% | 0.004607 |
| 2015 | -20.80% | -7.47% | 0.015541 |
| 2016 | 7.06% | 9.11% | 0.006435 |
| Summation | 0.032146 |
Source: own elaboration based on research results.
The operations presented in table 8 are also calculated for the rest of the chosen subsectors; the results corresponding to the covariances will be used to estimate the risk Beta coefficient.
Variance
In order to determine the risk Beta coefficient, it is necessary to additionally calculate the variance corresponding to the market returns during the period of analysis. To do this, the estimated values of the market’s return for each period are used subtracting its average and then it is squared as shown in equation 4.
From this estimate for each year, table 9 is presented corresponding to the total of micro companies in the index.
Equation 4 Estimation of Variance
Variance = (Analysis of the micro business market's return) 2
Source: own elaboration based on research results.
Table 9 Variance of the performance of the micro business market in Mexico
| Year | Return of the micro business market - average return | Variance |
| 2012 | -4.11% | 0.0016905036 |
| 2013 | -1.04% | 0.0001083270 |
| 2014 | 3.51% | 0.0012339247 |
| 2015 | -7.47% | 0.0055847929 |
| 2016 | 9.11% | 0.0083043067 |
| Summation | 0.016922 |
Source: own elaboration based on research results.
Taking into account that the information corresponding to the returns of microenterprises in Mexico represents the self-constructed index, the results obtained from the variances and their summation will be used to estimate the beta coefficient of each of the selected subsectors.
Once the sum of the covariances estimated from the returns of the subsectors corresponding to the manufacturing industry and the sum of the variances of the returns related to the market of micro companies have been calculated, it is possible to determine the desired Beta coefficients.
Obtaining the Beta risk coefficients for the manufacturing sub-sectors
Using as a basis the data of covariance and variance previously estimated, it is possible to obtain the beta coefficient as shown in equation 5.
Equation 5 Beta risk coefficient estimation of the food industry subsector.
Source: own elaboration based on research results.
By replacing the variables with the corresponding values, equation 6 is obtained.
Equation 6 Beta estimated for the micro companies belonging to the food industry manufacturing subsector in Mexico
Source: own elaboration based on research results.
According to this result, it can be affirmed that the Beta risk coefficient for microenterprises dedicated to the manufacturing subsector of the food industry in Mexico with respect to all the microenterprises at the national level is 1.900. Likewise, when performing the respective estimates for the rest of the selected sub-sectors, the results shown in table 10 are obtained.
Table 10 Beta risk coefficients for the manufacturing sub-sectors in Mexico described
| Manufacturing subsector | Number of companies | Beta Coefficient |
| Food industry. | 30 | 1.900 |
| Manufacture of metallic products | 30 | 1.751 |
| Beverage and tobacco industry. | 30 | 2.201 |
| Manufacture of transport equipment | 30 | 1.807 |
| Plastic and rubber industry | 30 | 1.777 |
| Manufacture of products based on non-metallic minerals. | 30 | 1.603 |
| Manufacture of clothing. | 30 | 1.770 |
| Chemical industry. | 30 | 2.019 |
Source: own elaboration based on research results.
The shown results allow to identify that the risk coefficients of the manufacturing subsectors range from 1.603 for the manufacture of products based on non-metallic minerals, to 2.201 corresponding to the beverage and tobacco industry. Thus, for every 1.00% that increases the profitability of the microenterprise market in Mexico, the performance corresponding to the subsector of products based on non-metallic minerals will increase by 1.603%, the manufacture of metallic products will grow 1.751%, the clothing manufacturing will increase by 1.770%, the plastic and rubber industry will increase by 1.777%, the manufacture of transport equipment will grow by 1.807%, the food industry will rise by 1.900%, the chemical industry will increase by 2.019 % and the subsector of beverage and tobacco industry will grow by 2.201%
Additionally, it is important to highlight that all the estimated Betas present positive values that are greater than 1, which indicates that the selected sub-sectors of the manufacturing industry are more sensitive or volatile than the market in general; obtaining an average for the eight estimated coefficients of 1.853 as an overall factor. Based on the theoretical foundations of the Beta risk coefficient, this indicates that investment in these subsectors will be advisable in times of economic boom and inadvisable in times of turbulence.
Conclusions
In order to establish the own index, data on the return of 200 micro businesses in Mexico was collected and analyzed, corresponding to the years of: 2012, 2013, 2014, 2015 and 2016; and measured through the financial indicator Return on Investment. Similarly, the ROI of a sample of 240 micro enterprises divided into 30 organizations belonging to each of the eight selected manufacturing subsectors was used matching the same time horizon of analysis; which allowed to determine its sensitivity with respect to the index of the total constructed market.
By making all the estimates corresponding to the Beta risk factor calculation methodology and obtaining the respective variances and covariances, it was possible to identify the following beta risk coefficients for each subsector: food industry = 1.90, metal product manufacturing = 1.75, industry of beverages and tobacco = 2.20, transport equipment manufacture = 1.80, plastic and rubber industry = 1.77, manufacture of products based on non-metallic minerals = 1.60, manufacture of clothing = 1.77 and chemical industry = 2.01 .
Taking into consideration the positive symbol of the estimated betas, it can be concluded that the micro companies belonging to the subsectors of the selected manufacturing subsectors move in the same direction as the totality of the micro-enterprises in Mexico, meaning to the entire market index. Similarly, the magnitude presented in the calculated coefficients indicates a significant sensitivity with respect to the entire index, therefore these subsectors must be considered as more risky or volatile than the market. From the data obtained, we can consider the subsector of manufacturing non-metallic mineral based products as the least volatile with a beta of 1.60 and that corresponding to the beverage and tobacco industry as the most sensitive or risky with a respective value of 2.20.
Concerning decisions to initiate or increase investment in microenterprises belonging to these subsectors of the manufacturing industry, business decision-makers should consider that due to systematic or non-diversifiable risk, the Beta risk coefficients obtained indicate a greater sensitivity than the market and in the same direction for all subsectors; so they will move more than proportionally with respect to bullish or bearish changes in the performance of micro businesses in general.
Regarding the research question or hypothesis raised at the beginning of this study, it was found that by forming an own index using information corresponding to a sample of micro businesses in Mexico, it is possible to estimate risk Betas for certain subsectors, allowing opportune conclusions to be drawn and effectively support business decision-making. Particularly contributing with a useful tool for the contextualized and appropriate estimation of risks for the micro companies, which serves as support to obtain more and better financing options required for its sustained growth.
Finally, it is considered that subsequent contributions regarding to this same line of research can be oriented to estimate the Beta risk coefficients of different types of sub-sectors inside and outside the manufacturing sector, as well as to consider companies with different characteristics for the construction of databases. In this way, it will be possible to group the results of a large number of economic subsectors and have several Beta risk coefficients available to determine the financial risk and contribute to the optimal decision-making of the different stakeholders involved.

