


 texto en
  Inglés (pdf)
 Artículo en XML
 Referencias del artículo
 Enviar artículo por email
 Citado por SciELO
  Similares en
SciELO
Similares en
SciELO 
 Permalink
INTRODUCTION
The negative energy balance (BEN) comprises the deficit between the energy consumption by the animal and the energy required for maintenance, the pregnancy in the pregnant cow and the energy for lactation in the lactating cow (van Hoeij et al., 2017). During this period, the energy requirements increase in response to the increase in milk production (PL) (Lucey et al., 2017) and reach their maximum approximately six weeks postpartum (p.p.) (Contreras et al., 2018). However, dry matter (DM) consumption begins to decrease after childbirth (Dorea et al., 2017), and the higher energy consumption may not be reached until week sixteen p.p. (Sheehy et al., 2017). Therefore, the cow could reach a positive energy balance (BEP) around 100 days p.p. (van Hoeij et al., 2017).
The BEN, leads to a decrease in glucose (GLU) and insulin in blood (Ruoff et al., 2016), and mobilization of non-esterified fatty acids (AGNE), these fatty acids are used as an energy source by β-oxidation (Abdelli et al., 2017), but when the mobilization of them is excessive, they are restructured as triacylglycerol (TAG). Together with this process, alternative hepatic pathways are activated, highlighting the formation of ketone bodies such as β-hydroxybutyrate (β-HBA) and the formation and storage of cholesterol (COL) (Sun et al., 2016).
Therefore, this research project aims to quantify AGNE, β-HBA, TAG and COL during the BEN, in Holstein cows of the SEDENA No 1 farm, San Juan, Querétaro, in order to identify their behavior over time, from hematochemical measurements.
MATERIAL AND METHODS
Location and animals. The experiment followed the guidelines of the Institutional Committee for Animal Care and Use of the University of Colima. The study was carried out with 250 blood sera, belonging to 50 Holstein cows, clinically healthy, with 660±20 kg of live weight (LW) and 26.4±1.65 L/d of milk with 2.88 ± 0.21 g/100 ml of protein milk and 3.37 ± 0.56 g/100 ml of milk fat. All the cows were located in the SEDENA No. 1 farm, San Juan, Queretaro, Mexico, at an altitude of 1,856 m a.s.l, with a warm semi-arid climate (Köppen, BSh) (Peel et al., 2007); with an average temperature of 21 °C. The nutritional requirements of the cows were estimated according to (NRC, 2001). The cows were fed twice a day with fully mixed ration (RTM) of corn silage, alfalfa hay and cottonseed (table 1). They also received calcium soaps of distilled fatty acids from palm oil (By Fat, NOREL MEXICO., El Marqués-Querétaro, Mexico) at a rate of 400 g/d, 0.3 kg of sodium bicarbonate (NaHCO3), and mineral supplement with carbonate of calcium, magnesium sulfate, calcium orthophosphate, trace minerals (table 2) and fresh water at free access.
Table 1 Nutritional composition of the fully mixed ration for lactating cows, farm SEDENA No 1. San Juan, Querétaro
| Components, Dry mass (DM) | Nourishment | Reference* |
|---|---|---|
| Crude protein (PC),% | 16.7 | 14.1 |
| Net Breastfeeding Energy (ENL), Mcal / kg | 1.82 | 1.75 |
| Neutral Detergent Fiber (FND),% | 31.6 | 29.0 |
| Acid Fiber Detergent (FAD),% | 22.0 | 19.0 |
| Calcium (Ca2+),% | 1.34 | 0.62 |
| Phosphorus (P 2+),% | 0.39 | 0.32 |
| Magnesium (Mg2+),% | 0.30 | 0.20 |
| Potassium (K+),% | 1.75 | 1.00 |
| Sodium (Na+),% | 0.45 | 0.22 |
| Zinc (Zn2+), mg/kg | 58.0 | 43.0 |
| Copper (Cu2+), mg/kg | 8.30 | 11.0 |
| Cobalt (Co2+), mg/kg | 0.70 | 0.11 |
*NRC requirements for a Holstein cow with 680 kg of PV and 25 L / d of milk production.
Table 2 Composition of the mineral supplement for lactating cows, farm SEDENA No 1. San Juan, Querétaro
| Calcium (Ca2 +), g | 96.50 |
| Phosphorus (P2 +), g | 25.40 |
| Magnesium (Mg2 +), g | 14.50 |
| Sodium chloride (NaCl), g | 48.60 |
| Zinc (Zn2 +), mg/kg | > 25,600 |
| Copper (Cu2 +), mg/kg | > 8,800 |
| Cobalt (Co2 +), mg/kg | > 1,900 |
| Methionine (Met), mg/kg | > 81,800 |
| Lysine (Lis), mg/kg | > 37,700 |
Blood sampling. When considering that the peak of PL and the maximum point of lipid mobilization are located in a common way at 60 d p.p. (Guyot et al., 2017; Contreras et al., 2018). After delivery, the first sampling was performed at 7 d, the second at 15 d and the three remaining at 30, 45 and 60 d. Blood samples were obtained by puncturing the coccygeal vein, using vacuum tubes of 8.5 ml, with coagulation activator and gel separator (BD Vacutainer 367988, Becton-Dickinson Co., Franklin Lakes, United States), after the first milking in the morning and before feeding. To obtain the serum, the samples were centrifuged directly in the stables, at 1,500 x g for 10 min, using a portable centrifuge (Porta-Spin C828, UNICO, Dayton, United States). Subsequently, the sera were separated using 5 ml tubes with lid (Tubes 933008; Eppendorf., Madrid, Spain), were frozen at -20 °C (Biomedical Freezer MDF-U5412H-PE, PHC Europe BV, Amsterdam, The Netherlands) and transported with refrigerant gel for a maximum period of 2 h, in an 18 L flexible cooler (Cooler Flex Go M5644-710; The Coleman Company, Kansas, United States), where the serum remained frozen until analysis.
Determination of biochemical analytes. The concentration of AGNE, β-HBA, TAG and COL was determined by spectrophotometry (Biochemistry Analyzer ES-218 UV-Vis, KONTROLab, Guidonia, Italy). The biochemical analytes, the analytical method of each parameter, the units in which the results were expressed and the corresponding commercial reagents, are described in Table 3.
Table 3 Biochemical analytes, units, methods and corresponding commercial reagents
| Analyte | Unit | Method | Reactive |
|---|---|---|---|
| Non-esterified fatty acids (AGNE) | mM | Enzymatica | FA 1152 |
| β-hydroxybutyrate (β-HBA) | mM | Enzymaticb | RB 10072 |
| Triacylglycerol (TAG) | mM | Colorimetric. Liquidc | 410321 |
| Cholesterol (COL) | mM | Colorimetricd | 410201 |
aSynthetase-Oxidase-Peroxidase; bβ-hydroxybutyrate dehydrogenase; cGlycerol phosphate dehydrogenase-peroxidase; dColesterol oxidase-peroxidase; 1Spinreact., Gerona, Spain; 2Randox Laboratories., Northern Ireland, United Kingdom.
The electromagnetic spectrum was scanned according to the Beer-Lambert law, whose equation is:
where:
|
range of light captured by the photocolorimetry tube; |
|
range of light coming out of the photocolorimetry tube; |
|
molar extinction coefficient; |
|
length (cm) of the photocolorimetry tube; and |
|
concentration of the sample located in the photocolorimetry tube |
The precision and accuracy for the reproducibility of the techniques was controlled by the use of lyophilized control serum (SPINTROL NORMAL 1002100; Spinreact., Girona, Spain) and (Assayed Bovine Multi-Sera AL 1027; Randox Laboratories, Northern Ireland , UK). The hemolysis of serum was recorded on a qualitative scale from 0 (not at all) to 3 (dark). Serums with interference by hemolysis with score 2 or higher were rejected.
Statistical analysis. For the treatment of the data obtained, the statistical program was used (SAS, System, v. 9.0.2, Cary, NC). The 95 % confidence intervals followed the recommendation of the International Federation of Clinical Chemistry (Solberg, 1987). The presence of atypical data for each analyte was determined. All values with ±3 standard deviations (DE) of the mean were discarded. The resulting data set was analyzed by Gaussian distribution, and the percentiles: P10-P90 and P25-P75 were determined by (PROC UNIVARIATE, SAS, 2010). The comparison between groups (7, 15, 30, 45 and 60 d p.p.) was carried out by (PROC ANOVA; SAS, 2010) and frequency histogram. When a significant effect was found per group (P <0.05), the Tukey multiple comparison test was performed.
RESULTS
The descriptive statistics for: AGNE, β-HBA, TAG and COL, determined from 250 blood sera of Holstein cows, and their respective international reference values are shown in table 4.
Table 4 Mean (x), standard deviation (DE), reference value, confidence interval (IC) and percentiles (P10-P90) and (P25-P75) for different biochemical analytes, n = 250 blood sera from Holstein cowsa
| Analyte | x ± DE | Referenceb | ICc | P10-P90 | P25-P75 |
|---|---|---|---|---|---|
| Non-esterified fatty acids (AGNE) | 0.10 ± 0.04 | 0.40 ± 0.20 | 0.10 - 0.11 | 0.05 - 0.16 | 0.10 - 0.11 |
| β-hydroxybutyrate (mM) | 0.49 ± 0.16 | 0.41 ± 0.03 | 0.47 - 0.51 | 0.28 - 0.73 | 0.39 - 0.59 |
| Triacylglycerol (mM) | 0.11 ± 0.03 | 0.10 ± 0.10 | 0.10 - 0.11 | 0.06 - 0.16 | 0.09 - 0.14 |
| Cholesterol (mM) | 3.94 ± 1.15 | 2.59 ± 0.51 | 3.79 - 4.08 | 2.50 - 5.57 | 3.08 - 4.72 |
a 660 ± 20 kg of alive weight (PV) y 26.4 ± 1.65 L/d of milk, with 2.88 ± 0.21 g/100 mL of milky protein and 3.37 ± 0.56 g/100 mL of milky grease; b(Kaneko et al., 2008); c confidence interval at to 95%.
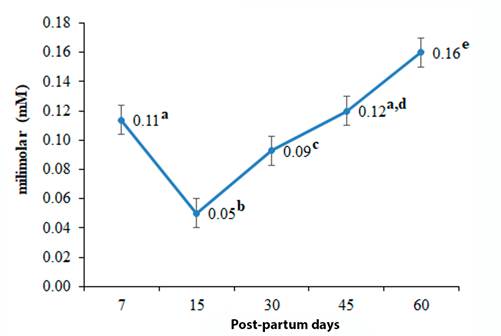
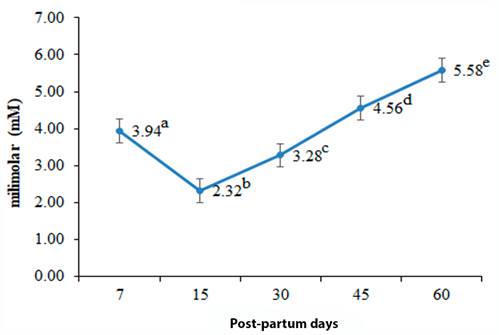
The concentration of AGNE, β-HBA and TAG, is consistent with the values reported internationally. The COL showed a value slightly higher than the reference. The AGNE did not present differences between groups, the β-HBA registered its highest value (0.74 ± 0.08 mM) at 15 d p.p., (table 5); its lowest concentration (0.27 ± 0.06 mM) was quantified at 60 d p.p. The TAG showed its highest concentration (0.16 ± 0.01 mM) at 60 d p.p; its lowest value (0.05 ± 0.01 mM) was recorded at 15 d p.p. The concentration of COL quantified its highest value (5.58 ± 0.39 mM) at 60 d p.p; its lowest concentration (2.32 ± 0.51 mM) was recorded at 15 d p.p.
Table 5 Comparison of different biochemical analytes, during different postpartum days, n = 50 Holstein cows/group
| 7 | 15 | 30 | 45 | 60 | |
|---|---|---|---|---|---|
| Analyte | Post -partum days | ||||
| Non-esterified fatty acids (AGNE) | 0.13 ± 0.05a | 0.14 ± 0.06a | 0.12 ± 0.02a | 0.12 ± 0.03a | 0.12 ± 0.01a |
| β-hydroxybutyrate (mM) | 0.57 ± 0.02a | 0.74 ± 0.08b | 0.48 ± 0.02c | 0.40 ± 0.01d | 0.27 ± 0.06e |
| Triacylglycerol (mM) | 0.11 ± 0.01a | 0.05 ± 0.01b | 0.09 ± 0.01c | 0.12 ± 0.01ª,d | 0.16 ± 0.01e |
| Cholesterol (mM) | 3.94 ± 0.18a | 2.32 ± 0.51b | 3.28 ± 0.22c | 4.56 ± 0.20d | 5.58 ± 0.39e |
* Within lines values with different letters differ significantly from each other (P <0.05). All data are presented by mean ± ED (P <0.05).
DISCUSSION
During the BEP, dairy cows of high genetic value have a low lipid mobilization and their AGNE concentration is approximately 0.25 mM (da Fonseca et al., 2004). Concentrations higher than 0.40 mM indicate BEN and a high lipid mobilization (Oetzel, 2004). According to this reference, none of the cows sampled showed evidence of high lipid mobilization, because only three cows exceeded 0.25 mM for AGNE. In recent years to discriminate between healthy cows and cows affected by subclinical ketosis, different cut-off points have been used between 1 and 1.4 mM, with respect to serum concentrations of β-HBA (Contreras et al., 2018).
In the present study, the AGNE did not present differences between groups, but an increase of β-HBA was observed at 15 d p.p. (Figure 1), and then a progressive decrease was quantified as breastfeeding progressed.

These data suggest that the concentration of AGNE could be an indicator of subclinical ketosis, less efficient compared to β-HBA. Assumption consistent with that reported by Ruoff et al. (2016) and Abdelli et al. (2017), who indicated that during the dry period, the use of AGNE is a better indicator of BEN compared to β-HBA, but that in p.p. cows, β-HBA is more useful.
The BEN presents an inadequate biosynthesis of GLU, accompanied by a lower stimulation of the β cells of the pancreas, compromising the release of insulin (Abdelli et al., 2017). Consequently, during the first weeks p.p., there is marked hypoglycaemia (Jump, 2011). The metabolism of dairy cows, responds to this situation with the hydrolysis of TAG stored in the adipose tissue, obtaining AGNE that can be oxidized within the hepatic mitochondrial matrix (García et al., 2015), for the production of acetyl-Coenzyme A (Wakil and Abu-Elheiga, 2009). During the consecutive condensation of acetyl-Coenzyme A, acetoacetate (AcAc) is obtained as an alternative product (Ruoff et al., 2016), and part of it is reduced by β-hydroxybutyrate dehydrogenase to β-HBA (García et al., 2015). Therefore, during the first days of lactation its concentration rises slightly in response to lipid mobilization, and decreases when the energy balance becomes positive (Sun et al., 2016). This information is consistent, with the results obtained here (figure 1), and since the increase in this analyte was observed until 15 d p.p., and then a progressive decrease was quantified as lactation progressed.
During the BEN proper of early lactation, the reserves of body fat are mobilized and the AGNE transported by albumin (ALB) (Imhasly et al., 2015), reach the liver where they are oxidized or esterified in TAG (Jump, 2011). The temporary accumulation of TAG in the liver of dairy cows is a normal physiological process (Argüeso et al., 2011). All cows have a moderate degree of hepatic lipidosis after the dry period, and accumulate GAD in the liver during the first days p.p. (Abdelli et al., 2017). Therefore, this accumulation is partially responsible for the low concentration of TAG at 15 and 30 d in the bloodstream (Figure 2).
With respect to the COL and its concentration slightly above the reference, it is worth considering the nutritional contributions, since foods high in fat can increase the concentration of COL. Moreover, Duske et al. (2009) and Zárate-Martínez et al. (2011) indicated that dairy cows supplemented with inert fats in the rumen presented a slight increase in serum concentration of COL. This information is consistent with our results, since the cows in the study were provided with calcium soaps of distilled fatty acids from palm oil (By Fat, NOREL MEXICO, El Marqués Querétaro, Mexico) at a rate of 400 g/d.
On the other hand, it is appropriate to point out that only a small part of the COL contained in the milk originates de novo in the mammary gland; whereas the uptake of blood COL during the first weeks p.p. is much more accentuated (Folnožić et al., 2015). In this regard, Mani et al. (2009) and Mani et al. (2011) reported that messenger ribonucleic acid (mRNA) transcripts of the ABCA1 and ABCG1 transporters, responsible for regulating the entry of phospholipids and COL into the lactocytes, exhibit different patterns through lactation, quantifying their greater expression before of the 20 d pp For this reason, the decrease of COL in the bloodstream at 15 d p.p. (Figure 3) could be explained by an increase in the flow of COL to the mammary gland, product of the greater expression of ABCA1 and ABCG1 transporters.
CONCLUSIONS
The concentration of AGNE, β-HBA and TAG, is consistent with the values reported internationally. The concentration of COL (3.94 ± 0.18 mM) showed a value slightly higher than the references. The AGNE did not present differences between groups (7, 15, 30, 45 and 60 d p.p.); β-HBA registered its highest value (0.74 ± 0.08 mM) at 15 d p.p., and lowest (0.27 ± 0.06 mM) at 60 d p.p. The TAG and the COL showed their highest concentration (0.16 ± 0.01 mM and 5.58 ± 0.39 mM respectively) at 60 d p.p., and the lowest (0.05 ± 0.01 mM and 2.32 ± 0.51 mM respectively) at 15 d p.p. The calculated confidence intervals could be used at the herd level to detect alert situations, when at least 5 % of the cows; in the sample are outside the reference range.

