


 texto en
  Inglés (pdf)
 Artículo en XML
 Referencias del artículo
 Enviar artículo por email
 Citado por SciELO
  Similares en
SciELO
Similares en
SciELO 
 Permalink
INTRODUCTION
The fatty acids Omega 3 (Agn3), eicosapentaenoic (EPA: 20: 5, n-3) docosahexanoic (DHA 22: 6, n-3) and DHA (decosahexaenoic acid), are important components of cell membranes and precursors of many other substances in the body. There is increasing evidence that these types of acids regulate blood pressure, inflammatory response and there is a growing interest in the role they can play in the prevention of diabetes and certain types of cancer (Simopoulos 2009). In addition to being involved in the maturation and brain and retinal growth of the child. They intervene in the processes of coagulation, blood pressure, reproductive organs and fatty metabolism. These essential fatty acids intervene in the reduction of cholesterol transported in low density lipoproteins (bad cholesterol) and facilitating the increase of high density lipoproteins (good cholesterol), which are those that clean the arteries instead of deteriorating them; which helps to avoid cardiovascular problems (Morales-Barrera et al., 2013a,b).
In several countries of the world several investigations have been carried out, using different ingredients to achieve the increase of these n-3 fatty acids in the egg; even in chicken meat with excellent results, with the addition of different marine and vegetable products. In Mexico, few studies have been carried out, Castillo, (2004), used sardine oil; Carrillo-Domínguez et al., (2005), used red crab meal; Carrillo et al., (2012) used sardine oil and conjugated linoleic acid to modify the fatty acids in the egg; Tuna oil in chicken and laying hen was used by Morales-Barrera et al., (2013 a,b).
Because there is little literature on the use of BTM to modify the levels of Omega 3, and if the increase in the age of the laying hen retains the deposition of fatty acids; the objective of determining the effect of the addition of different concentrations of BTM on the levels of Omega 3 fatty acids, quality in the egg, productive variables of the birds and their organoleptic characteristics was proposed.
MATERIAL AND METHODS
A total of 144 Hy Line W36 lineage hens of 34 weeks of age were used, which were distributed in 4 treatments with 4 replicates of 9 birds each, using a 3 x 4 factorial design; where one factor was time (month 1,2 and 3), and another factor was the inclusion level of BTM (0, 1, 2, 3 %). For the time factor it does not increase the "n" of the experiment, since the experimental unit is the same, with the measurements repeated throughout the time the experiment lasted.
The chickens were housed in cages; each of the departments was placed an automated cup drinker; for the food ration a channel feeder was used, with separation by bird compartment; food and water were administered ad libitum. The zootechnical management was carried out according to the physiological needs and the lighting program was adjusted according to the manual of the line.
The physiological feeding needs were covered in accordance with the strain's specifications; the black tuna meal was included in the following proportions: 0, 1, 2 and 3 % (table 1). To ensure the animal welfare of the birds, the study was conducted in accordance with the policies established by the Institutional Committee for the Care and Use of Experimental Animals-Birds of the Faculty of Veterinary Medicine and Zootechnics of the National Autonomous University of Mexico (CICUAE-Aves, FMVZ-UNAM, 2003). The four diets were isocaloric and isonitrogenated, (table 1), covering the nutritional needs for laying hens according to the NRC (1994).
Table 1 Composition of the diets for laying hens, where different percentages of black tuna meal were included.
| Ingredients (g/100 g of sample ) | 0 % | 1 % | 2 % | 3 % |
|---|---|---|---|---|
| Corn | 65.978 | 66.899 | 67.818 | 68.736 |
| Soy (46 % PCT*) | 21.895 | 20.309 | 18.723 | 17.139 |
| Calcium carbonate | 8.190 | 8.143 | 8.096 | 8.049 |
| Ortofosfato | 2.646 | 2.351 | 2.059 | 1.766 |
| Black tuna meal | 0 | 1 | 2 | 3 |
| Salt | 0.350 | 0.350 | 0.350 | 0.350 |
| Liquid Avelut (Pigmento vegetal) | 0.100 | 0.100 | 0.100 | 0.100 |
| Premix of Vitamins** | 0.125 | 0.125 | 0.125 | 0.125 |
| Premix of Minerals*** | 0.125 | 0.125 | 0.125 | 0.125 |
| Calculated contribution | ||||
| Crude protein (%) | 16 | 16 | 16 | 16 |
| Metabolizable energy (Kcal / kg) | 2,900 | 2,900 | 2,900 | 2,900 |
| Threonine | 0.660 | 0.660 | 0.660 | 0.660 |
| L-Lysine | 0.880 | 0.880 | 0.880 | 0.880 |
| Methionine 98 | 0.302 | 0.300 | 0.298 | 0.296 |
| Methionine + cysteine | 0.790 | 0.790 | 0.790 | 0.790 |
| Calcium (mg / 100 g) | 4 | 4 | 4 | 4 |
| Available phosphorus (mg / 100 g) | 0.450 | 0.450 | 0.450 | 0.450 |
*PCT = Total crude protein
** Diets in kg in the diet: vitamin A, 12,000 IU; vitamin D3, 25,000 IU; Vitamin E, 30 IU; vitamin K3, 2 mg; thiamine 2.25 mg; riboflavin, 7,500 mg; vitamin B6, 3,500 mg; vitamin B12, 0.020; niacin, 45 mg; pantothenic acid, 12.5 mg; biotin 0.125 mg; folic acid, 1,500 mg.
*** Diets in mg / kg of diet: Zinc, 50; copper, 12; iodine, 0.300; cobalt, 0.200; iron, 110; selenium, 0.100; manganese
The response variables were: body weight, egg weight, daily and weekly food consumption, mortality, feed conversion and number of eggs produced/food consumption. In the production it was taken into account; shell thickness, yolk color, Haugh units; cholesterol concentrations, total lipids, saturated fatty acids, monounsaturated, polyunsaturated, Omega-3, eicosapentaenoic (EPA), docosahexaenoic (DHA) and α-linolenic (ALA) and omega-6 linoleic (LA) and arachidonic (AA). In the organoleptic test where 26 regular egg consumers judges participated, which applied a level of taste test in terms of egg yolk color, smell and taste with a hedonic scale of 5 points; which correspond to: 5 "dislike a lot", 4 "dislike little", 3 "is indifferent", 2 "like little", 1 "like a lot" (Pedrero and Pangborn, 1989).
The results obtained in the production and laboratory variables were analyzed using the statistical package SAS, (2002), using the analysis of variance for a completely random design with a factorial model, where one factor was time (month 1, 2 and 3), and another factor was the inclusion level of BTM (0, 1, 2 and 3. The differences between treatments were analyzed with the Tukey test, with a level of significance of P <0.05. The Kruskal-Wallis test at P <0.05 was used.
RESULTS
The consumption of food increased over time, and the highest consumption was in the treatment where BTM did not have it; no significant effects were observed in the interactions of the variables analyzed. Egg weight increased gradually over time, which was the same in all treatments (P> 0.05). The body weight did not differ (P> 0.05) in the time factor of time and without the addition of BTM, the weight was higher with respect to the different inclusion levels of BTM.
The feed conversion decreased with time, so the birds were less efficient; on the other hand, as the level of inclusion of the BTM increased, a positive effect was observed. The mortality of the birds did not differ in both factors. Egg production was improved in month 2, but decreased in month 3; the same production was maintained at the different levels of BTM. Haugh Units (UH) were improved over time and decreased with increasing BTM inclusion levels; the thickness of the shell was not affected in both factors. It should be mentioned that in all the analyzed variables no interactions were found (Table 2).
When increasing the level of inclusion of BTM, the cholesterol levels were higher, with respect to the total lipids, they increased with time; but they did not show differences to the different inclusions of BTM ; the DHA had a gradual increase as the BTM was increased, the ALA levels did not show significance. In the case of arachidonic acid (AA) and the linoleic acid (LA), no statistical difference was observed at time of inclusion, but as BTM increased, its concentration decreased, as shown in Table 3.
Table 2 Effect of time and inclusion level of black tuna meal on production variables
| Factor | Food consumption (g) | Egg weight (g) | Body weight (g) | Food conversion | Mortality (%) | Production (%) | Haugh units | Shell thickness (mm) |
|---|---|---|---|---|---|---|---|---|
| Month | Time | |||||||
| 1 | 97.53 ± 9.11a | 58.16 ± 1.47c | 1652.20 ± 115.89b | 1.84 ± 0.13c | 1.04 ± 0.72a | 82.13 ± 4.29a | 85.98 ± 2.16b | 0.400 ± 0.035a |
| 2 | 101.18 ± 7.02a | 59.82 ± 1.37b | 1691.60 ± 114.03a | 1.96 ± 0.10b | 0.69 ± 0.61a | 86.73 ± 2.28b | 87.88 ± 2.35a | 0.400 ± 0.035a |
| 3 | 103.15 ± 5.68a | 60.84 ± 1.46a | 1688.50 ± 129.85a | 2.05 ± 0.11a | 0.34 ± 0.44a | 83.12 ± 3.26a | 89.69 ± 1.46a | 0.400 ± 0.035a |
| Inclusion percentage | INCLUSION LEVEL OF BLACK TUNA MEAL | |||||||
| 0 | 104.56 ± 7.21a | 60.47 ± 1.05a | 1829.60 ± 46.84a | 2.07 ± 0.12a | 0.69 ± 0.25a | 83.99 ± 3.04a | 89.38 ± 1.99a | 0.400 ± 0.01a |
| 1 | 97.91 ± 10.45b | 60.37 ± 1.59a | 1694.20 ± 44.86b | 1.93 ± 0.16b | 0.92 ± 0.81a | 83.96 ± 3.74a | 88.50 ± .54ab | 0.400 ± 0.01a |
| 2 | 90.52 ± 5.96c | 57.49 ± 1.20a | 1519.60 ± 35.65c | 1.89 ± 0.12b | 0.69 ± 0.72a | 84.00 ± 3.95a | 85.87 ± 1.78a | 0.400 ± 0.01a |
| 3 | 96.14 ±11.34bc | 60.10 ± 1.43a | 1666.50 ± 45.59b | 1.90 ± 0.11b | 0.46 ± 0.08a | 84.02 ± 4.98a | 87.65± 2.40ab | 0.400 ± 0.01a |
a,b,c Different literals in each row indicate significant statistical difference between treatments (P <0.05).
Table 3 Different inclusion levels of black tuna meal on cholesterol, total lipids and eicosapentaenoic acid
| Factor | Cholesterol (mg/100 g) | Total lipids (mg/100 g) | DHA (mg/100 g) | ALA (mg/100 g) | AA (mg/100 g) | LA (mg/100 g) |
|---|---|---|---|---|---|---|
| TIME | ||||||
| 1 | 1652.60 ± 32.01a | 32.41 ± 0.58c | 108.50 ± 11.53a | 43.70 ± 8.78a | 418.54 ± 1.37a | 2331.10 ± 236.91a |
| 2 | 1652.30 ± 30.53a | 31.99 ± 0.64b | 121.39 ± 12.36a | 45.98 ± 9.44a | 431.73 ± 1.72a | 2181.90 ± 238.32a |
| 3 | 1652.30 ± 36.00a | 33.59 ± 13.16a | 123.34 ± 13.16a | 46.96 ± 9.90a | 465.34± 2.09a | 2267.00 ± 239.92a |
| INCLUSION LEVEL | ||||||
| 0 | 1528.30 ± 0.32c | 32.94 ± 0.03a | 86.79 ± 0.03c | 50.61 ± 0.03a | 484.12 ± 0.05a | 2381.20 ± 130.42a |
| 1 | 1526.50 ± 1.74d | 32.38 ± 0.85a | 112.22 ± 1.38b | 42.46 ± 0.85a | 455.89 ± 1.39a | 2338.60 ± 169.13ab |
| 2 | 1769.40 ± 3.03b | 33.63 ± 0.77a | 116.19 ± 2.09b | 47.26 ± 0.77a | 381.27 ± 3.12a | 2026.80 ± 292.69b |
| 3 | 1785.40 ± 9.57a | 31.71 ± 1.37a | 155.77 ± 1.61a | 41.85 ± 1.37a | 432.87 ± 2.32b | 2293.30 ± 336.29ab |
a,b,c Different literals in each row indicate significant statistical difference between treatments (P <0.05).
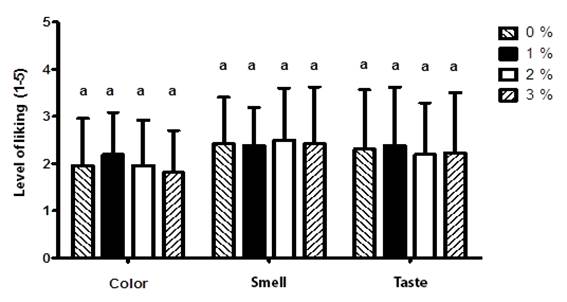
Regarding the organoleptic characteristics, as regards the evaluation of the color preference of the yolks, they did not show differences between the treatments, placing the value "like little". In the smell of the egg, there were no differences between the treatments, here the values prevailed "like little" and "it is indifferent". Regarding taste preference evaluation, no statistical difference was found, whose values were found within "likes little" and is "indifferent" (figure 1).
DISCUSSION
The highest cost in the poultry production units is still the food, so all the efforts that are made will be to reduce it without affecting production and productivity. In the present experiment it is observed that birds increased consumption with age and without the addition of BMT, this agrees to the normal behavior in this stage of life of the birds according to the manual of the lineage (Hy Line 2013). This consumption behavior is consistent with the results obtained by Morales et al., (2013b), where they included tuna oil in chicken diets for the same time of experimentation. Carrillo et al., (2005) added sardine oil to the diets and mentioned that possibly the increase of the addition of omegas 3 in the food cause a decrease in palatability; likewise Ahmed, (2013) when adding fish oil with an addition of 5 % obtained the lowest consumption (89 g) than with lower levels (control 121 g); but they differ from Morales et al., (2013b), since they observed that in 3% of tuna oil there was a considerable increase in consumption in the third month.
The egg weight, reflects that there is an increase of 1 g each month, for the age is considered as a normal behavior according to the manual of the line (Hy Line 2013), which agrees with Betancourt et al., (2009), who they used fatty acids from flax seed for 6 weeks and with Carranco et al., (2011) where they used crustacean meal in chicken diets; but it differs from the results found by Morales et al., (2013b) where they observed a decrease in egg weight in prolonged administrations of tuna oil. In the body weight a gradual increase was observed as the time of administration of BMT increased, the weight of the birds increased; which is justified by increasing the age as indicated in the manual of the line (Hy Line 2013). For the inclusion level factor, the control treatment was heavier and the treatments that received the inclusion of black tuna meal did obtain a lower weight; this differs with Ahmed, (2013) since when incorporating the fish oil to 2.5 and 3.5 % it increased the corporal weight to the birds.
The feed conversion increased with time, because the older the birds, the lower the production and therefore the conversion increases. These results were similar to those obtained by Castillo, (2004) and Carrillo et al., (2012). Mortality did not present statistical differences, which coincides with the majority of authors who have performed tests with the inclusion of Omega 3 in diets, such as: González-Esquerra and Lesson, (2000, 2001); Castillo, (2004); (Castillo-Badillo et al., (2005), Betancourt et al., (2009), Carranco et al., (2011), Carrillo et al., (2012) and Morales et al., (2013b). The production tended to improve over time, but had a fall at the end of the experiment, which could be due to the presence of biogenic amines, which affected the productive performance, however, in the necropsies performed no lesions suggestive of these toxins were found (Meluzzi et al., 2000 and Castillo, 2004) .The shell thickness did not show statistical differences, similar results were obtained by Castillo, (2004), Castillo-Badillo et al., (2005) Cachaldora et al., (2008) and Ahmad et al., (2013) .The Haugh units all values were between 85 and 89 points, which places them within the range between very good and excellent according to the Haugh scale, (1937), which agrees with the results obtained by Carrillo, (2012), Ahmad et al., (2013), Vidal et al., (2013) and Ahmed, (2013) .The color of the yolk, although it is not shown in the results, it did not have significance and it was located in the value 6 according to the colorimetric scale, according to Laudadio et al., (2015) who added olive oil in high and low concentrations; they mention that the high score in the color (12 points) obtained in their experiment was due to the high amount of natural pigments that the oil presents.
The HNA did not modify the cholesterol profiles in the egg yolk, which agrees with the results of Castillo-Badillo et al., (2005) when they used tuna oil, but not with what Hargis et al. (1991) reports, with the inclusion of 3 % of Menhaden meal, since they found that the longer the inclusion time, the lower the cholesterol content in the yolk. The results of cholesterol profiles obtained by Ahmad et al., (2013) and Yi et al., (2014), mention that there were no changes when they added different levels of canola oil, plus vitamin A and linseed oil, flour fish and fructo-oligosaccharides, respectively. Also Laudadio et al., (2015) added extra virgin olive oil; Ahmed (2013) with addition of polyunsaturated fatty acids and Vidal et al., (2013) with peanut oil. All three mentioned that they lowered cholesterol levels when they added the products compared to the control.
The total lipids were increased according to the BMT addition time; to date there are no records of values similar to those obtained in an experiment conducted by Hargis et al., (1991), where Menhaden oil was added for more than three months and García and Albalá (1998); with the addition of fish meal and marine fats they did not show significant differences in lipid content. The values of fatty acid DHA, showed values of 79 % more than what an egg normally contains, so there were no statistical differences in the inclusion time. For the inclusion level of BMT was observed that, the higher percent, the greater the amount of DHA contained in the buds, which agrees with the results obtained by the majority of the researchers, Castillo-Badillo et al., (2005 ); Carrillo et al., (2012); Morales-Barrera et al., (2013b); Laudadio et al., (2015); but not with Vidal et al., (2013) since they mention that the higher the percentage of inclusion of peanut oil, the lower the concentration of DHA. On the other hand, the levels of ALA that were obtained in the present work during the 3 months did not have significant differences, which is contrary to that obtained by Morales-Barrera et al., (2013b), where they report that as it increases the time increase these levels. It was observed that the higher % of BMT is included, the levels of ALA are decreasing, which coincides with the results described by Castillo-Badillo et al., (2005); Carrillo et al., (2012); Morales-Barrera et al., (2013b) and Yi et al., (2014).
The results of the AA coincide with the results obtained by Morales-Barrera et al., (2013b), where there is no statistical difference in terms of time; however, higher percentages lower AA levels similar to the results of Castillo et al., (2005) and Carrillo et al., (2012). The LA did not show statistical changes, which coincides fully with the results obtained by Morales-Barrera et al., (2013b) and the same case with Castillo et al., (2005) and Carrillo et al., (2012). However, a study is still needed to determine if it is low or high density cholesterol.
The egg color was located within the category "like little", which indicates that it did not cause displeasure for consumption; which agrees with the data obtained by Carranco, (2011). For the hedonic test, the level of liking was not reported to be unpleasant by the panelists, since they placed it within the "likes little" and "indifferent" levels, which agrees with the results of Castillo, (2004). In the taste was described by the panelists as "likes little" and it is "indifferent", this shows that it did not cause them any fishy flavor, like the results reported by Oh et al., (1991) with the addition of fish oil and González-Esquerra and Lesson, (2000, 2001), with Menhaden's oil still deodorized; and Castillo (2004) mentions that with 3 % levels of sardine oil in the diet of the hens, the panelists detected a slight fishy taste, but without being disagreeable according to the hedonic scale.
CONCLUSIONS
According to the conditions in which the present work was carried out, it is concluded that the addition of BMT in posture hen diets improves feed conversion and feed consumption, without detriment to the other productive variables; does not modify the organoleptic characteristics in the egg. The inclusion of 3 % of BMT modified the BMT profiles. A decrease in omega 6 AL and AA fatty acids was observed. The organoleptic characteristics of the egg are not modified. Therefore, the addition of BMT in the diet of beneficial birds is recommended.

